` `
벡터 속성 대화창
벡터 레이어의 Layer Properties 대화창은 맵에서 레이어의 피처가 어떻게 보이는지(심볼, 라벨, 도표) 및 마우스와의 상호 작용(액션, 맵 도움말, 양식 디자인)을 관리하는 일반 설정을 제공합니다. 또 레이어에 대한 정보를 제공하기도 합니다.
To access the Layer Properties dialog, double-click on a layer in the legend or right-click on the layer and select Properties from the pop-up menu.
주석
Depending on the external plugins you have installed, new tabs may be added to the layer properties dialog. Those are not presented below.
참고
Live update rendering
The 레이어 스타일 작업 패널 provides you with some of the common features of the Layer properties dialog and is a good modeless widget that you can use to speed up the configuration of the layer styles and automatically view your changes in the map canvas.
주석
원본 프로젝트 파일에서 삽입 레이어(프로젝트 내포 작업 참조)의 속성들(심볼, 라벨, 액션, 기본값, 양식 등등)을 읽어오기 때문에, 이 습성을 방해할 수도 있는 변경 사항이 적용되는 일을 피하기 위해 삽입 레이어에 대해 레이어 속성 대화창을 사용할 수 없게 돼 있습니다.
General Properties
 Use this tab to make general settings for the vector layer.
There are several options available:
Use this tab to make general settings for the vector layer.
There are several options available:
Layer Info
- Set the Layer name to display in the Layers Panel
- Display the Layer source of the vector layer
- Define the Data source encoding to define provider-specific options and to be able to read the file
좌표계
레이어의 좌표계를 PROJ.4 문자열로 표시합니다. 드롭다운 목록에서 최근 사용한 좌표계를 선택하거나
 Select CRS 버튼을 (좌표계 선택기 참조) 클릭해서 레이어 좌표계를 변경할 수 있습니다. 레이어에 적용된 좌표계가 틀렸거나 또는 적용된 좌표계가 없는 경우에만 변경하십시오. 사용자 데이터를 또다른 좌표계로 재투영하고 싶은 경우, Processing 에서 레이어 재투영 알고리즘을 이용하거나 다른 레이어로 레이어를 저장 하는 편이 좋습니다.
- Create a Spatial Index (only for OGR-supported formats)
- Update Extents information for a layer
축척에 따른 가시성
Maximum (inclusive) 및 Minimum (exclusive) 축척을 설정해서 피처가 보이게 될 축척 범위를 정의할 수 있습니다. 이 범위를 벗어나면, 피처를 숨깁니다.  Set to current canvas scale 버튼을 클릭하면 현재 맵 캔버스의 축척을 가시성 범위의 한계값으로 설정할 수 있습니다. 자세한 내용은 축척에 따른 렌더링 을 참조하세요.
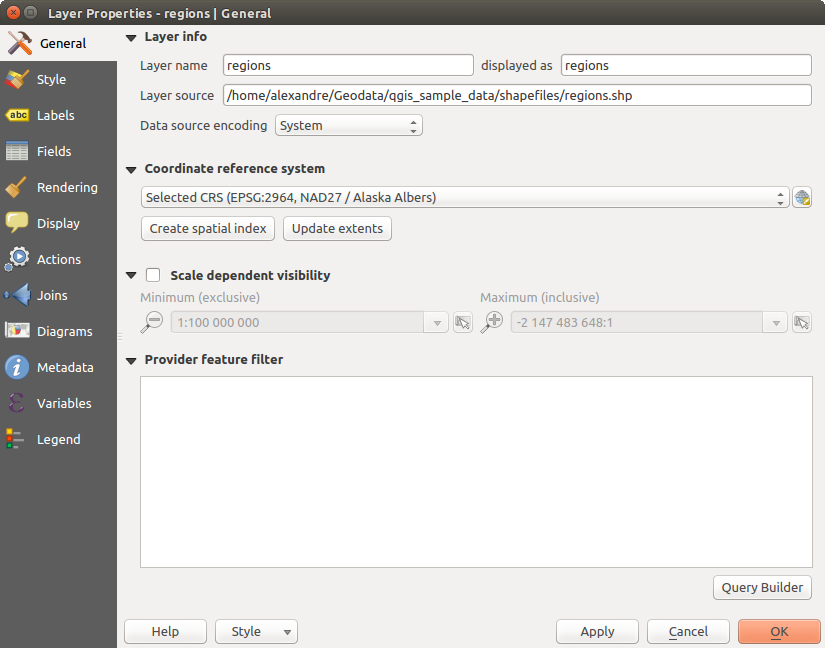
General tab in vector layers properties dialog
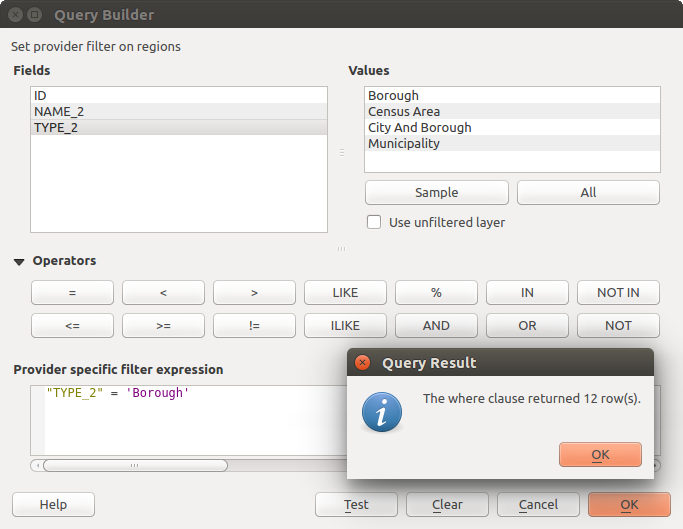
쿼리 작성기
Under the Provider Feature Filter frame, the Query Builder allows you to define a subset of the features in the layer using a SQL-like WHERE clause and to display the result in the main window. As long as the query is active, only the features corresponding to its result are available in the project. The query result can be saved as a new vector layer.
The Query Builder is accessible through the eponym term at the bottom of the General tab in the Layer Properties. Under Feature subset, click on the [Query Builder] button to open the Query builder. For example, if you have a regions layer with a TYPE_2 field, you could select only regions that are borough in the Provider specific filter expression box of the Query Builder. Figure_vector_querybuilder shows an example of the Query Builder populated with the regions.shp layer from the QGIS sample data. The Fields, Values and Operators sections help you to construct the SQL-like query.
쿼리 작성기
The Fields list contains all attribute columns of the attribute table to be searched. To add an attribute column to the SQL WHERE clause field, double click its name in the Fields list. Generally, you can use the various fields, values and operators to construct the query, or you can just type it into the SQL box.
The Values list lists the values of an attribute table. To list all possible values of an attribute, select the attribute in the Fields list and click the [all] button. To list the first 25 unique values of an attribute column, select the attribute column in the Fields list and click the [Sample] button. To add a value to the SQL WHERE clause field, double click its name in the Values list.
The Operators section contains all usable operators. To add an operator to the SQL WHERE clause field, click the appropriate button. Relational operators ( = , > , ...), string comparison operator (LIKE), and logical operators (AND, OR, ...) are available.
The [Test] button shows a message box with the number of features satisfying the current query, which is useful in the process of query construction. The [Clear] button clears the text in the SQL WHERE clause text field. The [OK] button closes the window and selects the features satisfying the query. The [Cancel] button closes the window without changing the current selection.
QGIS treats the resulting subset acts as if it were the entire layer. For example if you applied the filter above for ‘Borough’, you can not display, query, save or edit Anchorage, because that is a ‘Municipality’ and therefore not part of the subset.
The only exception is that unless your layer is part of a database, using a subset will prevent you from editing the layer.
Style Properties
 The Style tab provides you with a comprehensive tool for
rendering and symbolizing your vector data. You can use tools that are
common to all vector data, as well as special symbolizing tools that were
designed for the different kinds of vector data. However all types share the
following dialog structure: in the upper part, you have a widget that helps
you prepare the classification and the symbol to use for features and at
the bottom the 레이어 렌더링 widget.
The Style tab provides you with a comprehensive tool for
rendering and symbolizing your vector data. You can use tools that are
common to all vector data, as well as special symbolizing tools that were
designed for the different kinds of vector data. However all types share the
following dialog structure: in the upper part, you have a widget that helps
you prepare the classification and the symbol to use for features and at
the bottom the 레이어 렌더링 widget.
참고
벡터 심볼 내보내기
QGIS 벡터 심볼을 구글 *.kml, *.dxf 및 MapInfo *.tab 파일로 내보낼 수 있는 옵션이 존재합니다. 레이어를 오른쪽 클릭해서 컨텍스트 메뉴를 열어, Save As... 를 선택하고 산출물 파일명 및 유형을 지정하면 됩니다. 대화창에서는 Symbology export 메뉴의 Feature symbology ‣ 또는 Symbol layer symbology ‣ 메뉴 옵션을 통해 심볼을 저장하십시오. 심볼 레이어를 사용해본 경험이 있다면, 두 번째 방법을 이용하는 편이 좋습니다.
피처 렌더링
The renderer is responsible for drawing a feature together with the correct symbol. Regardless layer geometry type, there are four common types of renderers: single symbol, categorized, graduated and rule-based. For point layers, there are a point displacement and a heatmap renderers available while polygon layers can also be rendered with the inverted polygons and 2.5 D renderers.
연속 색상 렌더링 작업자라는 건 없습니다. 연속 색상 렌더링 작업자란 사실 등급 렌더링 작업자의 특수한 경우일 뿐이기 때문입니다. 심볼 및 색상표를 지정하면 심볼 색상을 적절하게 설정하는 범주 및 등급 렌더링 작업자를 생성할 수 있습니다. 각 데이터 유형(포인트, 라인 및 폴리곤) 별로, 해당 벡터 심볼 레이어 유형이 존재합니다. 어떤 렌더링 작업자를 선택하느냐에 따라, 대화창에 서로 다른 부분들이 추가될 것입니다.
주석
벡터 레이어의 스타일을 설정할 때 렌더링 작업자 유형을 변경해도, 심볼에 대한 사용자 설정은 유지될 것입니다. 다만 단 한 번 변경하는 경우에만 유지된다는 점을 기억해주십시오. 렌더링 작업자 유형을 계속 변경하다보면 심볼 설정이 사라지게 됩니다.
단일 심볼 렌더링 작업자
The  Single Symbol renderer is used to render
all features of the layer using a single user-defined symbol.
See 심볼 선택기 for further information about symbol representation.
Single Symbol renderer is used to render
all features of the layer using a single user-defined symbol.
See 심볼 선택기 for further information about symbol representation.
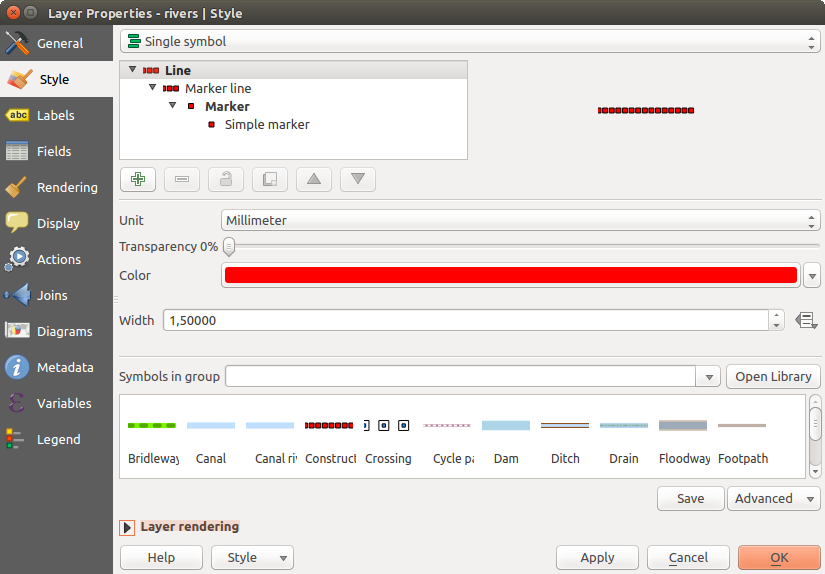
단일 심볼 라인 속성
참고
레이어 패널에서 직접 심볼 편집
If in your Layers Panel you have layers with categories defined through
categorized, graduated or rule-based style mode, you can quickly change the
fill color of the symbol of the categories by right-clicking on a category
and choose the color you prefer from a  color wheel menu.
Right-clicking on a category will also give you access to the options Hide
all items, Show all items and Edit symbol.
color wheel menu.
Right-clicking on a category will also give you access to the options Hide
all items, Show all items and Edit symbol.
무(無) 심볼 렌더링 작업자
 No Symbols 렌더링 작업자는 모든 피처를 동일하게 렌더링하는 단일 심볼 렌더링 작업자의 특수한 용례입니다. 이 렌더링 작업자를 이용하면, 피처에 적용된 어떤 심볼도 렌더링하지 않지만 라벨, 도표 및 기타 심볼이 아닌 부분들은 렌더링될 것입니다.
이 렌더링 작업자를 이용하더라도 맵 캔버스에서 레이어에 있는 피처를 선택할 수 있는데, 선택한 피처를 기본 심볼로 렌더링할 것입니다. 편집 중인 피처도 표시할 것입니다.
이 렌더링 작업자는 오직 라벨 또는 도표만 보이길 원하는 레이어를 표시하기 위한 간편한 편법입니다. 다른 방법을 쓴다면 완전히 투명한 면/경계선을 보유한 심볼을 이용해서 렌더링해야만 하겠지요.
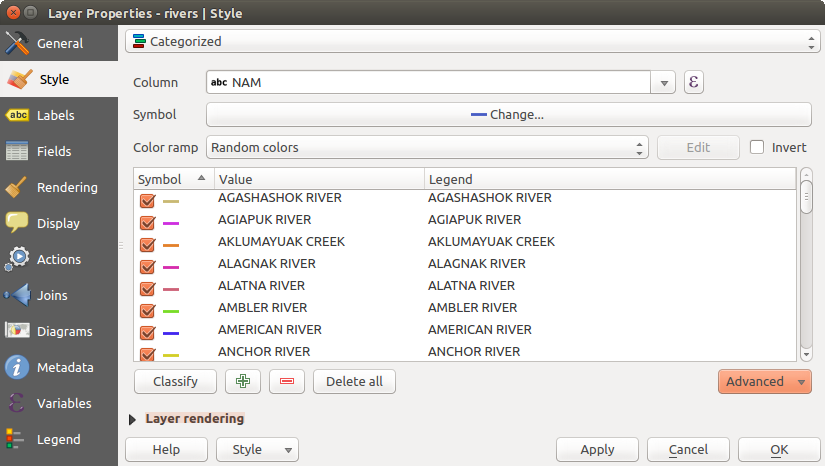
범주 렌더링 작업자
The  Categorized renderer is used to render the
features of a layer, using a user-defined symbol whose aspect reflects the
discrete values of a field or an expression. The Categorized menu allows you to
Categorized renderer is used to render the
features of a layer, using a user-defined symbol whose aspect reflects the
discrete values of a field or an expression. The Categorized menu allows you to
(열 목록 상자를 통해) 기존 필드를 선택할 수 있습니다.
 Set column expression 을 클릭해서 표현식 을 입력하거나 생성할 수 있습니다. 객체 분류 작업에 객체 유형에 상관없이 표현식을 이용할 수 있습니다. 예를 들면:
myfield >= 100, $id = @atlas_featureid, myfield % 2 = 0, within( $geometry, @atlas_geometry ) 와 같은 비교 표현식을 쓸 수 있습니다. 이 경우 QGIS가 1 (참) 및 0 (거짓)을 반환합니다.
서로 다른 필드를 결합할 수 있습니다. 예를 들어 2개 이상의 필드를 동시에 범주화하고 싶은 경우 concat( field1, ' ', field2 ) 같은 표현식이 특히 유용합니다.
필드를 대상으로 myfield % 2, year( myfield ) field_1 + field_2 처럼 계산할 수 있습니다.
개별 범주에 있는 선형(linear) 값을 다음과 같이 변형할 수 있습니다:
CASE WHEN x > 1000 THEN 'Big' ELSE 'Small' END
단일 범주에 있는 여러 개별 값들을 다음과 같이 결합할 수 있습니다:
CASE
WHEN building IN ('residence', 'mobile home') THEN 'residential'
WHEN building IN ('commercial', 'industrial') THEN 'Commercial and Industrial'
END
주석
객체를 범주화하는 데 모든 종류의 표현식을 사용할 수 있지만, 일부 복잡 표현식의 경우 Rule-based Renderer 를 사용하는 편이 더 간단할 수도 있습니다.
각 범주 별 기본값으로 쓰이게 될 심볼을 (심볼 선택기 대화창을 이용해서) 지정할 수 있습니다.
심볼에 적용되는 색상을 선택할 색상 범위를 (색상표 목록 상자를 이용해서) 설정할 수 있습니다.
Then click on [Classify] button to create classes from the distinct value of the attribute column. Each class can be disabled unchecking the checkbox at the left of the class name.
범주의 심볼, 값 그리고/또는 라벨을 변경하려면, 그냥 사용자가 원하는 항목을 더블 클릭하면 됩니다.
오른쪽 클릭하면 나오는 컨텍스트 메뉴에는 Copy/Paste, Change color, Change transparency, Change output unit, Change symbol width 등이 있습니다.
범주 심볼 작업 옵션들 그림은 QGIS 예시 데이터셋의 rivers 레이어에 대한 범주 렌더링 작업자 대화창의 예시입니다.
범주 심볼 작업 옵션들
참고
여러 심볼 선택 및 변경
여러 개의 심볼을 한꺼번에 선택한 다음 오른쪽 클릭하면 선택한 항목들의 색상, 투명도, 크기 또는 너비를 한번에 변경할 수 있습니다.
참고
심볼 명칭과 범주를 일치시키기
[Advanced] 버튼에서 classes 를 선택하면, 다음 두 가지 방법 가운데 하나를 통해 사용자 범주화에서 심볼 명칭과 범주 명칭을 일치시킬 수 있습니다. Matched to saved symbols 는 사용자의 스타일 관리자 에 있는 심볼 명칭에 범주 명칭을 일치시킵니다. Match to symbols from file 은 외부 파일에 있는 심볼 명칭에 범주 명칭을 일치시킵니다.
등급 렌더링 작업자
The  Graduated renderer is used to render
all the features from a layer, using an user-defined symbol whose color or size
reflects the assignment of a selected feature’s attribute to a class.
Graduated renderer is used to render
all the features from a layer, using an user-defined symbol whose color or size
reflects the assignment of a selected feature’s attribute to a class.
범주 렌더링 작업자처럼, 등급 렌더링 작업자는 지정한 열로부터 심볼의 기울기 및 크기 축척을 설정할 수 있습니다.
또한 범주 렌더링 작업자처럼, 다음 옵션들을 지정할 수 있습니다:
속성 (열 목록 상자 또는
Set column expression 기능을 이용합니다.)심볼 (심볼 선택기 대화창을 이용합니다.)
범례 양식 및 정밀도
심볼 변경 방법: 색상 또는 크기
색상 방법을 선택했을 경우 색상 (색상표 목록 상자를 이용합니다.)
크기 (크기 범위 및 해당 단위를 이용합니다.)
그 다음 할당된 필드 또는 표현식에서 나온 값의 대화형 히스토그램을 표시하는 히스토그램 탭을 이용할 수 있습니다. 히스토그램 위젯을 통해 범주 단계(class break)를 이동하거나 추가할 수 있습니다.
주석
통계 요약 패널을 통해 사용자 벡터 레이어에 관한 정보를 더 많이 얻을 수 있습니다. 통계 요약 패널 을 참조하세요.
범주 탭으로 돌아가면, 범주의 개수는 물론 각 범주에 있는 범주화 기능 모드도 (모드 목록을 이용해서) 설정할 수 있습니다. 다음 모드들을 선택할 수 있습니다:
- Equal Interval: each class has the same size (e.g. values from 0 to 16 and 4 classes, each class has a size of 4);
- Quantile: each class will have the same number of element inside (the idea of a boxplot);
- Natural Breaks (Jenks): the variance within each class is minimal while the variance between classes is maximal;
- Standard Deviation: classes are built depending on the standard deviation of the values;
Pretty Breaks: x 값의 범위를 커버하면서 동일한 간격으로 보기 좋게 분포된 n+1 개의 일련의 값들을 계산합니다. 10의 거듭제곱을 1, 2 또는 5로 곱한 수를 값으로 선택합니다. (R 통계 환경의 pretty 에 기반한 모드입니다.)
The listbox in the center part of the Style tab lists the classes together with their ranges, labels and symbols that will be rendered.
[Classify] 버튼을 클릭해서 선택한 모드를 통해 범주를 생성하십시오. 범주명 왼쪽에 있는 체크박스를 해제하면 각 범주를 비활성화시킬 수 있습니다.
범주의 심볼, 값 그리고/또는 라벨을 변경하려면, 그냥 사용자가 원하는 항목을 더블 클릭하면 됩니다.
오른쪽 클릭하면 나오는 컨텍스트 메뉴에는 Copy/Paste, Change color, Change transparency, Change output unit, Change symbol width 등이 있습니다.
등급 심볼 작업 옵션들 그림은 QGIS 예시 데이터셋의 rivers 레이어에 대한 등급 렌더링 작업자 대화창의 예시입니다.
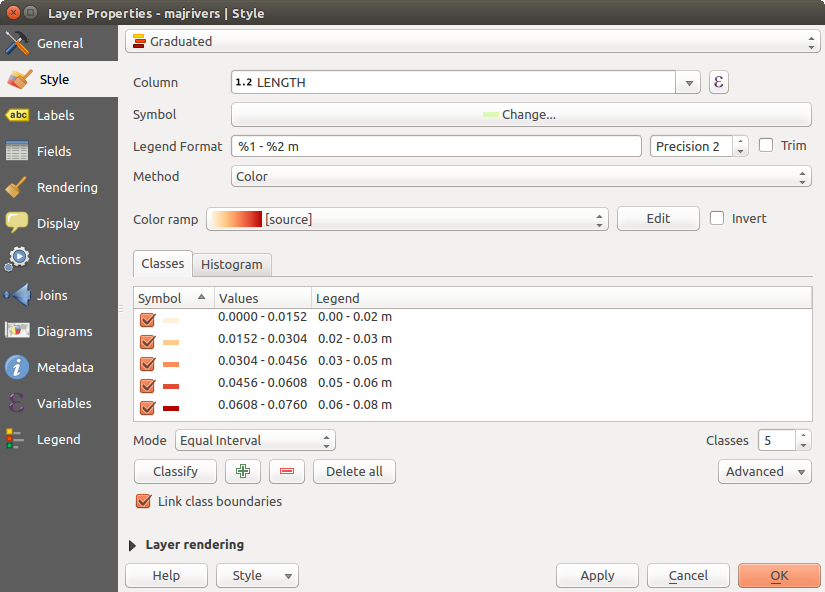
등급 심볼 작업 옵션들
참고
표현식을 이용한 테마 지도
표현식의 결과를 이용해서 범주 및 등급 테마 맵을 생성할 수 있습니다. 벡터 레이어의 속성 대화창에서, Set column expression 기능을 통해 속성 선택기를 확장합니다. 즉 범주화 속성을 여러 필드의 합성으로 또는 일종의 틀로 만들고자 할 경우, 사용자 속성 테이블에 새 열을 만들어 범주화 속성을 입력할 필요가 없다는 뜻입니다.
비례 심볼 및 다변량 분석
Proportional Symbol and Multivariate Analysis are not rendering types available from the Style rendering drop-down list. However with the Size Assistant options applied over any of the previous rendering options, QGIS allows you to display your point and line data with such representation.
비례 심볼 생성하기
Proportional rendering is done by first applying to the layer the 단일 심볼 렌더링 작업자.
Once you set the symbol, at the upper level of the symbol tree, the
 Data-defined override button available beside
Size or Width options (for point or line layers
respectively) provides tool to create proportional symbology for the layer.
An assistant is moreover accessible through the menu
to help you define size expression.
Data-defined override button available beside
Size or Width options (for point or line layers
respectively) provides tool to create proportional symbology for the layer.
An assistant is moreover accessible through the menu
to help you define size expression.
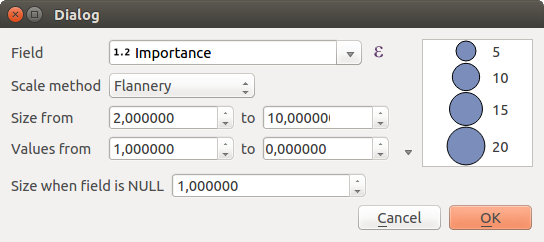
Varying size assistant
The assistant lets you define:
- The attribute to represent, using the Field listbox or the
Set column expression function (see 표현식)
- the scale method of representation which can be ‘Flannery’, ‘Surface’ or ‘Radius’
- The minimum and maximum size of the symbol
- The range of values to represent: The down pointing arrow helps you fill automatically these fields with the minimum (or zero) and maximum values returned by the chosen attribute or the expression applied to your data.
- An unique size to represent NULL values.
To the right side of the dialog, you can preview the features representation within a live-update widget. This representation is added to the layer tree in the layer legend and is also used to shape the layer representation in the print composer legend item.
The values presented in the varying size assistant above will set the size ‘Data-defined override’ with:
coalesce(scale_exp(Importance, 1, 20, 2, 10, 0.57), 1)
다변량 분석 생성하기
다변량 분석 렌더링은 두 개 이상의 변수들 사이의 관계를 평가할 수 있습니다. 예를 들면 변수 하나를 크기로 표현하고, 다른 변수를 색상표로 표현할 수 있습니다.
The simplest way to create multivariate analysis in QGIS is to first apply a categorized or graduated rendering on a layer, using the same type of symbol for all the classes. Then, clicking on the symbol [Change] button above the classification frame, you get the 심볼 선택기 dialog from which, as seen above, you can activate and set the size assistant option either on size (for point layer) or width (for line layer).
Like the proportional symbol, the size-related symbol is added to the layer tree, at the top of the categorized or graduated classes symbols. And both representation are also available in the print composer legend item.
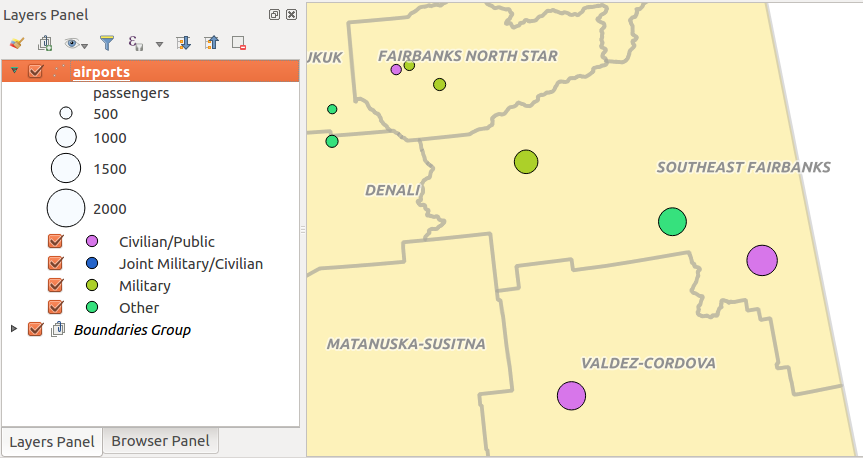
Multivariate example
Rule-based Renderer
The  Rule-based renderer is used to render
all the features from a layer,
using rule-based symbols whose aspect reflects the assignment of a selected
feature’s attribute to a class. The rules are based on SQL statements.
The dialog allows rule grouping by filter or scale, and you can decide
if you want to enable symbol levels or use only the first-matched rule.
Rule-based renderer is used to render
all the features from a layer,
using rule-based symbols whose aspect reflects the assignment of a selected
feature’s attribute to a class. The rules are based on SQL statements.
The dialog allows rule grouping by filter or scale, and you can decide
if you want to enable symbol levels or use only the first-matched rule.
To create a rule, activate an existing row by double-clicking on it, or
click on ‘+’ and click on the new rule. In the Rule properties dialog,
you can define a label for the rule. Press the  button to open the
expression string builder.
In the Function List, click on Fields and Values to view all
attributes of the attribute table to be searched.
To add an attribute to the field calculator Expression field,
double click on its name in the Fields and Values list. Generally, you
can use the various fields, values and functions to construct the calculation
expression, or you can just type it into the box (see 표현식).
You can create a new rule by copying and pasting an existing rule with the right
mouse button. You can also use the ‘ELSE’ rule that will be run if none of the other
rules on that level matches.
Since QGIS 2.8 the rules appear in a tree hierarchy in the map legend. Just
double-click the rules in the map legend and the Style tab of the layer
properties appears showing the rule that is the background for the symbol in
the tree.
button to open the
expression string builder.
In the Function List, click on Fields and Values to view all
attributes of the attribute table to be searched.
To add an attribute to the field calculator Expression field,
double click on its name in the Fields and Values list. Generally, you
can use the various fields, values and functions to construct the calculation
expression, or you can just type it into the box (see 표현식).
You can create a new rule by copying and pasting an existing rule with the right
mouse button. You can also use the ‘ELSE’ rule that will be run if none of the other
rules on that level matches.
Since QGIS 2.8 the rules appear in a tree hierarchy in the map legend. Just
double-click the rules in the map legend and the Style tab of the layer
properties appears showing the rule that is the background for the symbol in
the tree.
규칙 기반 심볼 작업 옵션들 그림은 QGIS 예시 데이터셋의 rivers 레이어에 대한 규칙 기반 렌더링 작업자 대화창의 예시입니다.
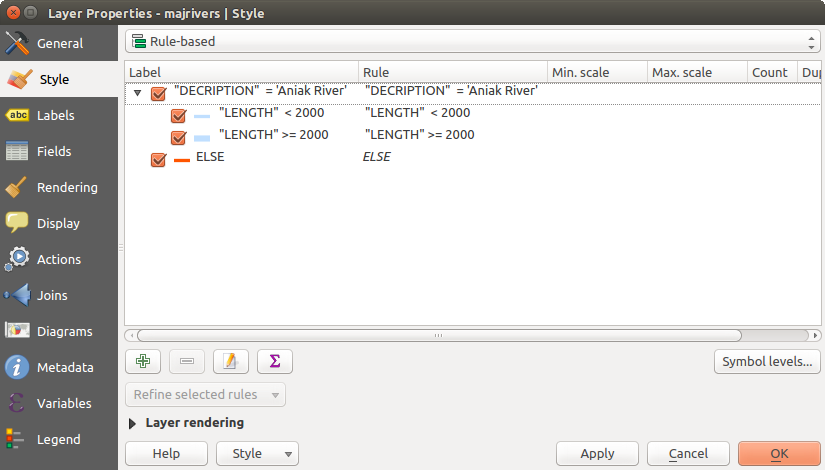
규칙 기반 심볼 작업 옵션들
Point displacement Renderer
The  Point Displacement renderer
works to visualize all features of a point layer, even if they have the same location.
To do this, the symbols of the points are placed on a displacement circle
around one center symbol or on several concentric circles.
Point Displacement renderer
works to visualize all features of a point layer, even if they have the same location.
To do this, the symbols of the points are placed on a displacement circle
around one center symbol or on several concentric circles.
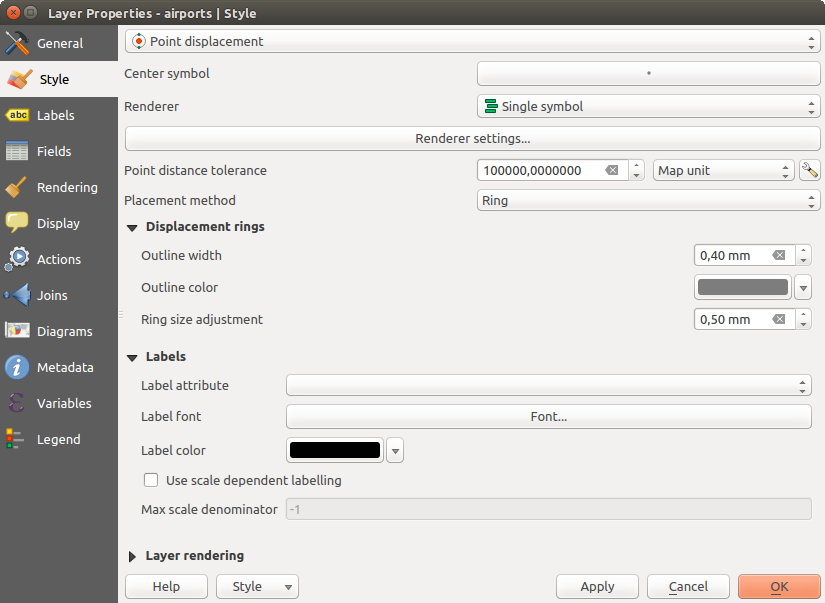
포인트 변위 대화창
주석
You can still render features with other renderer like Single symbol, Graduated, Categorized or Rule-Based renderer using the Renderer drop-down list then the Renderer Settings... button.
Inverted Polygon Renderer
 Inverted Polygon 렌더링 작업자는 레이어에 있는 폴리곤의 바깥을 채울 심볼을 지정할 수 있습니다. 앞에서와 마찬가지로 단일 심볼, 등급, 범주, 규칙 기반 또는 2.5D 같은 하위 렌더링 작업자를 선택할 수 있습니다.
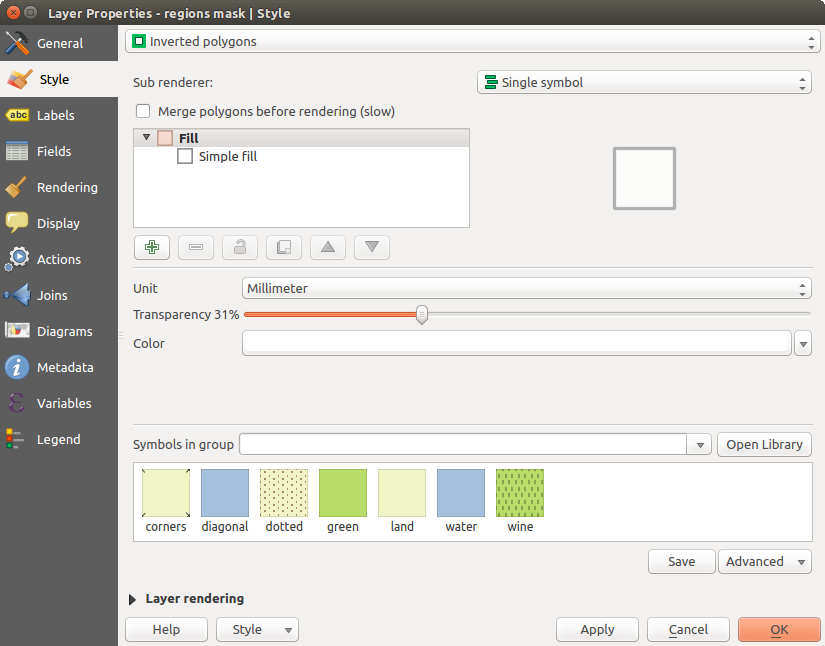
반전 폴리곤 대화창
Heatmap Renderer
With the  Heatmap renderer you can create live
dynamic heatmaps for (multi)point layers.
You can specify the heatmap radius in pixels, mm or map units, choose and
edit a color ramp for the heatmap style and use a slider for selecting a trade-off
between render speed and quality. You can also define a maximum value limit and give a
weight to points using a field or an expression. When adding or removing a feature
the heatmap renderer updates the heatmap style automatically.
Heatmap renderer you can create live
dynamic heatmaps for (multi)point layers.
You can specify the heatmap radius in pixels, mm or map units, choose and
edit a color ramp for the heatmap style and use a slider for selecting a trade-off
between render speed and quality. You can also define a maximum value limit and give a
weight to points using a field or an expression. When adding or removing a feature
the heatmap renderer updates the heatmap style automatically.
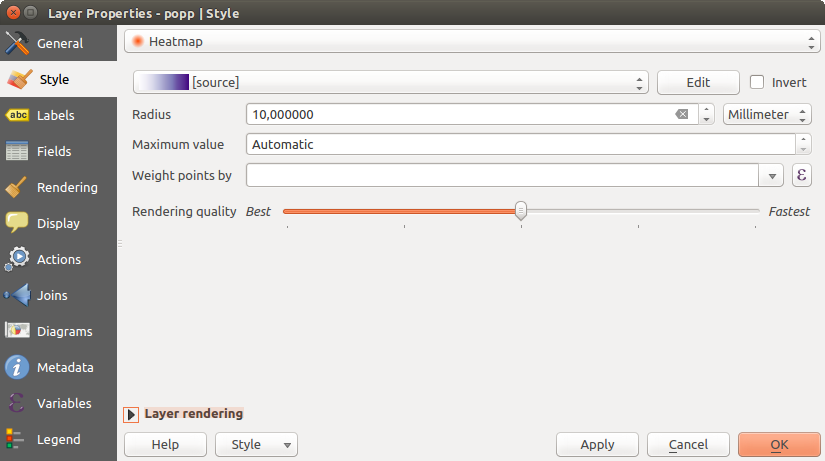
열지도 대화창
2.5D Renderer
 2.5D 렌더링 작업자를 이용해서 사용자 레이어의 피처에 2.5D 효과를 줄 수 있습니다. 먼저 Height 값(맵 단위)을 설정하십시오. 고정값, 사용자 레이어의 필드 가운데 하나, 또는 표현식으로 설정할 수 있습니다. 또 시각의 방향을 (0° 는 서쪽으로, 값이 올라갈수록 반시계 방향으로 돕니다) 재현하려면 Angle (도 단위)을 설정해야 합니다. Roof Color 및 Wall Color 을 설정하려면 고급 환경 설정 옵션을 사용하십시오. 만약 피처의 벽에 태양광 효과를 주고 싶다면,
  Shade walls based on aspect 옵션을 체크하도록 하십시오. Color 및 Size 값(맵 단위)을 설정하면 그림자 효과를 줄 수도 있습니다.
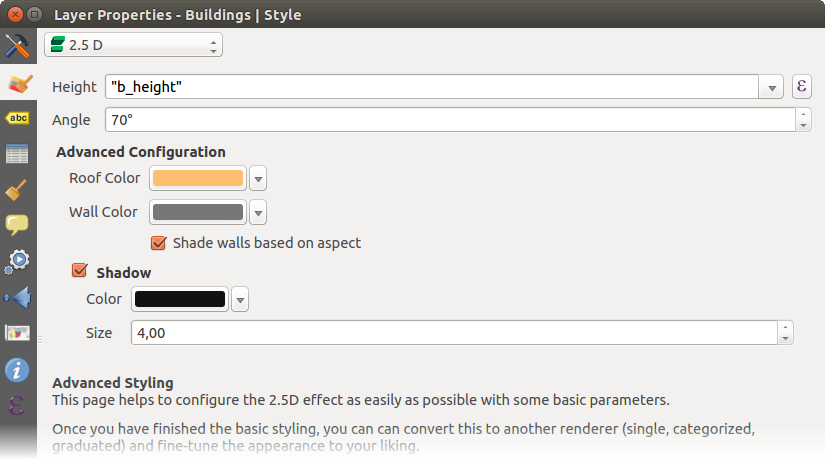
2.5D 대화창
참고
다른 렌더링 작업자에서 2.5D 효과 이용하기
2.5D 렌더링 작업자에서 기본 스타일 설정을 마치고 나면, 다른 (단일 심볼, 범주, 등급) 렌더링 작업자로 변환시킬 수 있습니다. 2.5D 효과가 지속되는 동시에 다른 렌더링 작업자의 모든 특정 옵션도 쓸 수 있어 2.5D 효과를 정밀하게 조정할 수 있습니다. (예를 들어 멋진 2.5D 표현으로 범주 심볼을 그리거나 2.5D 심볼에 몇몇 기타 스타일을 추가할 수도 있습니다.) 그림자 및 “건물” 자체가 주변의 다른 피처를 가리지 않도록 하려면, 심볼 수준(Advanced ‣ Symbol levels...)을 활성화해야 할 수도 있습니다. 2.5D 높이 및 각도 값은 레이어의 변수에 저장되기 때문에, 이후 레이어 속성 대화창의 변수 탭에서 편집할 수 있습니다.
레이어 렌더링
From the Style tab, you can also set some options that invariabily act on all features of the layer:
Layer transparency
 : You can make the underlying layer in
the map canvas visible with this tool. Use the slider to adapt the visibility
of your vector layer to your needs. You can also make a precise definition of
the percentage of visibility in the the menu beside the slider.
: You can make the underlying layer in
the map canvas visible with this tool. Use the slider to adapt the visibility
of your vector layer to your needs. You can also make a precise definition of
the percentage of visibility in the the menu beside the slider.Layer blending mode and Feature blending mode: You can achieve special rendering effects with these tools that you may previously only know from graphics programs. The pixels of your overlaying and underlaying layers are mixed through the settings described in 혼합 모드.
Draw Effects 버튼: 레이어의 모든 피처에 대해 그리기 효과 를 줍니다.
Control feature rendering order: 피처 속성을 이용해서 피처를 어떤 순서로 렌더링해야 하는지에 대한 Z 순서를 정의할 수 있습니다. 체크박스를 체크한 다음 옆에 있는
 버튼을 클릭하십시오. Define Order 대화창이 열리는데, 다음 작업들을 할 수 있습니다:
- choose a field or build an expression to apply to the layer features
- set in which order the fetched features should be sorted, i.e. if you choose Ascending order, the features with lower value are rendered under those with upper value.
- define when features returning NULL value should be rendered: first or last.
You can add several rules of ordering. The first rule is applied to all the features in the layer, z-ordering them according to the value returned. Then, for each group of features with the same value (including those with NULL value) and thus same z-level, the next rule is applied to sort its items among them. And so on...
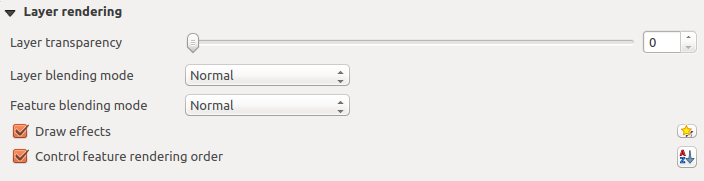
레이어 렌더링 옵션들
기타 설정
Symbols levels
적층(積層) 심볼 레이어를 지원하는 (열지도 제외) 렌더링 작업자의 경우 각 심볼 수준의 렌더링 순서를 조정하는 옵션이 존재합니다.
For most of the renderers, you can access the Symbols levels option by clicking the [Advanced] button below the saved symbols list and choosing Symbol levels. For the Rule-based Renderer the option is directly available through [Symbols levels] button, while for Point displacement Renderer renderer the same button is inside the Rendering settings dialog.
심볼 수준을 활성화하려면, Enable symbol levels 를 체크하십시오. 복합 심볼, 라벨, 그리고 열로 나누어진 개별 심볼 레이어의 작은 표본이 번호와 함께 각 행에 표시됩니다. 이 번호들은 심볼 레이어를 그릴 렌더링 순서 수준을 나타냅니다. 번호 숫자가 낮을수록 먼저 그려져 아래에 남고, 높을수록 나중에 그려져 다른 레이어 위에 있게 됩니다.
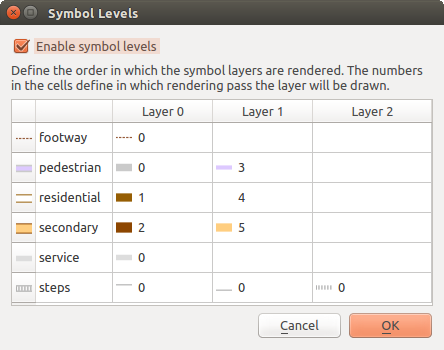
심볼 수준 대화창
주석
심볼 수준을 비활성화하면, 심볼 각각의 피처 순서에 따라 완전한 심볼을 그립니다. 위에 있는 심볼은 아래 있는 심볼을 혼란스럽게 만들 뿐입니다. 게다가, 비슷한 심볼들이 서로 “합쳐”지지 않을 것입니다.
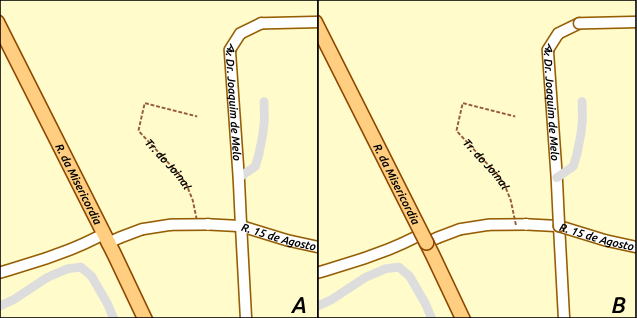
심볼 수준 (A) 활성화 (B) 비활성화 비교
그리기 효과
레이어 렌더링을 향상시키고 최종 맵을 다른 소프트웨어로 렌더링하는 일을 피하기 (또는 적어도 줄이기) 위해, QGIS는 또다른 강력한 기능을 제공합니다:  Draw Effects 옵션은 사용자가 벡터 레이어의 가시화를 직접 조정할 수 있도록 그리기 효과를 추가합니다.
The option is available in the Layer Properties –> Style dialog, under the Layer rendering group (applying to the whole layer) or in symbol layer properties (applying to corresponding features). You can combine both usage.
Paint effects can be activated by checking the Draw effects option
and clicking the Customize effects button, that will open
the Effect Properties Dialog (see figure_effects_source). The following
effect types, with custom options are available:
Source: Draws the feature’s original style according to the configuration of the layer’s properties. The transparency of its style can be adjusted.
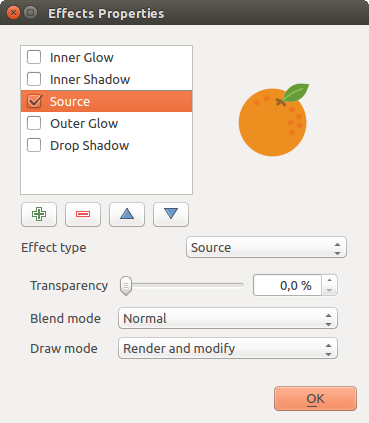
그리기 효과: 소스 대화창
Blur: Adds a blur effect on the vector layer. The options that someone can change are the Blur type (Stack or Gaussian blur), the strength and transparency of the blur effect.
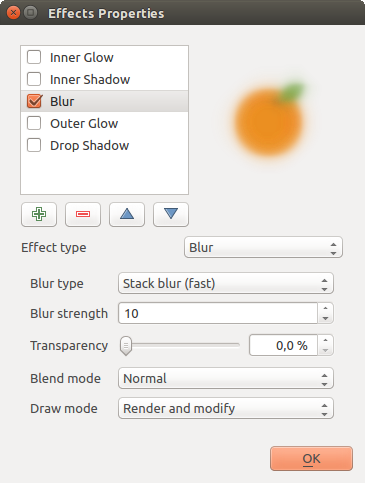
그리기 효과: 블러 대화창
Colorize: This effect can be used to make a version of the style using one single hue. The base will always be a grayscale version of the symbol and you can use the
 Grayscale to select how to create it
(options are: ‘lightness’, ‘luminosity’ and ‘average’). If
Colorise is selected, it will be possible to mix another color
and choose how strong it should be. You can also control the
Brightness, contrast and
saturation levels of the resulting symbol.
Grayscale to select how to create it
(options are: ‘lightness’, ‘luminosity’ and ‘average’). If
Colorise is selected, it will be possible to mix another color
and choose how strong it should be. You can also control the
Brightness, contrast and
saturation levels of the resulting symbol.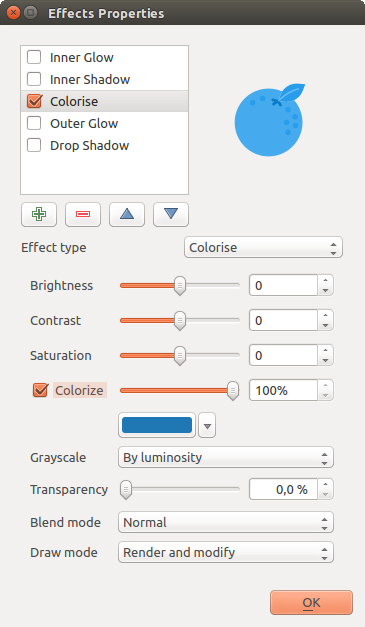
그리기 효과: 색상화 대화창
Drop Shadow: Using this effect adds a shadow on the feature, which looks like adding an extra dimension. This effect can be customized by changing the offset degrees and radius, determining where the shadow shifts towards to and the proximity to the source object. Drop Shadow also has the option to change the blur radius, the transparency and the color of the effect.
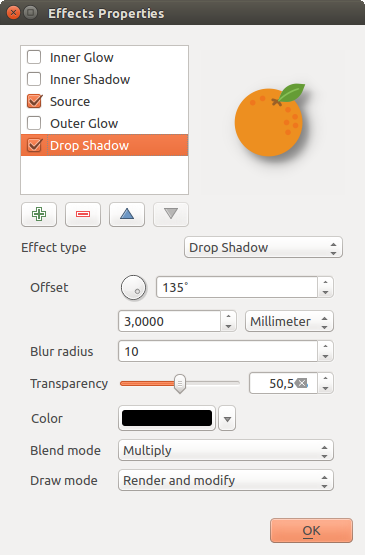
그리기 효과: 그림자 효과 대화창
Inner Shadow: This effect is similar to the Drop Shadow effect, but it adds the shadow effect on the inside of the edges of the feature. The available options for customization are the same as the Drop Shadow effect.
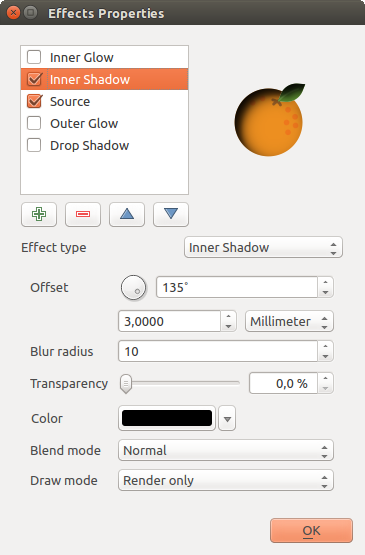
그리기 효과: 내부 그림자 대화창
Inner Glow: Adds a glow effect inside the feature. This effect can be customized by adjusting the spread (width) of the glow, or the Blur radius. The latter specifies the proximity from the edge of the feature where you want any blurring to happen. Additionally, there are options to customize the color of the glow, with a single color or a color ramp.
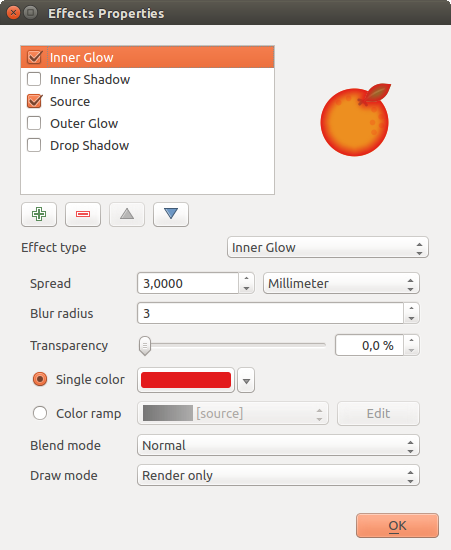
그리기 효과: 내부 광원 대화창
Outer Glow: This effect is similar to the Inner Glow effect, but it adds the glow effect on the outside of the edges of the feature. The available options for customization are the same as the Inner Glow effect.
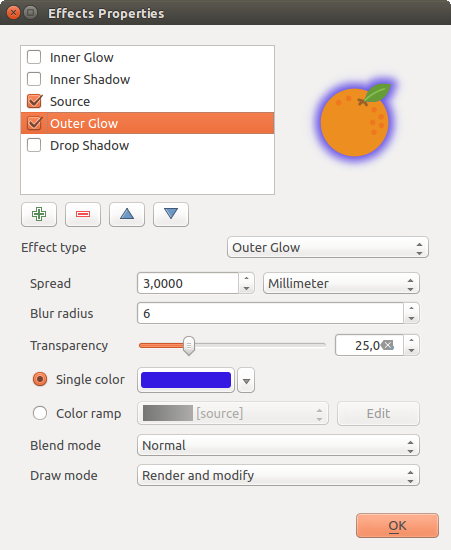
그리기 효과: 외부 광원 대화창
Transform: Adds the possibility of transforming the shape of the symbol. The first options available for customization are the Reflect horizontal and Reflect vertical, which actually create a reflection on the horizontal and/or vertical axes. The 4 other options are:
- Shear: slants the feature along the x and/or y axis
- Scale: enlarges or minimizes the feature along the x and/or y axis by the given percentage
- Rotation: turns the feature around its center point
- and Translate changes the position of the item based on a distance given on the x and/or the y axis.
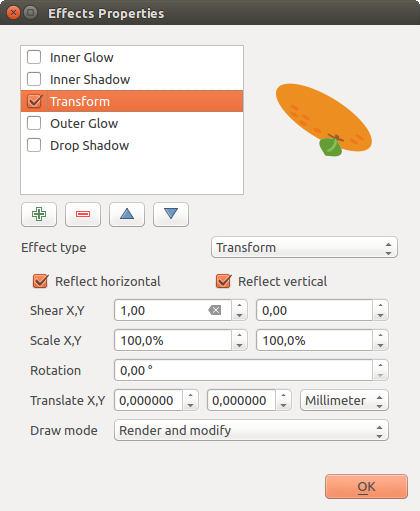
그리기 효과: 변형 대화창
There are some common options available for all draw effect types. Transparency and Blend mode options work similar to the ones described in 레이어 렌더링 and can be used in all draw effects except for the transform one.
One or more draw effects can used at the same time. You activate/deactivate an effect
using its checkbox in the effects list. You can change the selected effect type by
using the Effect type option. You can reorder the effects
using  Move up and
  Move down
buttons, and also add/remove effects using the
Move down
buttons, and also add/remove effects using the  Add effect
and
Add effect
and  Remove effect buttons.
There is also a Draw mode option available for
every draw effect, and you can choose whether to render and/or to modify the
symbol. Effects render from top to bottom.’Render only’ mode means that the
effect will be visible while the ‘Modify only’ mode means that the effect will
not be visible but the changes that it applies will be passed to the next effect
(the one immediately below). The ‘Render and Modify’ mode will make the
effect visible and pass any changes to the next effect. If the effect is in the
top of the effects list or if the immediately above effect is not in modify
mode, then it will use the original source symbol from the layers properties
(similar to source).
라벨 속성
 Labels 속성 대화창은 벡터 레이어에 대해 스마트 라벨 작업 환경을 설정하기 위해 필요한 그리고 적절한 모든 기능을 제공합니다. Layer Styling 패널에서 또는 라벨 툴바 의 Layer Labeling Options 아이콘을 통해 이 대화창에 접근할 수 있습니다.
라벨 설정하기
The first step is to choose the labeling method from the drop-down list. There are four options available:
- No labels
- Show labels for this layer
- Rule-based labeling
- and Blocking: allows to set a layer as just an obstacle for other layer’s labels without rendering any labels of its own.
The next steps assume you select the Show labels for this layer option, enabling following tabs that help you configure the labeling:
It also enables the Label with drop-down list, from which you can select an
attribute column to use. Click if you want to define
labels based on expressions - See 표현식을 기반으로 라벨 정의하기.
다음 목들은 드롭다운 메뉴 옆에 있는 Data defined override 기능을 사용하지 않는 단순 라벨 작업을 설명하고 있습니다. 해당 기능의 용례를 살펴보려면 라벨 작업에 데이터 정의 무시 이용하기 를 참조하세요.
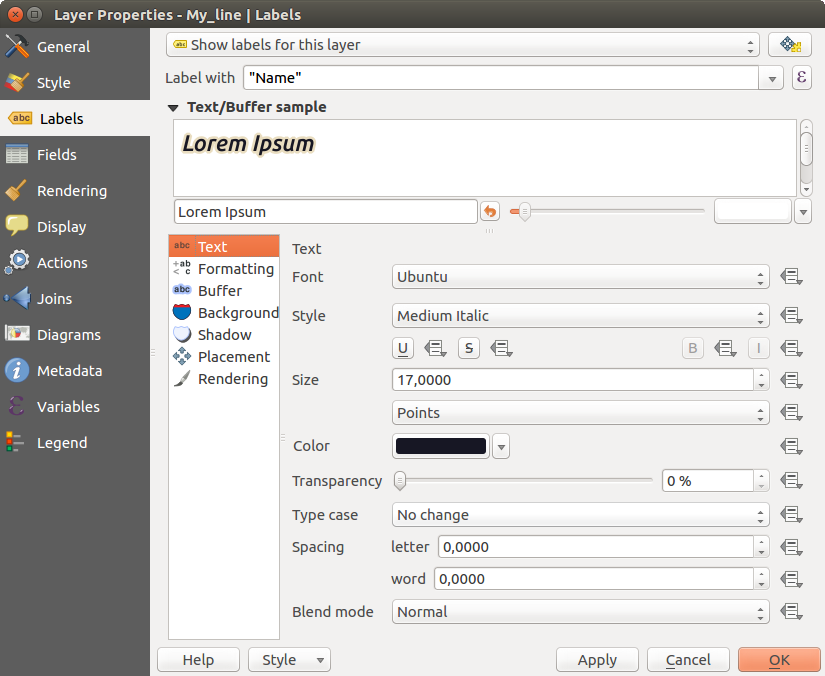
텍스트 탭의 레이어 라벨 작업 설정
텍스트 탭
In the Text tab, you can define the Font, Style, and Size of your labels’ text (see Figure_labels). There are options available to set the labels’ Color and Transparency. Use the Type case option to change the capitalization style of the text. You have the possibility to render the text as ‘All uppercase’, ‘All lowercase’ or ‘Capitalize first letter’. In Spacing, you can change the space between words and between individual letters. Finally, use the Blend mode option to determine how your labels will mix with the map features below them (see more about it in 혼합 모드).
Apply label text substitutes 옵션은 객체 라벨 내부의 텍스트를 대신할 텍스트 목록을 (예: 도로 유형 축약명) 설정할 수 있습니다. 이렇게 하면 맵 캔버스에 있는 라벨을 대체 텍스트로 표시합니다. 재사용 및 공유를 더 쉽게 하기 위해 대체 텍스트 목록을 내보내고 가져올 수 있습니다.
서식 탭
In the Formatting tab, you can define a character for a line break in the labels with the Wrap on character option. You can also format the Line Height and the alignment. For the latter, typical values are available (left, right, and center), plus Follow label placement for point layers. When set to this mode, text alignment for labels will be dependent on the final placement of the label relative to the point. E.g., if the label is placed to the left of the point, then the label will be right aligned, while if it is placed to the right, it will be left aligned.
라인 벡터 레이어는 라인의 방향을 결정할 수 있는 Line directions symbols 를 포함할 수 있습니다. 이 심볼을 Placement 탭에서 Curved 또는 Parallel 위치 옵션과 함께 사용하면 더 좋습니다. 심볼 위치를 설정할 수 있는 옵션과 함께 방향을 역전시킬 수 있는 Reverse direction 옵션도 존재합니다.
숫자 라벨 서식을 설정하려면 Formatted numbers 옵션을 활성화시키십시오. Decimal places 를 통해 소수점 숫자 개수를 설정할 수 있습니다. 기본값은 소수점 이하 세 자리입니다. Show plus sign 을 활성화하면 양수 앞에 플러스 표시를 추가할 수 있습니다.
테두리 탭
To create a buffer around the labels, activate the
Draw text buffer checkbox in the Buffer tab. You can
set the buffer’s Size, color, and
Transparency. The buffer expands from the label’s outline
, so, if the color buffer’s fill checkbox is
activated, the buffer interior is filled. This may be relevant when
using partially transparent labels or with non-normal blending
modes, which will allow seeing behind the label’s text. Deactivating
color buffer’s fill checkbox (while using totally
transparent labels) will allow you to create outlined text labels.
배경 탭
In the Background tab, you can define with Size X and Size Y the shape of your background. Use Size type to insert an additional ‘Buffer’ into your background. The buffer size is set by default here. The background then consists of the buffer plus the background in Size X and Size Y. You can set a Rotation where you can choose between ‘Sync with label’, ‘Offset of label’ and ‘Fixed’. Using ‘Offset of label’ and ‘Fixed’, you can rotate the background. Define an Offset X,Y with X and Y values, and the background will be shifted. When applying Radius X,Y, the background gets rounded corners. Again, it is possible to mix the background with the underlying layers in the map canvas using the Blend mode (see 혼합 모드).
그림자 탭
Use the Shadow tab for a user-defined Drop shadow.
The drawing of the background is very variable.
Choose between ‘Lowest label component’, ‘Text’, ‘Buffer’ and ‘Background’.
The Offset angle depends on the orientation
of the label. If you choose the Use global shadow checkbox,
then the zero point of the angle is
always oriented to the north and doesn’t depend on the orientation of the label.
You can influence the appearance of the shadow with the Blur radius.
The higher the number, the softer the shadows. The appearance of the drop shadow
can also be altered by choosing a blend mode.
배치 탭
Choose the Placement tab for configuring label placement and labeling priority. Note that the placement options differ according to the type of vector layer, namely point, line or polygon.
포인트 레이어에서의 배치
 Cartographic 배치 모드를 선택하면, 이상적인 지도 제작법 배치 규칙에 따라 포인트 피처와 시각적으로 더 잘 어울리는 위치에 포인트 라벨을 생성합니다. Distance 를 설정하면 포인트 피처 자체로부터 또는 피처를 표현하는 데 쓰인 심볼의 경계로부터 설정한 거리에 라벨을 배치할 수 있습니다. 심볼 크기가 고정되지 않은 경우, 예를 들어 데이터 정의 크기로 설정됐거나 또는 범주 렌더링 작업자에서 서로 다른 심볼을 사용하는 경우 심볼 경계를 기준으로 하는 옵션이 매우 유용합니다.
기본적으로, 라벨 위치는 다음 순서대로 배치됩니다:
우상단
좌상단
우하단
좌하단
우중단
좌중단
약간 우측으로 쏠린 상단
약간 좌측으로 쏠린 하단
하지만 배치 우선 순위를 사용자 지정하거나, 우선되는 위치의 데이터 정의 목록을 통해 개별 피처 별로 위치를 설정할 수 있습니다. 이런 방법으로 특정 위치만 이용하도록 할 수도 있는데, 예를 들면 해안 피처의 경우 라벨이 육지 위로 올라오지 않도록 예방할 수 있습니다.
Around point 설정을 통해 라벨을 피처 주위의 동일 반경(Distance 에서 설정) 원 안에 배치할 수 있습니다. Quadrant 옵션을 이용하면 라벨의 배치를 더 제약할 수도 있습니다.
Offset from point 배치 옵션을 선택하면, 포인트 피처로부터 고정된 거리에 라벨을 배치합니다. Quadrant 를 통해 사용자 라벨을 배치시킬 사분원을 선택할 수 있습니다. 또 Offset X,Y 를 통해 포인트와 포인트의 라벨 사이의 거리를 설정할 수 있고, Rotation 설정으로 라벨의 배치 각도를 수정할 수도 있습니다. 즉 사용자가 선택한 사분원에 사용자가 지정한 기울기로 라벨을 배치할 수 있습니다.
라인 레이어에서의 배치
라인 레이어 용 라벨 옵션은 Parallel,  Curved 또는 Horizontal 가운데 하나를 선택할 수 있습니다. Parallel 및 Curved 옵션의 경우, Above line, On line 그리고 Below line 가운데 하나를 체크해서 라벨 위치를 설정할 수 있습니다. 여러 옵션을 동시에 선택할 수도 있습니다. 이런 경우, QGIS가 최적의 라벨 위치를 찾을 것입니다. 또 라벨 위치를 설정하는 데 라인의 방향을 이용할 수도 있습니다. 게다가, Curved 옵션을 선택한 경우 Maximum angle between curved characters 를 통해 각 문자 사이의 최대 각도를 정의할 수 있습니다. (라인 피처의 라벨 배치 예시 그림을 참조하세요.)
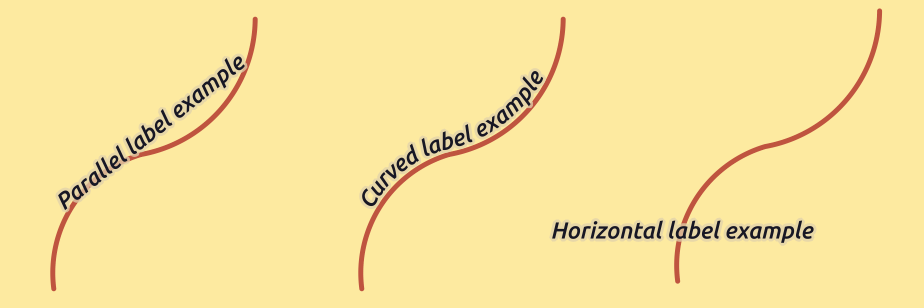
라인 피처의 라벨 배치 예시
세 가지 배치 옵션 모두, Repeat 에서 반복 표시되는 라벨이 최소한 어느 정도의 거리를 두고 반복돼야 하는지를 mm 또는 map units 단위로 설정할 수 있습니다.
폴리곤 레이어에서의 배치
폴리곤의 라벨을 배치하는 데 다음 옵션 가운데 하나를 선택할 수 있습니다(폴리곤 피처의 라벨 배치 예시 그림 참조):
- Offset from centroid
- Horizontal (slow)
- Around centroid
- Free (slow)
- Using perimeter
- Using perimeter (curved)
Offset from centroid 설정에서 중심이 Visible polygon 의 중심인지 또는 Whole polygon 의 중심인지 지정할 수 있습니다. 즉 맵 상에 보이는 폴리곤의 중심 또는 맵 상에서 전체 피처를 볼 수 있느냐에 상관없이 전체 폴리곤의 중심 둘 중의 하나를 이용한다는 뜻입니다. 특정 사분원에 라벨을 배치할 수 있고, 오프셋 및 기울기를 정의할 수 있습니다.
Around centroid 설정은 중심 주변으로 설정한 거리에 라벨을 배치합니다. 역시, 중심을 Visible polygon 또는 Whole polygon 으로 정의할 수 있습니다.
Horizontal (slow) 또는 Free (slow) 옵션을 사용하면, QGIS가 폴리곤 내부의 최적 위치에 수평 또는 기울인 라벨을 배치합니다.
Using perimeter 옵션을 사용하면, 폴리곤 경계선 옆에 라벨을 그립니다. 이 라벨은 라인 용 평행 옵션처럼 동작할 것입니다. 라벨의 위치 및 거리를 정의할 수 있습니다. 위치의 경우, Above line, On line, Below line 및 Line orientation dependent position 가운데 하나를 선택할 수 있습니다. 라벨과 폴리곤 경계선 사이의 거리는 물론, 반복되는 라벨의 반복 간격도 설정할 수 있습니다.
Using perimeter (curved) 옵션은 폴리곤 경계선을 따라 만곡 라벨을 그릴 수 있습니다. Using perimeter 설정에서 이용할 수 있는 모든 파라미터는 물론, 라벨을 폴리곤 내부에 그릴지 또는 외부에 그릴지, 그리고 Maximum angle between curved characters polygon 도 설정할 수 있습니다.
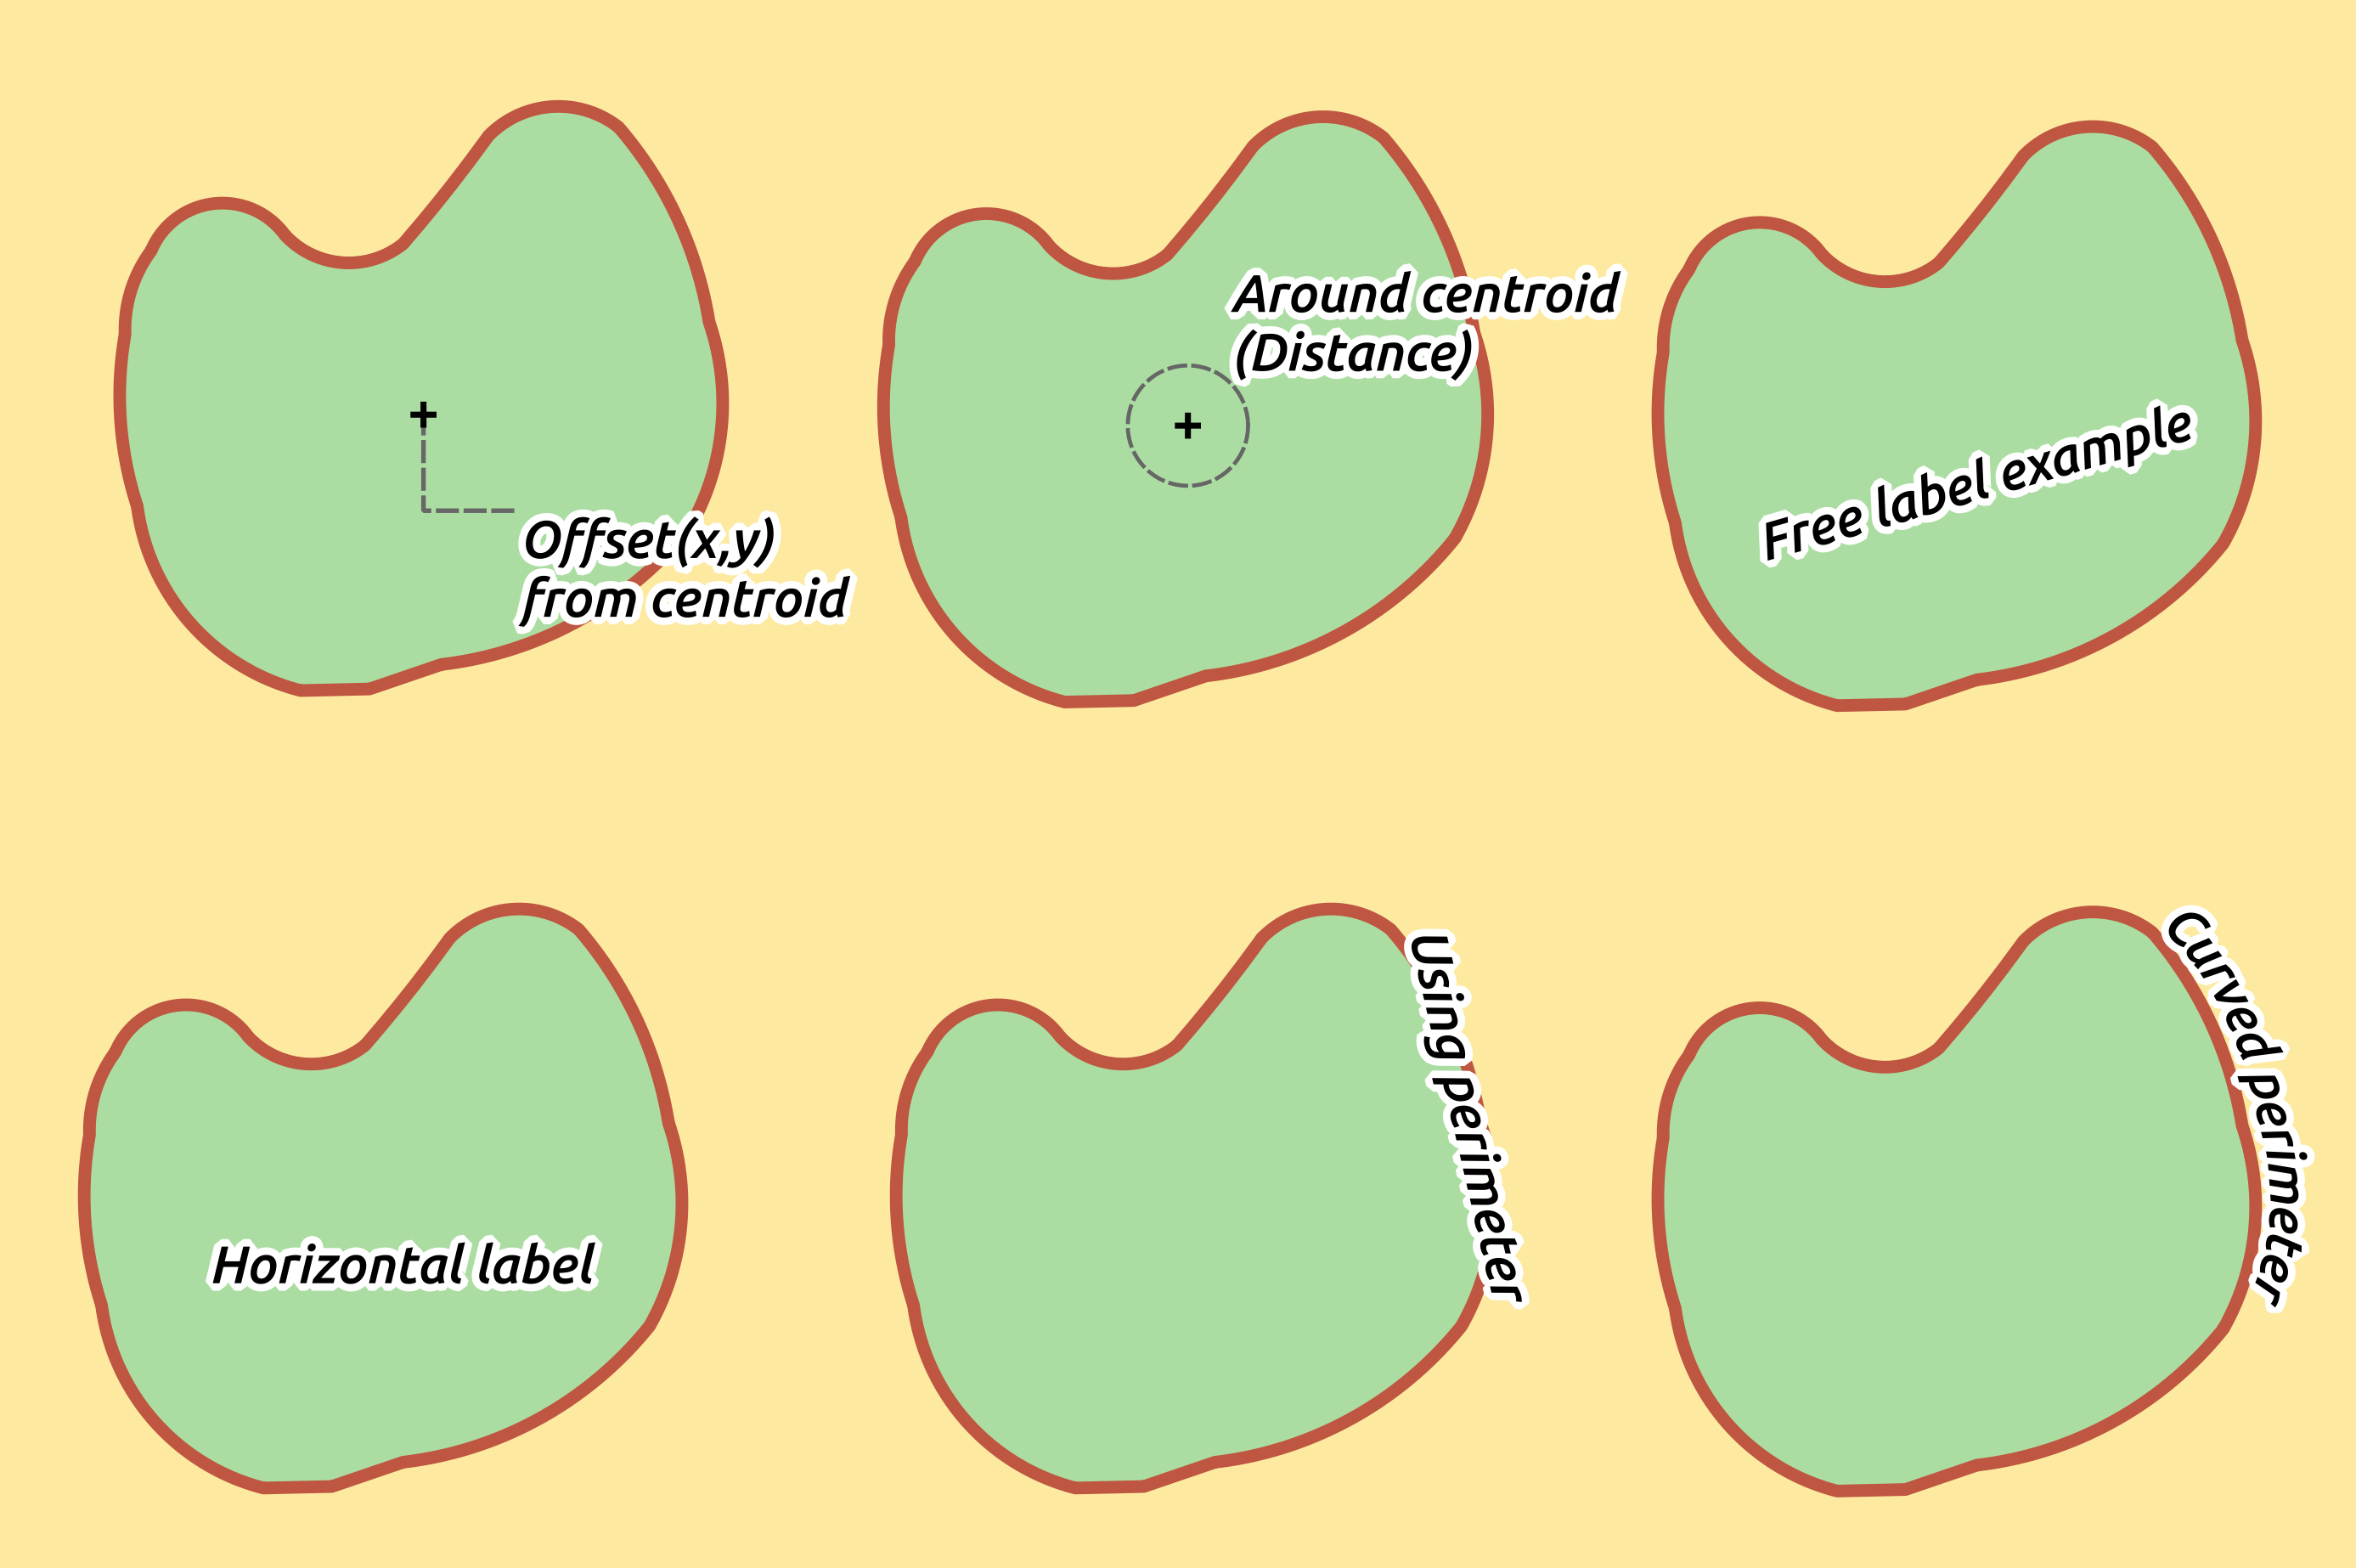
폴리곤 피처의 라벨 배치 예시
Priority 부분에서 세 가지 벡터 유형(포인트, 라인, 폴리곤)에 대해 어느 라벨을 먼저 렌더링할지 그 우선 순위를 정의할 수 있습니다. 이 배치 옵션은 맵 캔버스에 있는 다른 벡터 레이어들의 라벨과 상호작용합니다. 서로 다른 레이어들의 라벨들이 동일한 위치에 있을 경우, 더 높은 우선 순위를 가진 라벨을 표시할 것입니다. 낮은 순위의 라벨은 표시되지 않습니다.
렌더링 탭
In the Rendering tab, you can tune when the labels can be rendered and their interaction with other labels and features.
Label options 아래 각각 축척에 따라 그리고 픽셀 크기에 따라 가시성을 설정할 수 있는 Scale-based 및 Pixel size-based 옵션이 있습니다.
Label z-index 옵션은 라벨 렌더링 순서는 물론, 다른 레이어의 라벨과의 관계를 설정하는 것처럼 (데이터 정의 무시 표현식을 이용해서) 동일 레이어에 있는 다른 피처 라벨과의 관계성도 결정합니다. 더 낮은 Z 인덱스를 가진 (모든 레이어의) 라벨 위에 더 높은 Z 인덱스를 가진 라벨을 렌더링합니다.
여기에, 라벨 2개가 일치하는 Z 인덱스를 가지도록 논리가 수정됐을 경우:
동일 레이어의 라벨인 경우, 더 큰 라벨 위에 더 작은 라벨을 그립니다.
서로 다른 레이어의 라벨인 경우, 레이어 자체의 우선 순위(예를 들어 맵 범례에서의 순서)를 따릅니다.
이 설정이 다른 레이어의 피처 아래에 라벨을 그리도록 하는 것이 아니라, 그저 모든 레이어의 피처에 대한 라벨 렌더링 우선 순위를 제어할 뿐이라는 점을 기억하십시오.
라벨 렌더링 작업 도중 읽기 쉬운 라벨을 표시하기 위해 QGIS는 라벨들의 위치를 자동적으로 평가하고 서로 충돌할 경우 일부 라벨을 숨길 수 있습니다. 하지만 Show all labels for this layer (including colliding labels) 체크박스를 활성화시켜 라벨들의 위치를 직접 수정할 수 있습니다.
Show label 및 Always Show 에서 데이터 정의 표현식을 이용하면, 어떤 라벨을 렌더링해야 하는지를 미세 조정할 수 있습니다.
Feature options 아래에서 멀티 피처의 모든 부분에 라벨을 그리는 Label every part of a multi-part feature 옵션을 선택할 수도 있고, Limit the number of features to be labeled 옵션을 선택해서 라벨을 그릴 피처의 개수를 제한할 수도 있습니다. 라인 및 폴리곤 레이어 둘 다 라벨을 그릴 피처의 최소 크기를 설정할 수 있는 Suppress labeling of features smaller than 옵션을 제공합니다. 폴리곤 피처의 경우, 라벨이 피처 내부에 완전히 들어가는지 여부를 바탕으로 라벨의 가시성을 필터링할 수도 있습니다. 라인 피처의 경우, Merge connected lines to avoid duplicate labels 옵션을 선택하면 배치 탭에 있는 Distance 또는 Repeat 옵션과 결합해서 훨씬 보기 좋은 맵을 렌더링할 수 있습니다.
Obstacles 프레임에서 라벨과 피처 사이의 가리기(covering) 관계를 관리할 수 있습니다. 레이어의 피처가 (동일 레이어에 있는 다른 피처의 라벨을 포함해서) 모든 라벨의 방해물(obstacle)로서 동작해야 하는지 여부를 결정하려면 Discourage labels from covering features 옵션을 활성화하십시오. 여기서 방해물이란 QGIS가 가능한 한 그 위에 라벨을 렌더링하지 않으려 하는 피처를 말합니다. 이 옵션 옆에 있는 Data-defined override 제어를 이용하면, 방해물로 사용할 피처 하위 집합을 전체 레이어 대신 정의할 수 있습니다.
방해물 용 우선 순위 제어 슬라이드 바를 이용하면 라벨과 피처가 중첩하는 경우 특정 레이어의 피처를 다른 레이어의 피처보다 더 선호하게 만들 수 있습니다. 낮은 가중치 의 방해물 우선 순위는 레이어의 피처를 방해물로 덜 여기게 만들어, 라벨로 가려질 가능성이 더 커진다는 뜻입니다. 이 우선 순위를 데이터로 정의할 수도 있는데, 즉 동일한 레이어 내부에서 특정 피처가 다른 피처보다 더 많이 가려지도록 만들 수 있다는 뜻입니다.
폴리곤 레이어의 경우, 라벨 배치를 최소화해서 방해물 피처가 될 수 있는 유형을 선택할 수 있습니다:
Over the feature’s interior: 폴리곤 내부에 라벨이 배치되지 않도록 합니다. (라벨을 완전히 폴리곤 바깥에 배치하거나 폴리곤 내부에 살짝만 걸치도록 배치하는 것을 선호합니다.)
Over the feature’s boundary: 폴리곤의 경계선에 라벨이 배치되지 않도록 합니다. (라벨을 완전히 폴리곤 바깥에 또는 완전히 폴리곤 내부에 배치하는 것을 선호합니다.) 예를 들면, 이 옵션은 피처가 전체 영역을 덮고 있는 지역 경계 레이어에 유용합니다. 이런 경우 라벨을 이 피처들 내부에 배치해야 하고, 라벨이 피처들 사이의 경계선을 걸치도록 배치되는 일을 피해야 더 보기에도 좋습니다.
규칙 기반 라벨 작업
Rule-based Renderer 에서처럼, 규칙 기반 라벨 작업으로 한 번에 여러 라벨을 환경 설정할 수 있고 표현식 필터와 축척 범위를 바탕으로 선택적으로 적용할 수 있습니다.
To create a rule, select the Rule-based labeling option in the main
drop-down list from the Labels tab and click the button
at the bottom of the dialog. Then fill the new dialog with a description and an
expression to filter features. You can also set a scale range in which the label rule should be applied. The other
options available in this dialog are the common settings
seen beforehand.
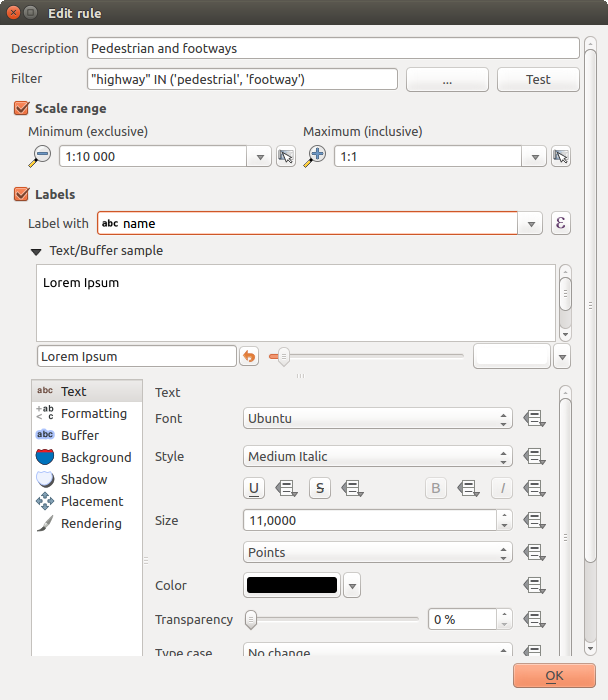
규칙 설정
주 대화창에 기존 규칙들의 요약을 표시합니다. (규칙 기반 라벨 작업 패널 그림 참조) 규칙을 여러 개 추가할 수 있고, 드래그&드롭으로 규칙들을 재배열하거나 연결시킬 수도 있습니다. 버튼으로 규칙을 제거할 수도 있고, 규칙을 더블클릭하거나  버튼을 클릭하면 규칙을 편집할 수도 있습니다.
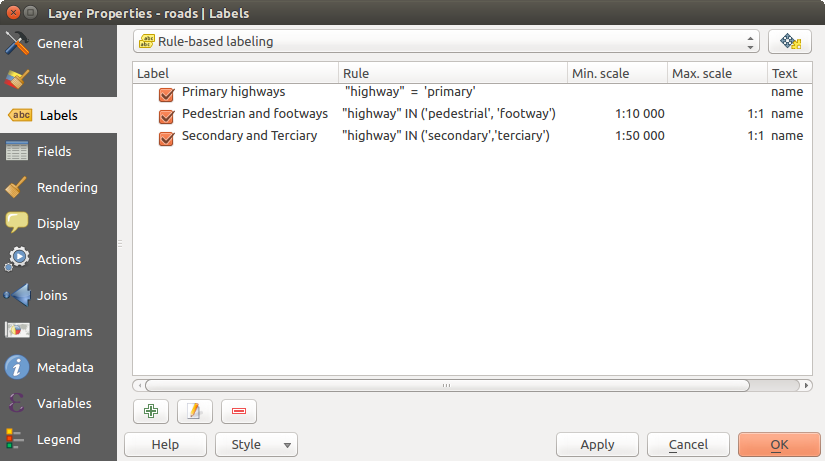
규칙 기반 라벨 작업 패널
표현식을 기반으로 라벨 정의하기
Whether you choose simple or rule-based labeling type, QGIS allows using
expressions to label features. Click the icon near the
Label with drop-down list in the Labels tab
of the properties dialog. In figure_labels_expression, you see a sample
expression to label the alaska regions with name and area size, based on the
field ‘NAME_2’, some descriptive text, and the function $area in combination
with format_number() to make it look nicer.
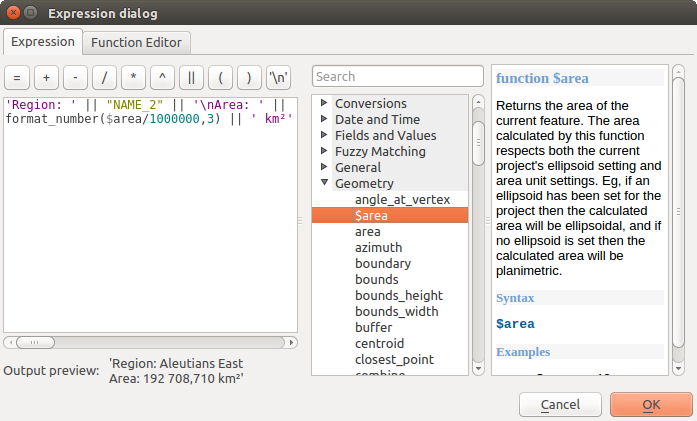
라벨 작업에 표현식 이용하기
표현식 기반 라벨 작업은 쉽습니다. 사용자가 주의해야 할 점은 다음 세 가지뿐입니다:
- You need to combine all elements (strings, fields, and functions) with a string concatenation function such as concat, + or ||. Be aware that in some situations (when null or numeric value are involved) not all of these tools will fit your need.
문자열은 ‘작은따옴표’ 안에 작성해야 합니다.
필드는 “큰따옴표” 안에, 또는 아무 따옴표도 없이 작성해야 합니다.
예시를 몇 가지 살펴보겠습니다:
‘name’ 및 ‘place’ 필드 2개를 쉼표로 구분하는 라벨:
"name" || ', ' || "place"
다음을 반환합니다:
John Smith, Paris
‘name’ 및 ‘place’ 필드 2개와 다른 텍스트를 바탕으로 하는 라벨:
'My name is ' + "name" + 'and I live in ' + "place"
'My name is ' || "name" || 'and I live in ' || "place"
concat('My name is ', name, ' and I live in ', "place")
다음을 반환합니다:
My name is John Smith and I live in Paris
‘name’ 및 ‘place’ 필드 2개와 다른 텍스트를 서로 다른 연결 함수로 결합하는 라벨:
concat('My name is ', name, ' and I live in ' || place)다음을 반환합니다:
My name is John Smith and I live in Paris
또는 ‘place’ 필드가 NULL 값인 경우 다음을 반환합니다:
My name is John Smith
‘name’ 및 ‘place’ 필드 2개와 설명 텍스트를 바탕으로 하는 여러 줄의 라벨:
concat('My name is ', "name", '\n' , 'I live in ' , "place")다음을 반환합니다:
My name is John Smith
I live in Paris
필드와 $area 함수로 장소명 및 변환 단위의 반올림된 면적을 바탕으로 하는 라벨:
'The area of ' || "place" || ' has a size of '
|| round($area/10000) || ' ha'
다음을 반환합니다:
The area of Paris has a size of 10500 ha
CASE ELSE 조건을 생성해봅시다. ‘population’ 필드의 인구 값이 5만 명 이하일 경우 ‘town’, 초과할 경우 ‘city’로 라벨을 생성하려면:
concat('This place is a ',
CASE WHEN "population <= 50000" THEN 'town' ELSE 'city' END)
다음을 반환합니다:
This place is a town
표현식 작성기에서 볼 수 있듯이, QGIS는 사용자 데이터의 라벨을 위한 단순 및 복잡 표현식을 생성하는 데 쓸 수 있는 함수를 수백 개나 제공하고 있습니다. 표현식에 관한 자세한 정보 및 예시를 살펴보려면 표현식 을 참조하세요.
라벨 작업에 데이터 정의 무시 이용하기
With the Data defined override functions, the settings for
the labeling are overridden by entries in the attribute table. It can be used to
set values for most of the labeling options described above. See the widget’s
description and manipulation in 데이터 정의 무시 설정 section.
라벨 툴바
Label Toolbar 는 라벨 또는  도표 속성을 조작할 수 있는 몇몇 도구를 제공합니다. 그러나 대응하는 데이터 정의 옵션이 활성화된 경우에만 제공합니다. 활성화된 상태가 아니라면, 버튼들이 비활성화돼 있을 겁니다. 레이어도 편집 모드여야 할 수도 있습니다.
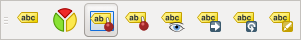
라벨 툴바
라벨 툴바를 설명하는 데 가독성을 위해 “라벨”이란 단어를 쓰고 있기는 해도, 도구 명칭으로 언급되는 경우 도구들이 도표와도 거의 동일한 방식으로 동작한다는 점을 기억하십시오:
 Pin/Unpin Labels And Diagrams: 데이터로 정의된 위치를 지닌 라벨 및 도표에 핀을 꽂거나 뺍니다. 영역을 클릭 또는 드래그해서 라벨(들)에 핀을 꽂습니다. Shift 키를 누른 채 영역을 클릭하거나 드래그하면 라벨(들)의 핀을 뺍니다. 마지막으로 Ctrl 키를 누른 채 영역을 클릭하거나 드래그하면 라벨(들)의 핀 상태를 반전시킬 수 있습니다.
 Highlight Pinned Labels And Diagrams: 라벨이 있는 벡터 레이어가 편집 가능한 상태인 경우 라벨의 핀을 초록색으로 강조합니다. 아닌 경우 핀은 파란색입니다.
 Move Label And Diagram: 데이터로 정의된 위치를 지닌 라벨 및 도표를 이동시킵니다. 원하는 위치로 라벨을 드래그하기만 하면 됩니다.
 Show/Hide Labels And Diagrams: 데이터로 정의된 가시성을 지닌 라벨 및 도표를 표시하거나 숨깁니다. Shift 키를 누른 채 영역을 클릭하거나 드래그하면 라벨(들)을 숨깁니다. 라벨이 숨겨진 상태일 경우, 그 가시성을 복구하려면 객체의 포인트 주변 영역을 클릭하거나 드래그하기만 하면 됩니다.
 Rotate Label: 라벨을 클릭한 채 마우스를 움직이면 텍스트가 기울어집니다.
 Change Label: 이 아이콘을 누른 다음 라벨을 클릭하면, 해당 라벨의 속성을 변경할 수 있는 대화창이 열립니다. 라벨 그 자체, 라벨의 좌표, 각도, 폰트, 크기 등등 그 속성이 필드에 매핑돼 있는 한 해당 속성을 변경할 수 있습니다.
경고
라벨 도구는 현재 필드 값을 덮어 씁니다
라벨 작업을 사용자 지정하는 데 Label toolbar 를 사용하면 매핑된 필드에 새 속성값을 실제로 작성합니다. 따라서, 사용자가 나중에 필요할 수도 있는 데이터를 무심코 덮어 쓰지 않도록 주의하십시오!
맵 캔버스에서 라벨을 사용자 지정하기
Combined with the Label Toolbar, the data defined override setting
helps you manipulate labels in the map canvas (move, edit, rotate).
We now describe an example using the data-defined override function for the
Move label function (see figure_labels_data_defined).
QGIS 예시 데이터셋으로부터 lakes.shp 레이어를 가져옵니다.
레이어를 더블클릭해서 레이어 속성 대화창을 엽니다. Labels 탭을 선택하고 Placement 를 클릭한 다음
Offset from centroid 를 선택합니다.Data defined 항목을 찾아
아이콘을 클릭해서 Coordinate 의 필드 유형을 정의합니다. X 값으로 xlabel 을, Y 값으로 ylabel 을 선택합니다. 이제 아이콘이 노란색으로 강조됐을 겁니다.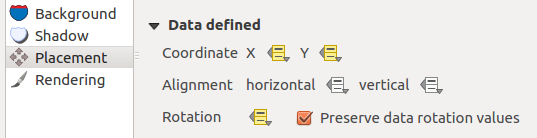
데이터 정의 무시를 통한 벡터 폴리곤 레이어의 라벨 작업
호수로 확대/축소합니다.
 Toggle Editing 버튼으로 레이어를 편집 가능한 상태로 설정합니다.
라벨 툴바의
아이콘을 클릭합니다. 이제 또다른 위치로 라벨을 직접 옮길 수 있습니다. (이동시킨 라벨 그림을 참조하세요.) 라벨의 새 위치가 속성 테이블의 xlabel 및 ylabel 열에 저장됩니다.도형 생성기 를 아래 있는 표현식과 함께 이용하면, 각 호수와 이동시킨 라벨을 연결하는 라인스트링 심볼 레이어를 추가할 수도 있습니다.
make_line( centroid( $geometry ), make_point( "xlabel", "ylabel" ) )
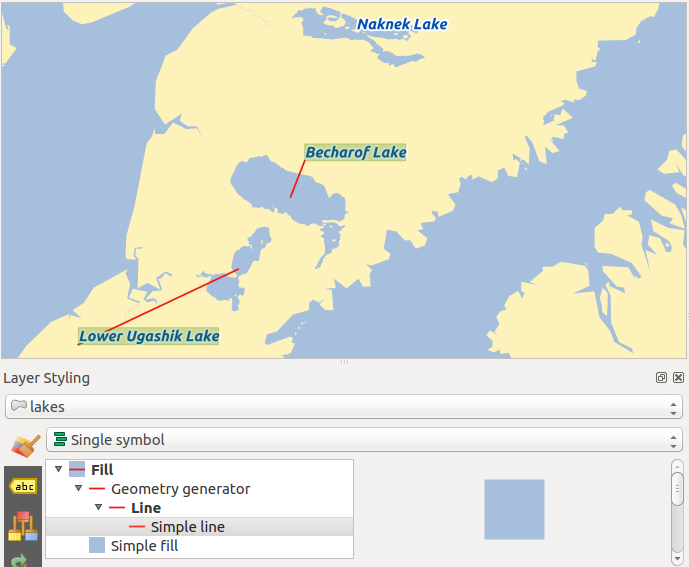
이동시킨 라벨
Fields Properties
 The Fields tab helps you organize the fields of
the selected dataset and the way you can interact with
the feature’s attributes. The buttons
The Fields tab helps you organize the fields of
the selected dataset and the way you can interact with
the feature’s attributes. The buttons  New field and
  Delete field
can be used when the dataset is in Editing mode.
Delete field
can be used when the dataset is in Editing mode.
You can rename fields by double-clicking in the fields name (note that you should switch to editing mode to edit the field name). This is only supported for data providers like PostgreSQL, Oracle, Memory layer and some OGR layer depending the OGR data format and version.
피처 양식 또는 속성 테이블에 사람이 읽을 수 있는 필드를 표시하기 위한 몇몇 별명(alias)을 정의할 수 있습니다. 이 경우 편집 모드로 전환할 필요는 없습니다. 별명은 프로젝트 파일에 저장됩니다.
Comments can be added by clicking in the comment field of the column but if you are using a PostgreSQL layer, comment of the column could be the one in the PostgreSQL table if set. Comments are saved in the QGIS project file as for the alias.
The dialog also lists read-only characteristics of the field such as its type, type name, length and precision. When serving the layer as WMS or WFS, you can also check here which fields could be retrieved.
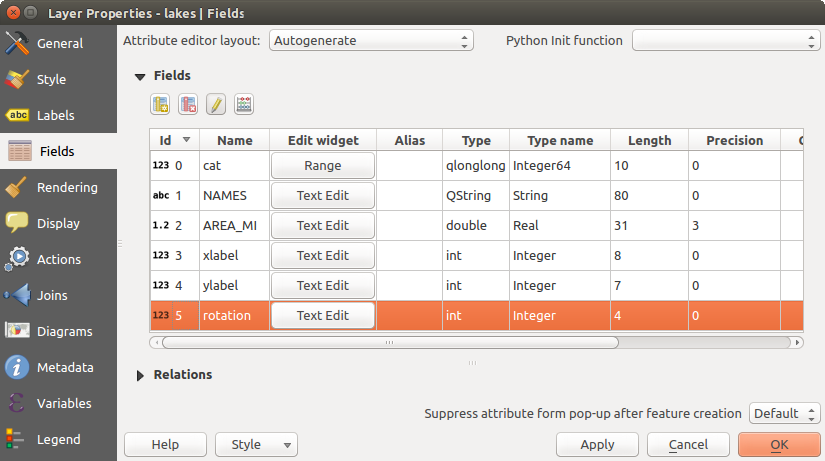
Field properties tab
필드 습성 환경 설정
Within the Fields tab, you also find an Edit widget column. This column can be used to define values or a range of values that are allowed to be added to the specific attribute table column. It also helps to set the type of widget used to fill or display values of the field, in the attribute table or the feature form. If you click on the [Edit widget] button, a dialog opens, where you can define different widgets.
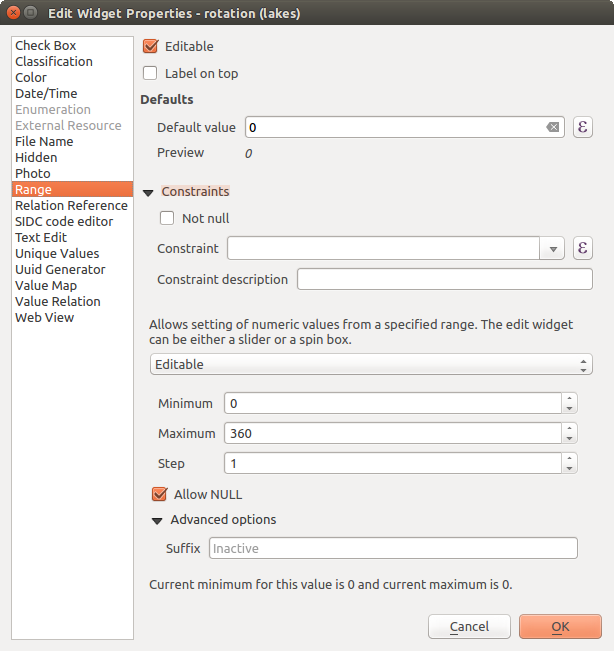
속성 열에 대한 편집 위젯을 선택할 수 있는 대화창
공통 설정
Regardless the type of widget applied to the field, there are some common properties you can set to control whether and how a field can be edited:
Editable: uncheck this to set the field read-only (not manually modifiable) when the layer is in edit mode. Note that checking this setting doesn’t override any edit limitation from the provider.
Label on top: places the field name above or beside the widget in the feature form
Default value: for new features, automatically populates by default the field with a predefined value or an expression-based one. For example, you can:
- use $x, $length, $area to populate a field with the feature’s x coordinate, length, area or any geometric information at its creation;
- incremente a field by 1 for each new feature using maximum("field")+1;
- save the feature creation datetime using now();
- use variables in expressions, making it easier to e.g. insert the operator name (@user_full_name), the project file path (@project_path), ...
A preview of the resulting default value is displayed at the bottom of the widget.
주석
The Default value option is not aware of the values in any other field of the feature being created so it won’t be possible to use an expression combining any of those values i.e using an expression like concat(field1, field2) may not work.
Constraints: you can constrain the value to insert in the field. This constraint can be:
- Not null: force the user to provide a value
based on a custom expression: e.g. regexp_match(col0,'A-Za-z') to ensure that the value of the field col0 has only alphabetical letter.
A short description of the constraint can be added and will be displayed at the top of the form as a warning message when the value supplied does not match the constraint.
편집 위젯
The available widgets are:
- Checkbox: Displays a checkbox, and you can define what attribute is added to the column when the checkbox is activated or not.
- Classification: Displays a combo box with the values used for classification, if you have chosen ‘unique value’ as legend type in the Style tab of the properties dialog.
- Color: Displays a color button allowing user to choose a color from the color dialog window.
Date/Time: 날짜, 시간, 또는 둘 다 입력하기 위한 캘린더 위젯을 열 수 있는 한 줄짜리 텍스트 란을 표시합니다. 열이 텍스트 유형이어야만 합니다. 캘린더 팝업창 등의 사용자 지정 서식을 선택할 수 있습니다.
- Enumeration: Opens a combo box with values that can be used within the columns type. This is currently only supported by the PostgreSQL provider.
- External Resource: Uses a “Open file” dialog to store file path in a relative or absolute mode. It can also be used to display a hyperlink (to document path), a picture or a web page.
- File Name: Simplifies the selection by adding a file chooser dialog.
Hidden: 숨겨진 속성 열을 볼 수 없습니다. 사용자가 열의 내용을 확인할 수 없습니다.
- Photo: Field contains a filename for a picture. The width and height of the field can be defined.
Range: 특정 범위에서 숫자 값을 설정할 수 있습니다. 슬라이드 바 또는 스핀박스 위젯 가운데 선택할 수 있습니다.
Relation Reference: 이 위젯은 실제 레이어의 피처 양식 상에 참조 레이어의 피처 양식을 삽입할 수 있게 해줍니다. 일대다 또는 다대다 관계 생성 을 참조하세요.
Text Edit (기본값): 간단한 텍스트 또는 여러 줄의 텍스트를 쓸 수 있는 텍스트 편집란을 엽니다. 여러 줄 유형을 선택한 경우 HTML 내용도 선택할 수 있습니다.
Unique Values: 속성 테이블에서 이미 사용된 값들 가운데 하나를 선택할 수 있습니다. Editable 설정을 체크한 경우 자동 완성을 지원하는 한 줄짜리 텍스트 편집란을 표시하며, 체크하지 않은 경우 콤보박스를 표시합니다.
- UUID Generator: Generates a read-only UUID (Universally Unique Identifiers) field, if empty.
Value Map: 콤보박스를 사전 정의된 항목과 함께 표시합니다. 값은 속성에 저장돼 있으며, 설명은 콤보박스에 표시됩니다. 값을 직접 정의할 수도 있고, 레이어 또는 CSV 파일에서 불러올 수도 있습니다.
- Value Relation: Offers values from a related table in a combobox. You can select layer, key column and value column. Several options are available to change the standard behaviours: allow null value, order by value, allow multiple selections and use of autocompleter. The forms will display either a drop-down list or a line edit field when completer checkbox is enabled.
- Web View: Field contains a URL. The width and height of the field is variable.
참고
Relative Path in widgets
If the path which is selected with the file browser is located in the same directory as the .qgs project file or below, paths are converted to relative paths. This increases portability of a .qgs project with multimedia information attached. This is enabled only for File Name, Photo and Web View at this moment.
Customize a form for your data
By default, when you click on a feature with the  Identify
Features tool or switch the attribute table to the form view mode, QGIS
displays a form with tabulated textboxes (one per field). This rendering is
the result of the default Autogenerate value of the Layer
properties ‣ Fields ‣ Attribute editor layout setting. Thanks to the
widget setting, you can improve this dialog.
Identify
Features tool or switch the attribute table to the form view mode, QGIS
displays a form with tabulated textboxes (one per field). This rendering is
the result of the default Autogenerate value of the Layer
properties ‣ Fields ‣ Attribute editor layout setting. Thanks to the
widget setting, you can improve this dialog.
You can furthermore define built-in forms (see figure_fields_form), e.g. when you have objects with many attributes, you can create an editor with several tabs and named groups to present the attribute fields.
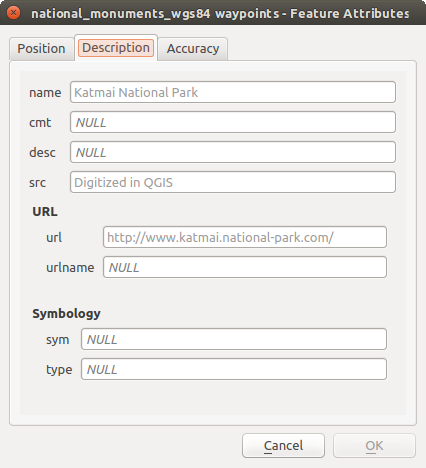
탭과 명명된 그룹을 가진 내장 양식의 생성 결과물
드래그&드롭 구성기
Choose Drag and drop designer from the Attribute editor layout combobox to layout the features form within QGIS. Then, drag and drop rows from the Fields frame to the Label panel to have fields added to your custom form.
You can also use categories (tab or group frames) to better structure the form.
The first step is to use the icon to create a tab in which fields
and groups will be displayed (see figure_fields_layout). You can create as many
categories as you want.
The next step will be to assign to each category the relevant fields, using the
 icon. You’d need to select the targeted category beforehand.
You can use the same fields many times.
icon. You’d need to select the targeted category beforehand.
You can use the same fields many times.
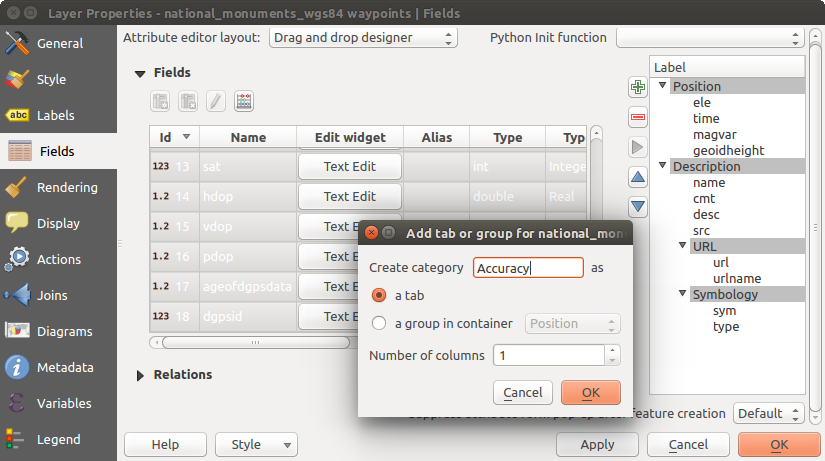
속성 편집기 레이아웃 으로 범주를 생성한 대화창
더블클릭으로 탭 또는 그룹의 환경을 설정할 수 있습니다. QGIS가 다음과 같은 설정을 할 수 있는 양식을 엽니다:
- choose to hide or show the item label
- rename the category
- set over how many columns the fields under the category should be distributed
- enter an expression to control the category visibility. The expression will be re-evaluated everytime values in the form change and the tab or groupbox shown/hidden accordingly.
- show the category as a group box (only available for tabs)
필드 라벨을 더블클릭하면, 양식에서 해당 위젯의 라벨을 표시할지 말지를 설정할 수 있습니다.
In case the layer is involved in one to many relations (see 일대다 또는 다대다 관계 생성), referencing layers are listed in the Relations frame and their form can be embedded in the current layer form by drag-and-drop. Like the other items, double-click the relation label to configure some options:
- choose to hide or show the item label
- show the link button
- show the unlink button
Provide an ui-file
Provide ui-file 옵션은 Qt-Designer로 만든 복잡한 대화창을 사용할 수 있게 해줍니다. UI 파일을 이용하면 대화창을 엄청난 자유도로 생성할 수 있습니다. 레이어의 필드에 그래픽 객체(텍스트 상자, 콤보박스 등등)를 링크시키려면 객체를 필드와 동일한 명칭으로 명명해야 한다는 사실을 기억하십시오.
사용할 파일을 가리키는 경로를 정의하려면 Edit UI 를 이용하십시오.
You’ll find some example in the Creating a new form lesson of the QGIS 교육 교재. For more advanced information, see http://nathanw.net/2011/09/05/qgis-tips-custom-feature-forms-with-python-logic/.
사용자 지정 함수로 사용자 양식 향상시키기
QGIS 양식은 대화창을 열 때 호출되는 파이썬 함수를 보유할 수 있습니다. 이 함수를 이용해서 사용자 대화창에 추가적인 논리를 추가하십시오. 다음 세 가지 서로 다른 방법으로 양식 함수를 설정할 수 있습니다:
load from the environment: 예를 들어 startup.py 파일 또는 설치한 플러그인에 있는 함수를 이용합니다.
load from an external file: 이 경우 사용자의 파일 시스템에서 파이썬 파일을 선택할 수 있는 파일 선택기를 엽니다.
provide code in this dialog: 사용자가 사용할 함수를 직접 입력할 수 있는 파이썬 편집기를 엽니다.
세 가지 방법 모두 사용자가 호출할 함수명을 입력해야만 합니다. (다음 예시에서는 open 입니다.)
다음은 (MyForms.py 모듈에 있는) 예시입니다:
def open(dialog,layer,feature):
    geom = feature.geometry()
    control = dialog.findChild(QWidged,"My line edit")
파이썬 초기화 함수(Python Init Function)에서도 마찬가지로 open 으로 참조합니다.
결합 속성
 Joins 탭에서 불러온 속성 테이블과 불러온 벡터 레이어를 결합시킬 수 있습니다. 아이콘을 클릭하면 Add vector join 대화창이 열립니다. 대상 벡터 레이어와 연결하려는 결합 레이어를 키 열로 정의해야 합니다. 그 다음 결합 레이어와 대상 레이어 양쪽에 공통적인 결합 필드를 설정해야 합니다. 이제 Choose which fields are joined 를 체크해서 결합된 레이어의 필드의 하위 집합도 지정할 수 있습니다. 결합의 결과, 대상 레이어의 속성 테이블에 결합 레이어와 대상 레이어의 모든 정보가 결합된 정보로 표시됩니다. 필드의 하위 집합을 지정한 경우, 대상 레이어의 속성 테이블에 이 필드들만 표시됩니다.
현재 QGIS는 OGR이 지원하는 비공간 테이블 포맷(예: CSV, DBF 및 엑셀), 구분 텍스트 그리고 PostgreSQL 제공자의 결합을 지원하고 있습니다. (기존 벡터 레이어에 속성 테이블 결합 그림 참조)
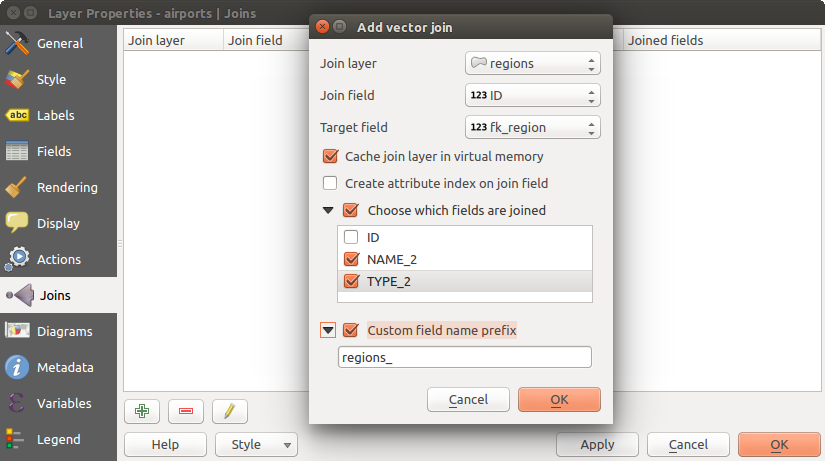
기존 벡터 레이어에 속성 테이블 결합
또, Add vector join 대화창에서 다음 옵션들을 활성화할 수 있습니다:
- Cache join layer in virtual memory
- Create attribute index on the join field
- Choose which fields are joined
- Custom field name prefix: 사용자 지정 필드명 접두어를 생성합니다.
도표 속성
Diagrams 탭에서 벡터 레이어에 그래픽을 중첩시킬 수 있습니다. (도표 속성 - 속성 탭 그림 참조)
현재 도표의 핵심 구현은 다음을 지원하고 있습니다:
- pie charts, a circular statistical graphic divided into slices to illustrate numerical proportion. The arc length of each slice is proportional to the quantity it represents,
- text diagrams, a horizontaly divided circle showing statistics values inside
- and histograms.
참고
도표 유형을 재빨리 바꾸기
서로 다른 도표 유형들의 설정이 거의 동일하다는 점을 고려하면, 사용자가 도표를 구성할 때 도표 유형을 쉽게 변경해서 어떤 유형이 사용자 데이터를 아무 손실 없이 적절하게 표현하는지 확인할 수 있습니다.
각 도표 유형 별로, 속성은 다음과 같은 여러 탭으로 나누어져 있습니다:
속성
Attributes 탭은 도표에 어떤 변수를 표시할지 정의합니다. add item 버튼을 이용해서 ‘Assigned Attributes’ 패널로 원하는 필드를 선택해 넣으십시오. 표현식 으로 생성한 속성도 사용할 수 있습니다.
어떤 행이든 클릭해서 드래그하면 위 아래로 이동시켜 속성이 표시되는 방식을 정렬시킬 수 있습니다. 항목을 더블클릭해서 ‘Legend’ 열에 있는 라벨을 변경하거나, 속성 색상을 변경할 수도 있습니다.
This label is the default text displayed in the legend of the print composer or of the layer tree.
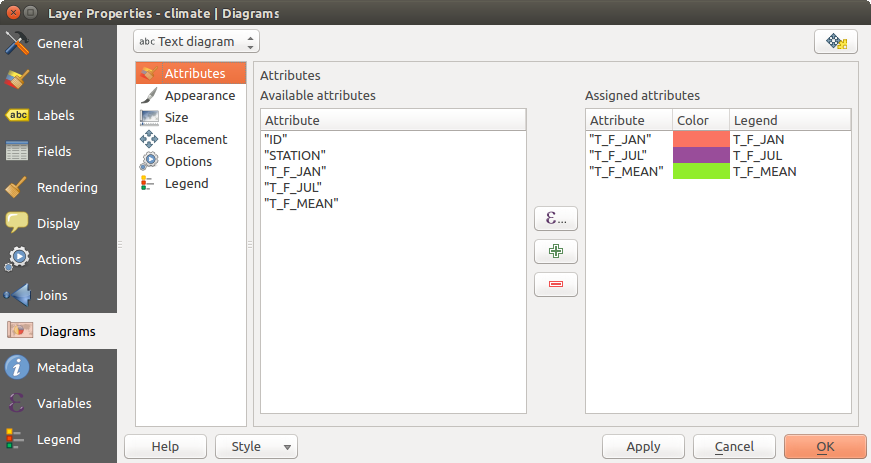
도표 속성 - 속성 탭
Appearance
Appearance defines how the diagram looks like. It provides general settings that do not interfere with the statistic values such as:
- the graphic transparency, its outline width and color
- the width of the bar in case of histogram
- the circle background color in case of text diagram, and the font used for texts
원형 차트에서 처음 표현되는 조각의 왼쪽 라인의 방향: 이 조각들이 시계 방향으로 표시된다는 사실을 기억하십시오.
In this tab, you can also manage the diagram visibility:
- by removing diagrams that overlap others or Show all diagrams even if they overlap each other
- by selecting a field with Data defined visibility to precisely tune which diagrams should be rendered
- by setting the scale visibility
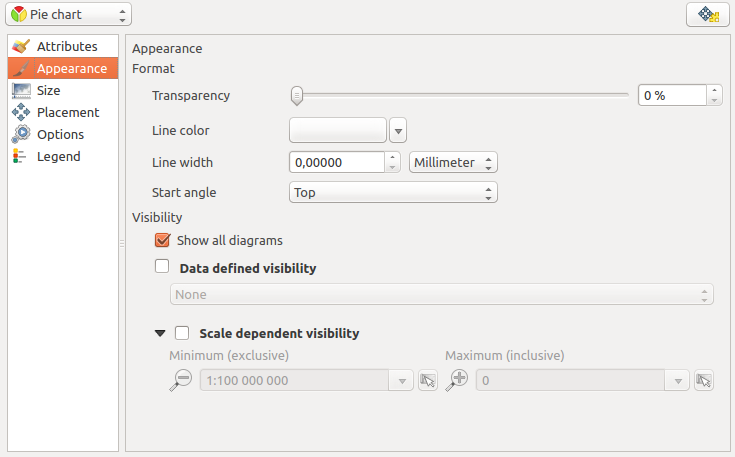
Diagram properties - Appearance tab
크기
Size is the main tab to set how the selected statistics are represented. The diagram size units can be ‘Map Units’ or ‘Millimeters’. You can use :
Fixed size: 모든 피처의 그래픽을 표현하는 유일한 크기입니다. 히스토그램에는 적용되지 않습니다.
Scaled size: 레이어 속성을 이용하는 표현식을 기반으로 크기를 결정합니다.
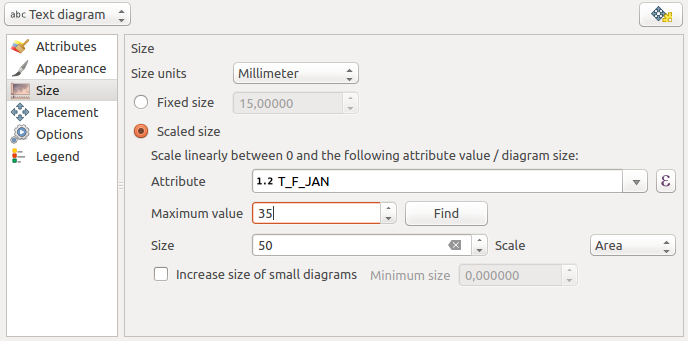
도표 속성 - 크기 탭
배치
Placement 탭에서 도표의 위치를 정의할 수 있습니다. 레이어 도형 유형 별로, 배치에 서로 다른 옵션을 제공하고 있습니다:
‘Over the point’ 또는 ‘Around the point’: 포인트 도형 용입니다. 후자는 반경도 설정해야 합니다.
‘Over the line’ 또는 ‘Around the line’: 라인 도형 용입니다. 포인트 객체와 마찬가지로, 후자는 어느 한 쪽으로의 거리를 설정해야 합니다. 사용자는 객체를 기준으로 (라인의 ‘above’, ‘on’ 그리고/또는 ‘below’) 도표 배치를 지정할 수 있습니다. 한 번에 여러 옵션을 함께 선택할 수도 있습니다. 이 경우, QGIS가 도표의 최적 위치를 찾을 것입니다. 이 탭에서 라인 방향을 이용해서 도표의 위치를 설정할 수도 있다는 점을 기억하십시오.
‘Over the centroid’, ‘Around the centroid’, ‘Perimeter’ 또는 ‘Inside polygon’: 폴리곤 객체 용 옵션입니다. ‘Around the centroid’는 마찬가지로 거리를 설정해야 하고, ‘Inside polygon’을 선택하면 폴리곤 내부에 가능한 위치가 있다면 어디에든 도표를 배치합니다.
The diagram can also be placed using feature data by filling the X and Y fields with an attribute of the feature.
The placement of the diagrams can interact with the labeling, so you can detect and solve position conflicts between diagrams and labels by setting the Priority slider or the z-index value.
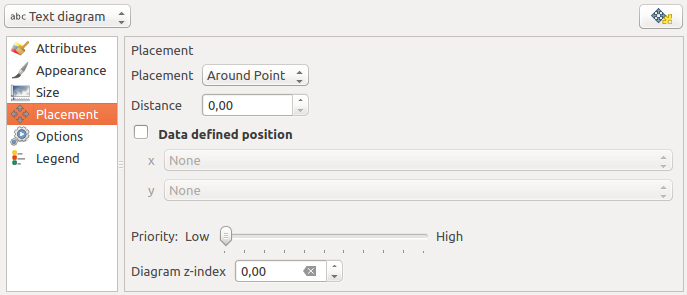
도표 속성 - 배치 탭
범례
From the Legend tab, you can choose to display items of the diagram in the 레이어 패널, besides the layer symbology. It can be:
- the represented attributes: color and legend text set in Attributes tab
- and if applicable, the diagram size, whose symbol you can customize.
When set, the diagram legend items are also available in the print composer legend, besides the layer symbology.
활용 사례
도표의 예시로, 기후 벡터 데이터의 기온 데이터를 보여주는 텍스트 도표를 알래스카 경계선 레이어 위에 중첩시켜보겠습니다. 두 벡터 레이어 모두 QGIS 예시 데이터셋에 포함돼 있습니다. (Sample Data 참조)
먼저
 Load Vector 아이콘을 클릭한 다음, QGIS 예시 데이터셋 폴더로 가서 벡터 shapefile 레이어 alaska.shp 과 climate.shp 2개를 불러옵니다.
맵 범례에 있는 climate 레이어를 더블 클릭해서 Layer properties 대화 창을 엽니다.
Diagrams 탭을 클릭한 다음 Diagram type
콤보박스에서 ‘Text diagram’ 을 선택합니다.Appearance 탭에서 배경색으로 연한 파랑색을 선택한 다음, Size 탭에서 크기를 고정값 18mm로 설정합니다.
Placement 탭에서, 배치를 ‘Around Point’로 설정하면 되겠지요.
도표 안에 T_F_JAN, T_F_JUL 그리고 T_F_MEAN 세 열의 값을 표시하려 합니다. 따라서 Attributes 탭으로 이동한 다음 먼저 T_F_JAN 을 선택하고
버튼을 클릭합니다. 그 다음 T_F_JUL, 마지막으로 T_F_MEAN 에 동일한 작업을 반복합니다.- Now click [Apply] to display the diagram in the QGIS main window.
Size 탭에서 차트 크기를 조정할 수 있습니다.
Scaled size 를 선택하고 속성의 Maximum value 와 Size 옵션을 기반으로 하는 도표 크기를 설정합니다. 스크린 상에 도표가 너무 작게 보이는 경우, Increase size of small diagrams 체크박스를 활성화시키고 도표의 최소 크기를 정의합니다.Assigned attributes 란에 있는 색상값을 더블클릭하면 속성 색상을 변경할 수 있습니다. 맵 상에 기온 데이터 도표를 중첩하기 그림을 보면 색상을 변경하면 어떤 장점이 있는지 감이 올 겁니다.
- Finally, click [Ok].
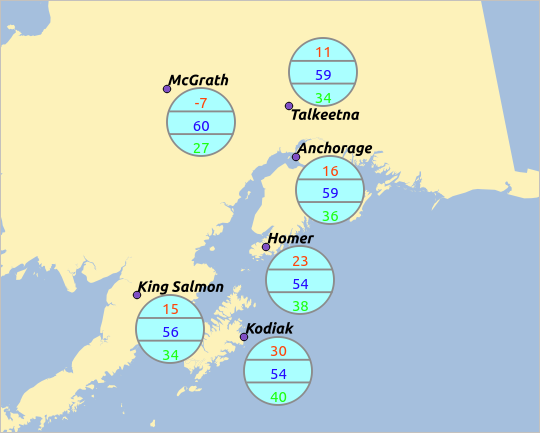
맵 상에 기온 데이터 도표를 중첩하기
Placement 탭에서 Data defined position 를 체크하면 속성 데이터를 이용해서 도표의 위치를 정의할 수 있다는 점을 기억하십시오. Appearance 탭에서는 축척에 따른 가시성을 설정할 수도 있습니다.
크기 및 속성도 표현식으로 정의할 수 있습니다. 표현식을 추가하려면 아이콘을 클릭하십시오. 더 많은 정보 및 예시를 보고 싶다면 표현식 을 참조하세요.
데이터 정의 무시 이용하기
앞에서 설명한 대로, 사용자 지정 데이터 정의를 이용해서 도표 렌더링을 정밀하게 조정할 수 있습니다:
Placement 탭에서 X 및 Y 필드를 입력해서 위치를 조정
Appearance 탭에서 Visibility 필드를 입력해서 가시성을 조정
더 자세한 내용은 라벨 작업에 데이터 정의 무시 이용하기 를 참조하세요.
액션 속성
 QGIS는 객체의 속성을 기반으로 하는 액션을 수행할 수 있는 기능을 제공하고 있습니다. 예를 들면 객체의 속성에서 생성한 인자(argument)와 함께 프로그램을 실행하거나 또는 웹 보고 도구에 파라미터를 전달하는 등의 수많은 액션을 수행할 수 있습니다.
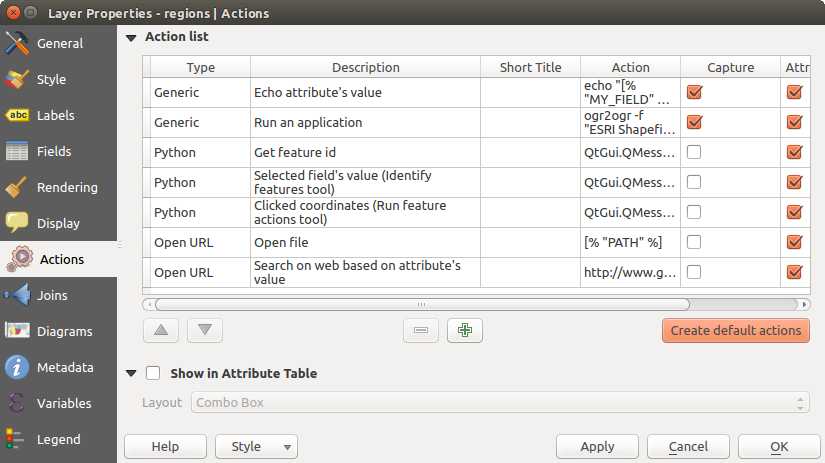
몇몇 예시 액션을 담고 있는 오버뷰 액션 대화창
외부 응용 프로그램을 자주 실행하거나 사용자 벡터 레이어에 있는 하나 이상의 값들을 기반으로 웹 페이지를 보려 하는 경우 액션이 유용합니다. 액션은 6개의 유형으로 나뉘며, 다음과 같이 사용할 수 있습니다:
외부 프로세스를 구동하는 일반, 맥, 윈도우 및 유닉스 액션
파이썬 표현식을 실행하는 파이썬 액션
어디에서나 볼 수 있는 일반 및 파이썬 액션
각각 대응하는 플랫폼 상에서만 볼 수 있는 맥, 윈도우 및 유닉스 액션 (예를 들어, 편집기를 여는 ‘편집’ 액션을 3개 정의해도 사용자는 편집기를 실행하는 플랫폼의 전용 ‘편집’ 액션만을 보고 실행할 수 있습니다.)
There are several examples included in the dialog. You can load them by clicking on [Create default actions]. To edit any of the examples, double-click its row. One example is performing a search based on an attribute value. This concept is used in the following discussion.
액션 정의하기
속성 액션을 정의하려면, 벡터 Layer Properties 대화창을 열고 Actions 탭을 선택하십시오. Actions 탭에서 Add a new action 을 클릭하면 Edit Action 대화창이 열립니다.
Type 옵션으로 액션 유형을 선택하고 액션을 설명하는 명칭을 부여하십시오. 액션 자체의 명칭이 액션을 작동시켰을 때 실행될 응용 프로그램의 명칭을 포함해야만 합니다. 하나 이상의 속성 필드를 응용 프로그램에 대한 인자로서 추가할 수 있습니다. 액션을 작동시켰을 때, 필드명 앞의 % 로 시작하는 어떤 문자 집합도 해당 필드의 값으로 대체될 것입니다. 특수 문자열 %% 는 식별 결과 또는 속성 테이블에서 선택한 필드의 값으로 대체될 것입니다. (다음 액션 사용하기 항을 참조하세요.) 큰따옴표로 여러 텍스트를 묶으면 프로그램, 스크립트 또는 명령어에 대한 단일 인자로 만들 수 있습니다. 큰따옴표 앞에 역 슬래시가 있을 경우 이를 무시할 것입니다.
필드명이 다른 필드명의 하위 문자열인 경우 (예: col1 과 col10) 필드명(과 % 문자)을 꺾쇳괄호로 묶어서 (예: [%col10]) 그 사실을 나타내야 합니다. 이렇게 하면 필드명 %col10 을 뒤에 0이 붙은 %col1 필드명과 혼동하는 일을 피할 수 있습니다. QGIS가 % 문자열을 필드값으로 대체할 때 괄호를 제거할 것입니다. 대체된 필드값이 꺾쇠괄호로 묶여 있길 바란다면, [[%col10]] 처럼 괄호를 두 번 치십시오.
Identify Features 도구를 사용하면 Identify Results 대화창을 열 수 있습니다. 이 대화창에 레이어 유형에 관련된 정보를 담은 (Derived) 항목이 있습니다. 이 파생 필드의 명칭을 (Derived). 로 처리하면 다른 필드에 접근하는 것과 비슷한 방식으로 이 항목의 값에 접근할 수 있습니다. 예를 들어 포인트 레이어는 X 및 Y 필드를 보유하고 있는데, %(Derived).X 및 %(Derived).Y 로 이 필드들의 값을 사용할 수 있습니다. Attribute Table 대화창이 아니라 Identify Results 대화 상자에서만 이 파생 속성을 쓸 수 있습니다.
다음은 예시 액션 2개입니다:
- konqueror http://www.google.com/search?q=%nam
- konqueror http://www.google.com/search?q=%%
In the first example, the web browser konqueror is invoked and passed a URL to open. The URL performs a Google search on the value of the nam field from our vector layer. Note that the application or script called by the action must be in the path, or you must provide the full path. To be certain, we could rewrite the first example as: /opt/kde3/bin/konqueror http://www.google.com/search?q=%nam. This will ensure that the konqueror application will be executed when the action is invoked.
두 번째 예시는 %% 기호를 사용하는데, 특정 필드에서 그 값을 불러오지 않는다는 뜻입니다. 액션을 작동시켰을 때, %% 기호는 식별 결과 또는 속성 테이블에서 선택한 필드의 값으로 대체될 것입니다.
액션 사용하기
Actions can be invoked from either the Identify Results dialog,
an Attribute Table dialog or from Run Feature Action
(recall that these dialogs can be opened by clicking
Identify Features or  Open Attribute Table or
 Run Feature Action). To invoke an action, right
click on the feature and choose the action from the pop-up menu (they should
have been enabled to be displayed in the attribute table). Actions are
listed in the popup menu by the name you assigned when defining the action.
Click on the action you wish to invoke.
Run Feature Action). To invoke an action, right
click on the feature and choose the action from the pop-up menu (they should
have been enabled to be displayed in the attribute table). Actions are
listed in the popup menu by the name you assigned when defining the action.
Click on the action you wish to invoke.
%% 표기를 사용하는 액션을 작동시키는 경우, Identify Results 대화창 또는 Attribute Table 대화창에서 응용 프로그램 또는 스크립트에 전달하려는 필드값을 오른쪽 클릭하십시오.
배시(bash) 및 echo 명령어를 이용해 (따라서  또는 아마도
  에서만 동작할 겁니다) 벡터 레이어에서 데이터를 추출해서 파일로 삽입하는 또다른 예시가 있습니다. 이 레이어는 수종명 taxon_name, 위도 lat 그리고 경도 long 필드를 가지고 있습니다. 서식지를 공간 선택(spatial selection)해서 (QGIS 맵 영역에서 노란색으로 표시된) 선택한 레코드의 필드값들을 텍스트 파일로 내보내려 합니다. 다음은 이 작업을 하기 위한 액션입니다:
bash -c "echo \"%taxon_name %lat %long\" >> /tmp/species_localities.txt"
서식지를 몇 개 선택해서 각각에 대해 액션을 실행한 다음, 산출 파일을 열면 다음과 비슷한 내용을 보게 될 겁니다:
Acacia mearnsii -34.0800000000 150.0800000000
Acacia mearnsii -34.9000000000 150.1200000000
Acacia mearnsii -35.2200000000 149.9300000000
Acacia mearnsii -32.2700000000 150.4100000000
As an exercise, we can create an action that does a Google search on the lakes layer. First, we need to determine the URL required to perform a search on a keyword. This is easily done by just going to Google and doing a simple search, then grabbing the URL from the address bar in your browser. From this little effort, we see that the format is http://google.com/search?q=qgis, where QGIS is the search term. Armed with this information, we can proceed:
lakes 레이어를 불러왔는지 확인합니다.
범례에 있는 레이어를 더블클릭하거나, 또는 오른쪽 클릭한 다음 컨텍스트 메뉴에서 Properties 를 선택해서 Layer Properties 대화창을 엽니다.
Actions 탭을 클릭합니다.
click
Add a new action.액션명을, 예를 들어 Google Search 를 입력합니다.
액션이 실행할 외부 프로그램의 명칭을 지정해야 합니다. 이 경우, 파이어폭스를 이용하겠습니다. 이 프로그램이 사용자 경로에 없을 경우, 전체 경로를 입력해야 합니다.
Following the name of the external application, add the URL used for doing a Google search, up to but not including the search term: http://google.com/search?q=
The text in the Action field should now look like this: firefox http://google.com/search?q=
Click on the drop-down box containing the field names for the lakes layer. It’s located just to the left of the [Insert] button.
From the drop-down box, select ‘NAMES’ and click [Insert].
이제 사용자 액션 텍스트가 다음과 같이 보일 겁니다:
firefox http://google.com/search?q=%NAMES
To finalize and add the action, click the [OK] button.
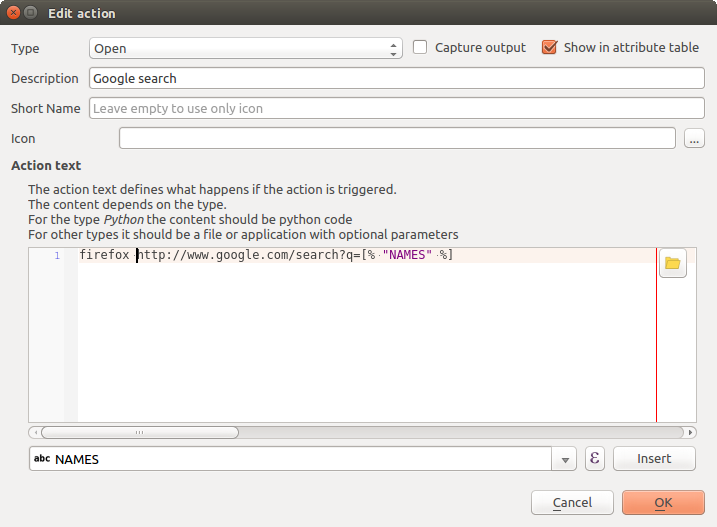
예시 액션 환경을 설정한 액션 편집 대화창
이렇게 액션을 완성했습니다. 이제 사용할 준비가 끝났습니다. 최종 액션 텍스트는 다음과 같아야 합니다:
firefox http://google.com/search?q=%NAMES
이제 액션을 사용할 수 있습니다. Layer Properties 대화창을 닫은 다음 관심 지역으로 확대하십시오. lakes 레이어가 활성화돼 있는지 확인한 다음 호수를 식별하십시오. 식별 결과 창에 생성한 액션이 다음과 같이 추가된 것을 확인할 수 있습니다:
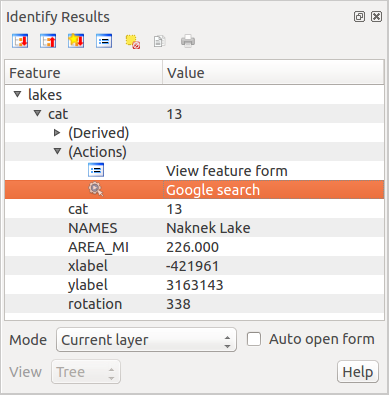
객체 선택 및 액션 선택
When we click on the action, it brings up Firefox and navigates to the URL http://www.google.com/search?q=Tustumena. It is also possible to add further attribute fields to the action. Therefore, you can add a + to the end of the action text, select another field and click on [Insert Field]. In this example, there is just no other field available that would make sense to search for.
레이어 하나에 액션을 여러 개 정의할 수 있고, 각각의 액션이 Identify Results 대화창에 표시될 겁니다.
속성 테이블에서 행을 하나 선택하고 오른쪽 클릭한 다음, 컨텍스트 메뉴에서 액션을 선택해서 액션을 작동시킬 수도 있습니다.
액션의 쓸모는 무궁무진합니다. 예를 들면, 이미지 또는 사진의 위치를 파일명과 함께 담고 있는 포인트 레이어가 있을 경우, 이미지를 표시할 뷰어를 실행시키는 액션을 생성할 수 있습니다. 또는 구글 검색 예제에서와 동일한 방법으로 설정해서 속성 필드 또는 필드 결합에 대한 웹 기반 보고를 수행하는 액션을 사용할 수도 있습니다.
훨씬 복잡한 예제도 만들어볼 수 있습니다. 예를 들어, 파이썬 액션을 이용해서 말이죠.
Usually, when we create an action to open a file with an external application, we can use absolute paths, or eventually relative paths. In the second case, the path is relative to the location of the external program executable file. But what about if we need to use relative paths, relative to the selected layer (a file-based one, like a shapefile or SpatiaLite)? The following code will do the trick:
command = "firefox"
imagerelpath = "images_test/test_image.jpg"
layer = qgis.utils.iface.activeLayer()
import os.path
layerpath = layer.source() if layer.providerType() == 'ogr'
  else (qgis.core.QgsDataSourceURI(layer.source()).database()
    if layer.providerType() == 'spatialite' else None)
path = os.path.dirname(str(layerpath))
image = os.path.join(path,imagerelpath)
import subprocess
subprocess.Popen( [command, image ] )
이 액션이 파이썬 유형 가운데 하나이며 command 및 imagerelpath 변수를 사용자 필요에 맞춰 변경해야 한다는 점만 기억하면 됩니다.
그런데 상대 경로의 기준이 (저장한) 프로젝트 파일 위치여야 하는 경우는 또 어떨까요? 이 경우 파이썬 액션의 코드는 다음처럼 변합니다:
command = "firefox"
imagerelpath = "images/test_image.jpg"
projectpath = qgis.core.QgsProject.instance().fileName()
import os.path
path = os.path.dirname(str(projectpath)) if projectpath != '' else None
image = os.path.join(path, imagerelpath)
import subprocess
subprocess.Popen( [command, image ] )
파이썬 액션의 또다른 예시는 프로젝트에 새 레이어를 추가할 수 있게 해주는 액션입니다. 예를 들어, 다음 예시 코드들은 프로젝트에 각각 벡터와 래스터를 추가할 것입니다. 프로젝트에 추가되는 파일명 및 레이어에 할당되는 명칭은 데이터를 기반으로 합니다. (filename 및 layername 은 액션이 작동한 벡터의 속성 테이블에 있는 열들의 명칭입니다.)
qgis.utils.iface.addVectorLayer('/yourpath/[% "filename" %].shp',
  '[% "layername" %]', 'ogr')
래스터를 (이 예제에서는 TIF 이미지를) 추가하려면 다음 코드를 사용합니다:
qgis.utils.iface.addRasterLayer('/yourpath/[% "filename" %].tif',
  '[% "layername" %]')
표시 속성
 This tab is specifically created for map tips: display a message in
the map canvas when hovering over a feature of the active layer.
This message can either be the value of a Field
or a more complex and full HTML text mixing fields,
expressions and html tags (multiline, fonts, images,
hyperlink ...).
This tab is specifically created for map tips: display a message in
the map canvas when hovering over a feature of the active layer.
This message can either be the value of a Field
or a more complex and full HTML text mixing fields,
expressions and html tags (multiline, fonts, images,
hyperlink ...).
To activate Map Tips, select the menu option View ‣ Map Tips
or click on the Map Tips icon. Map tip is a cross-session feature
meaning that once activated, it stays on and apply to any set layer in any project,
even in future QGIS sessions until it’s toggled off.
Figures Display Code and Mapped show an example of HTML code and how it behaves in map canvas.
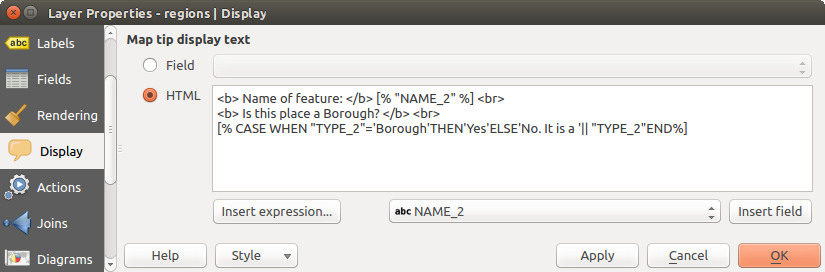
맵 도움말 용 HTML 코드
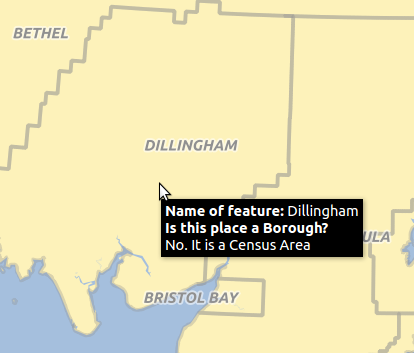
HTML 코드로 생성된 맵 도움말
렌더링 속성
 QGIS offers support for on-the-fly feature generalisation. This can
improve rendering times when drawing many complex features at small scales.
This feature can be enabled or disabled in the layer settings using the
Simplify geometry option. There is also a global
setting that enables generalisation by default for newly added layers (see
global simplification for more information).
QGIS offers support for on-the-fly feature generalisation. This can
improve rendering times when drawing many complex features at small scales.
This feature can be enabled or disabled in the layer settings using the
Simplify geometry option. There is also a global
setting that enables generalisation by default for newly added layers (see
global simplification for more information).
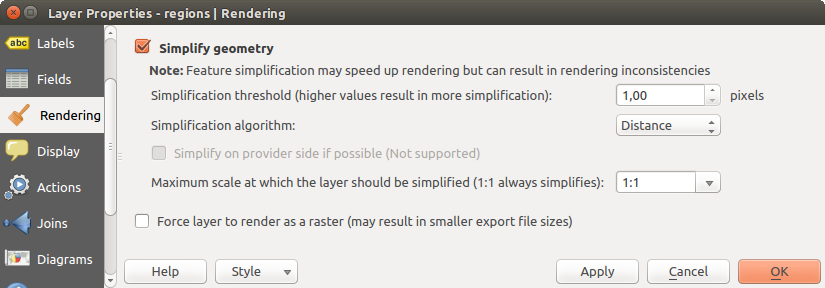
레이어 도형 단순화 대화창
주석
객체 단순화는 어떤 경우 사용자의 렌더링된 산출물에 오류를 남길 수도 있습니다. 폴리곤들 사이의 조각이거나 오프셋 기반 심볼 레이어를 이용한 경우 부정확한 렌더링의 결과일 수도 있습니다.
While rendering extremely detailed layers (e.g. polygon layers with a huge number of nodes), this can cause composer exports in PDF/SVG format to be huge as all nodes are included in the exported file. This can also make the resultant file very slow to work with/open in other programs.
Force layer to render as raster 를 활성화하면 이런 레이어를 강제로 래스터화해서 내보내기 파일이 해당 레이어가 담고 있는 모든 노드를 포함할 필요가 없도록 합니다. 따라서 렌더링 속도도 향상됩니다.
You can also do this by forcing the composer to export as a raster, but that is an all-or-nothing solution, given that the rasterisation is applied to all layers.
메타데이터 속성
 The Metadata tab consists of Description,
Attribution, MetadataURL, LegendUrl
and Properties sections.
The Metadata tab consists of Description,
Attribution, MetadataURL, LegendUrl
and Properties sections.
In the Properties section, you get general information about the layer, including specifics about the type and location, number of features, feature type, and editing capabilities. The Extents table provides you with information on the layer extent and the Layer Spatial Reference System, which is information about the CRS of the layer. This can provide a quick way to get useful information about the layer.
Additionally, you can add or edit a title and abstract for the layer in the Description section. It’s also possible to define a Keyword list here. These keyword lists can be used in a metadata catalog. If you want to use a title from an XML metadata file, you have to fill in a link in the DataUrl field.
XML 메타데이터 카탈로그에서 속성 데이터를 얻으려면 Attribution 부분을 이용하십시오.
MetadataUrl 부분에서 XML 메타데이터 카탈로그를 가리키는 일반 경로를 정의할 수 있습니다. 이 정보는 향후 세션을 위해 QGIS 프로젝트 파일에 저장되며, QGIS 서버에서 사용될 것입니다.
LegendUrl 부분에서는 URL 란에 범례 이미지의 URL을 입력할 수 있습니다. Format 드롭다운 옵션을 이용해서 해당 이미지의 적절한 포맷을 적용시키십시오. 현재 PNG, JPG 및 JPEG 이미지 포맷을 지원하고 있습니다.
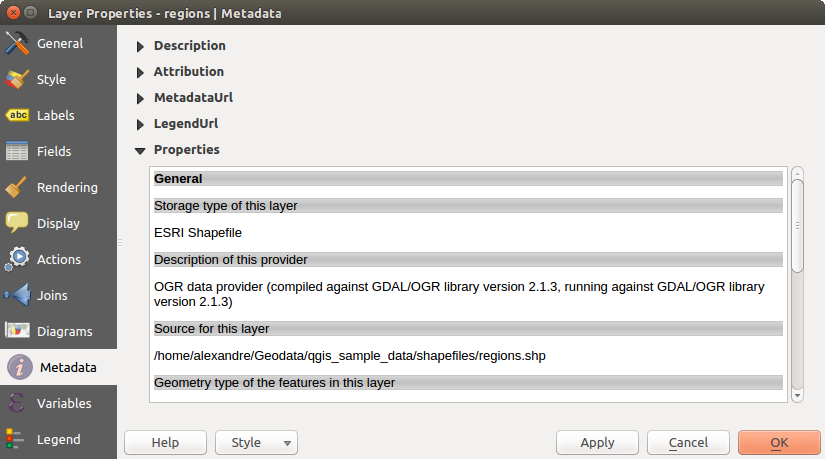
Metadata tab in vector layers properties dialog
참고
서로 다른 레이어 스타일로 재빨리 바꾸기
Using the Styles ‣ Add combobox at the bottom of the Layer Properties dialog, you can save as many combinations of layer properties settings (symbology, labeling, diagram, fields form, actions...) as you want. Then, simply switch between styles from the context menu of the layer in Layers Panel to automatically get different representations of your data.
변수 속성
Variables 탭은 레이어 레벨에서 쓸 수 있는 (전체 및 프로젝트 수준의 모든 변수를 포함하는) 모든 변수들의 목록을 표시합니다.
또한 사용자가 레이어 수준 변수를 관리할 수도 있습니다. 버튼을 클릭해서 새 사용자 지정 레이어 수준 변수를 추가합니다. 마찬가지로, 목록에서 사용자 지정 레이어 수준 변수를 선택한 다음 버튼을 클릭해서 제거합니다.
범례 속성
 The Legend tab provides you with a list of widgets you
can embed within the layer tree in the Layers panel. The idea is to have a
way to quickly access some actions that are often used with the layer (setup
transparency, filtering, selection, style or other stuff...).
The Legend tab provides you with a list of widgets you
can embed within the layer tree in the Layers panel. The idea is to have a
way to quickly access some actions that are often used with the layer (setup
transparency, filtering, selection, style or other stuff...).
QGIS가 기본적으로 투명도 위젯을 제공하고는 있지만, 플러그인의 자체 위젯을 등록하고 플러그인이 관리하는 레이어에 사용자 지정 액션을 할당하면 위젯 목록을 확장할 수 있습니다.