21. 回答シート
21.1. Results For 最初のレイヤーを追加する
21.2. Results For インターフェイスのあらまし
21.3. Results For ベクターデータで作業する
21.3.2.  Databases
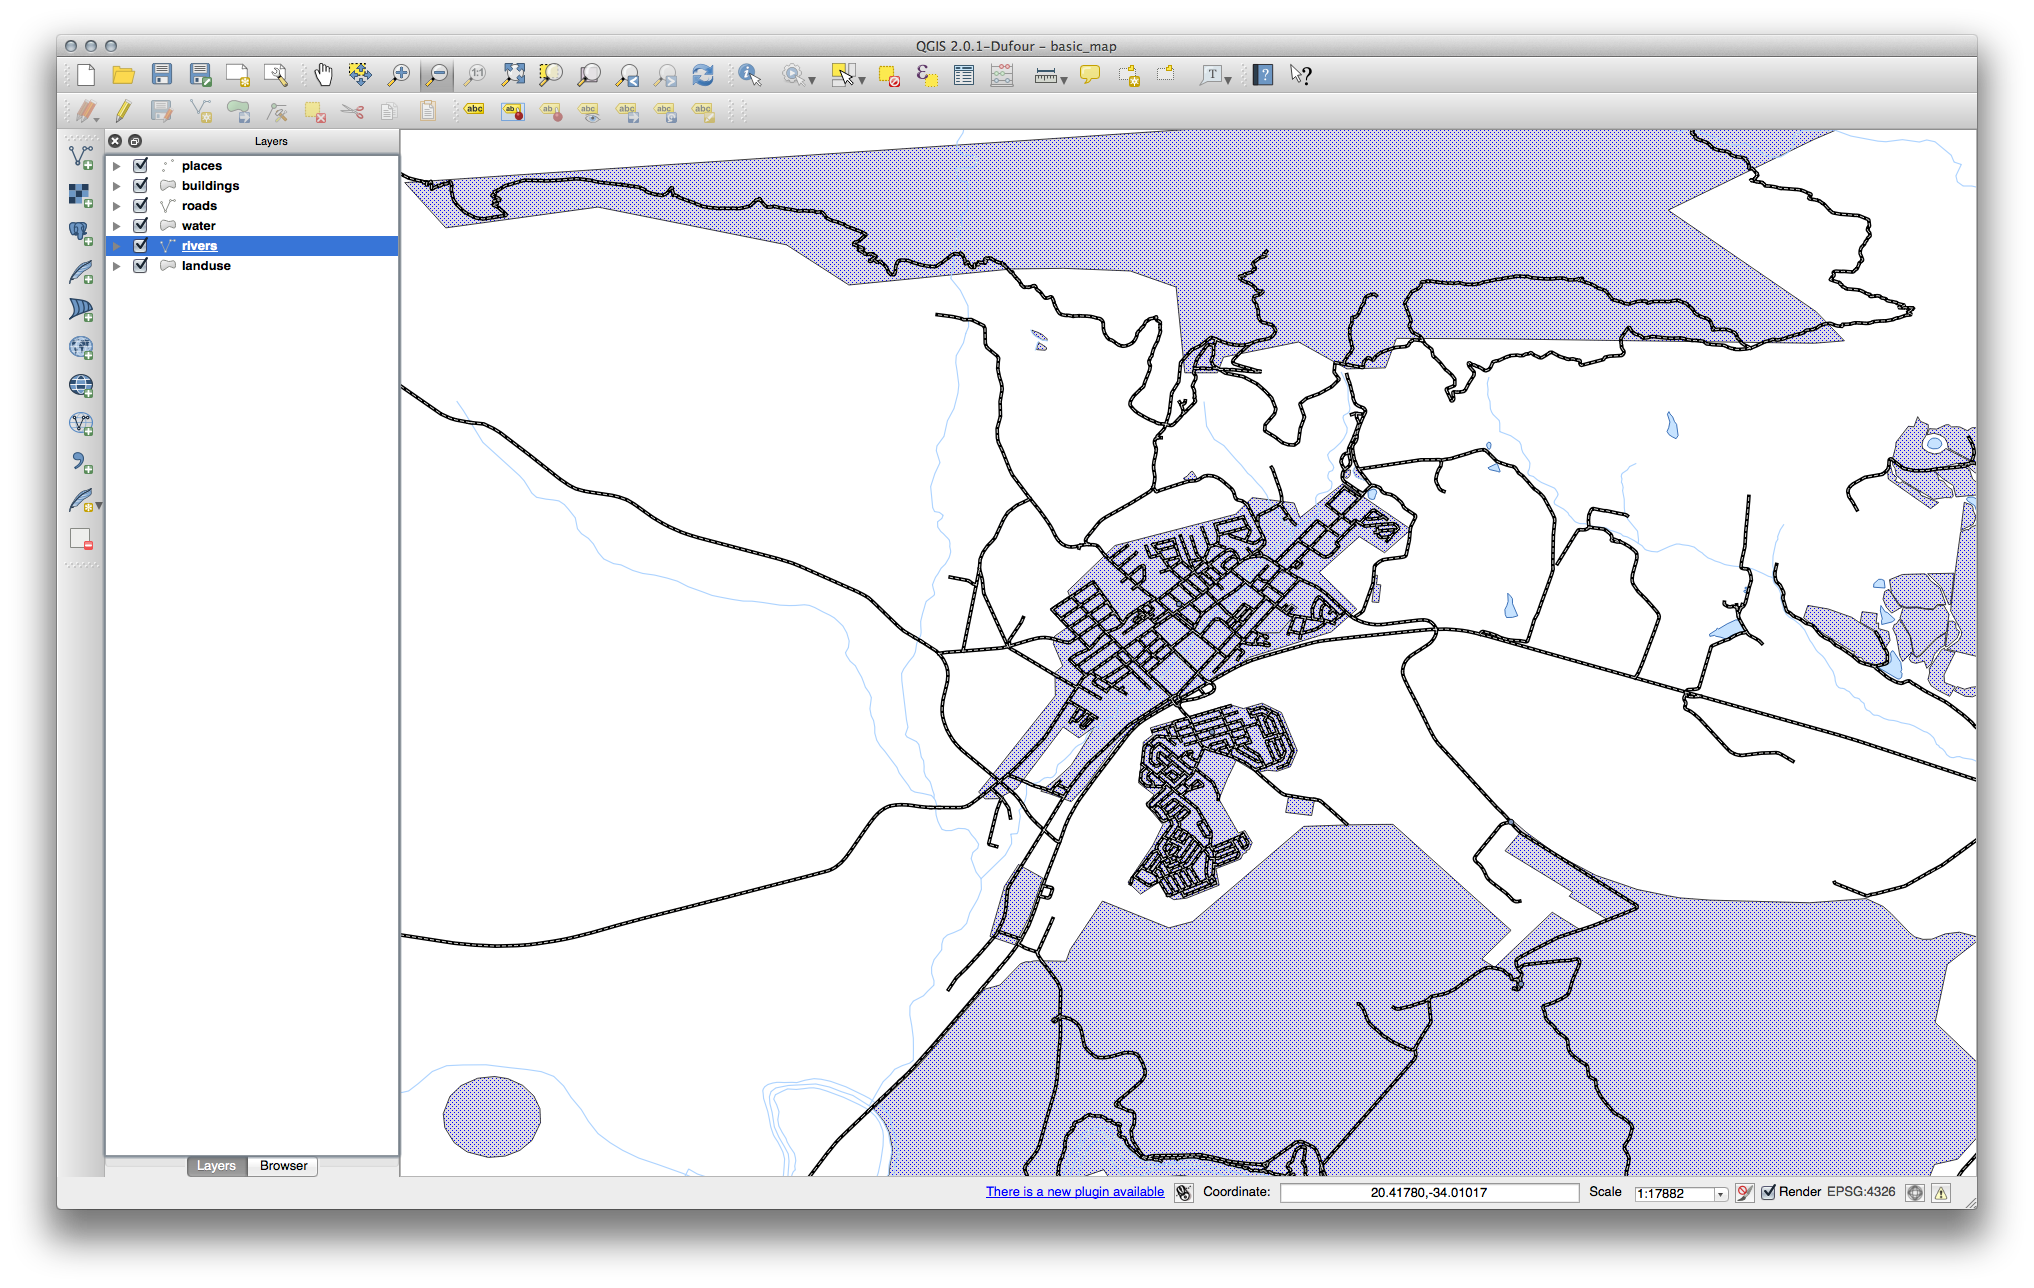
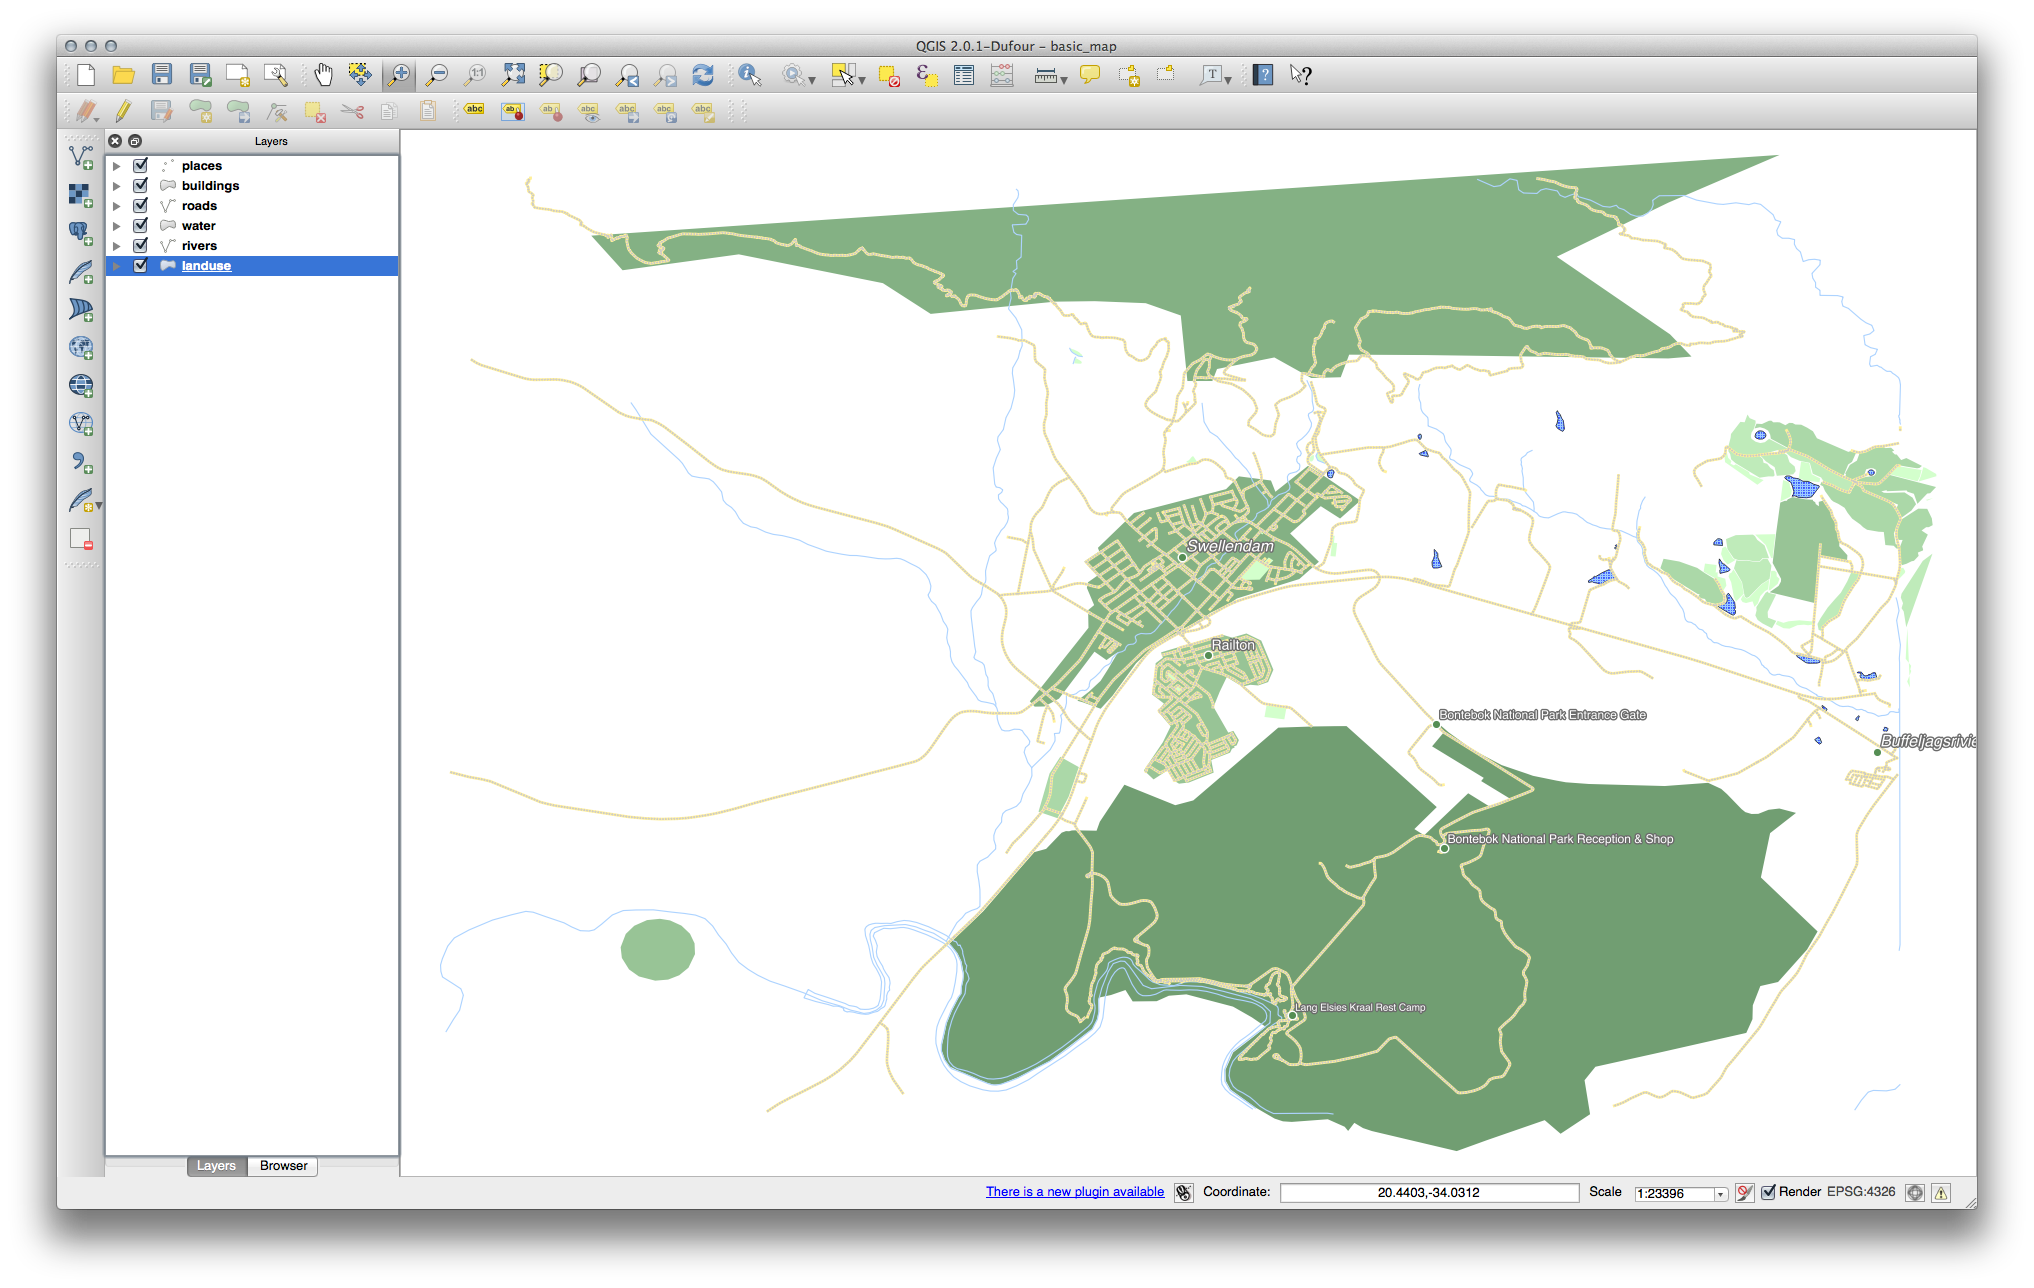
All the vector layers should be loaded into the map. It probably won’t look nice yet though (we’ll fix the ugly colors later).
21.4. Results For シンボル
21.4.1. 色
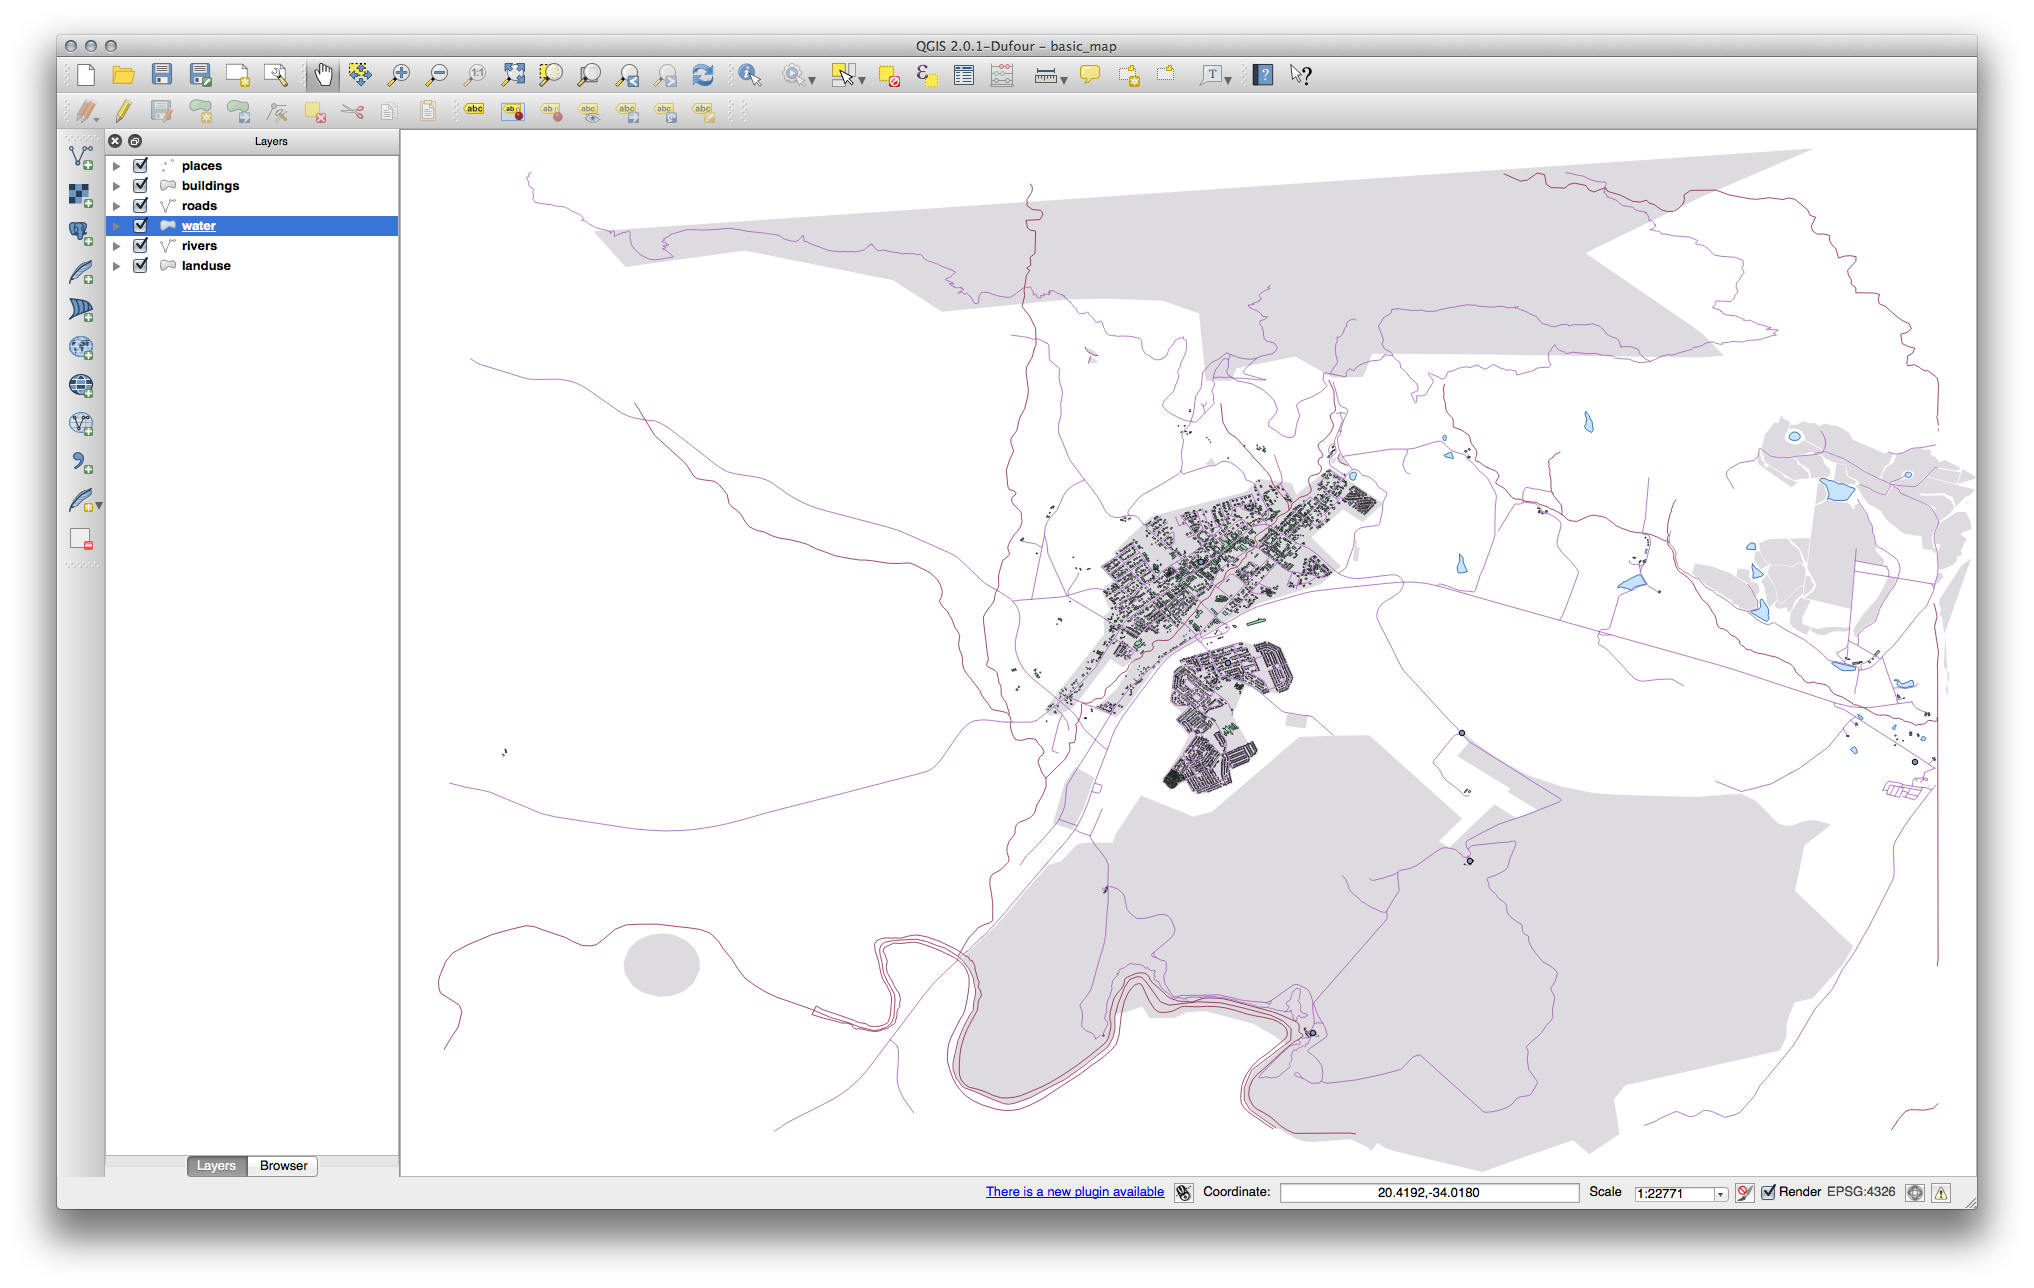
色が期待通りに変わっているか確認してください。
- It is enough to change only the water layer for now. An example is below, but may look different depending on the color you chose.
ノート
If you want to work on only one layer at a time and don’t want the other layers to distract you, you can hide a layer by clicking in the check box next to its name in the Layers list. If the box is blank, then the layer is hidden.
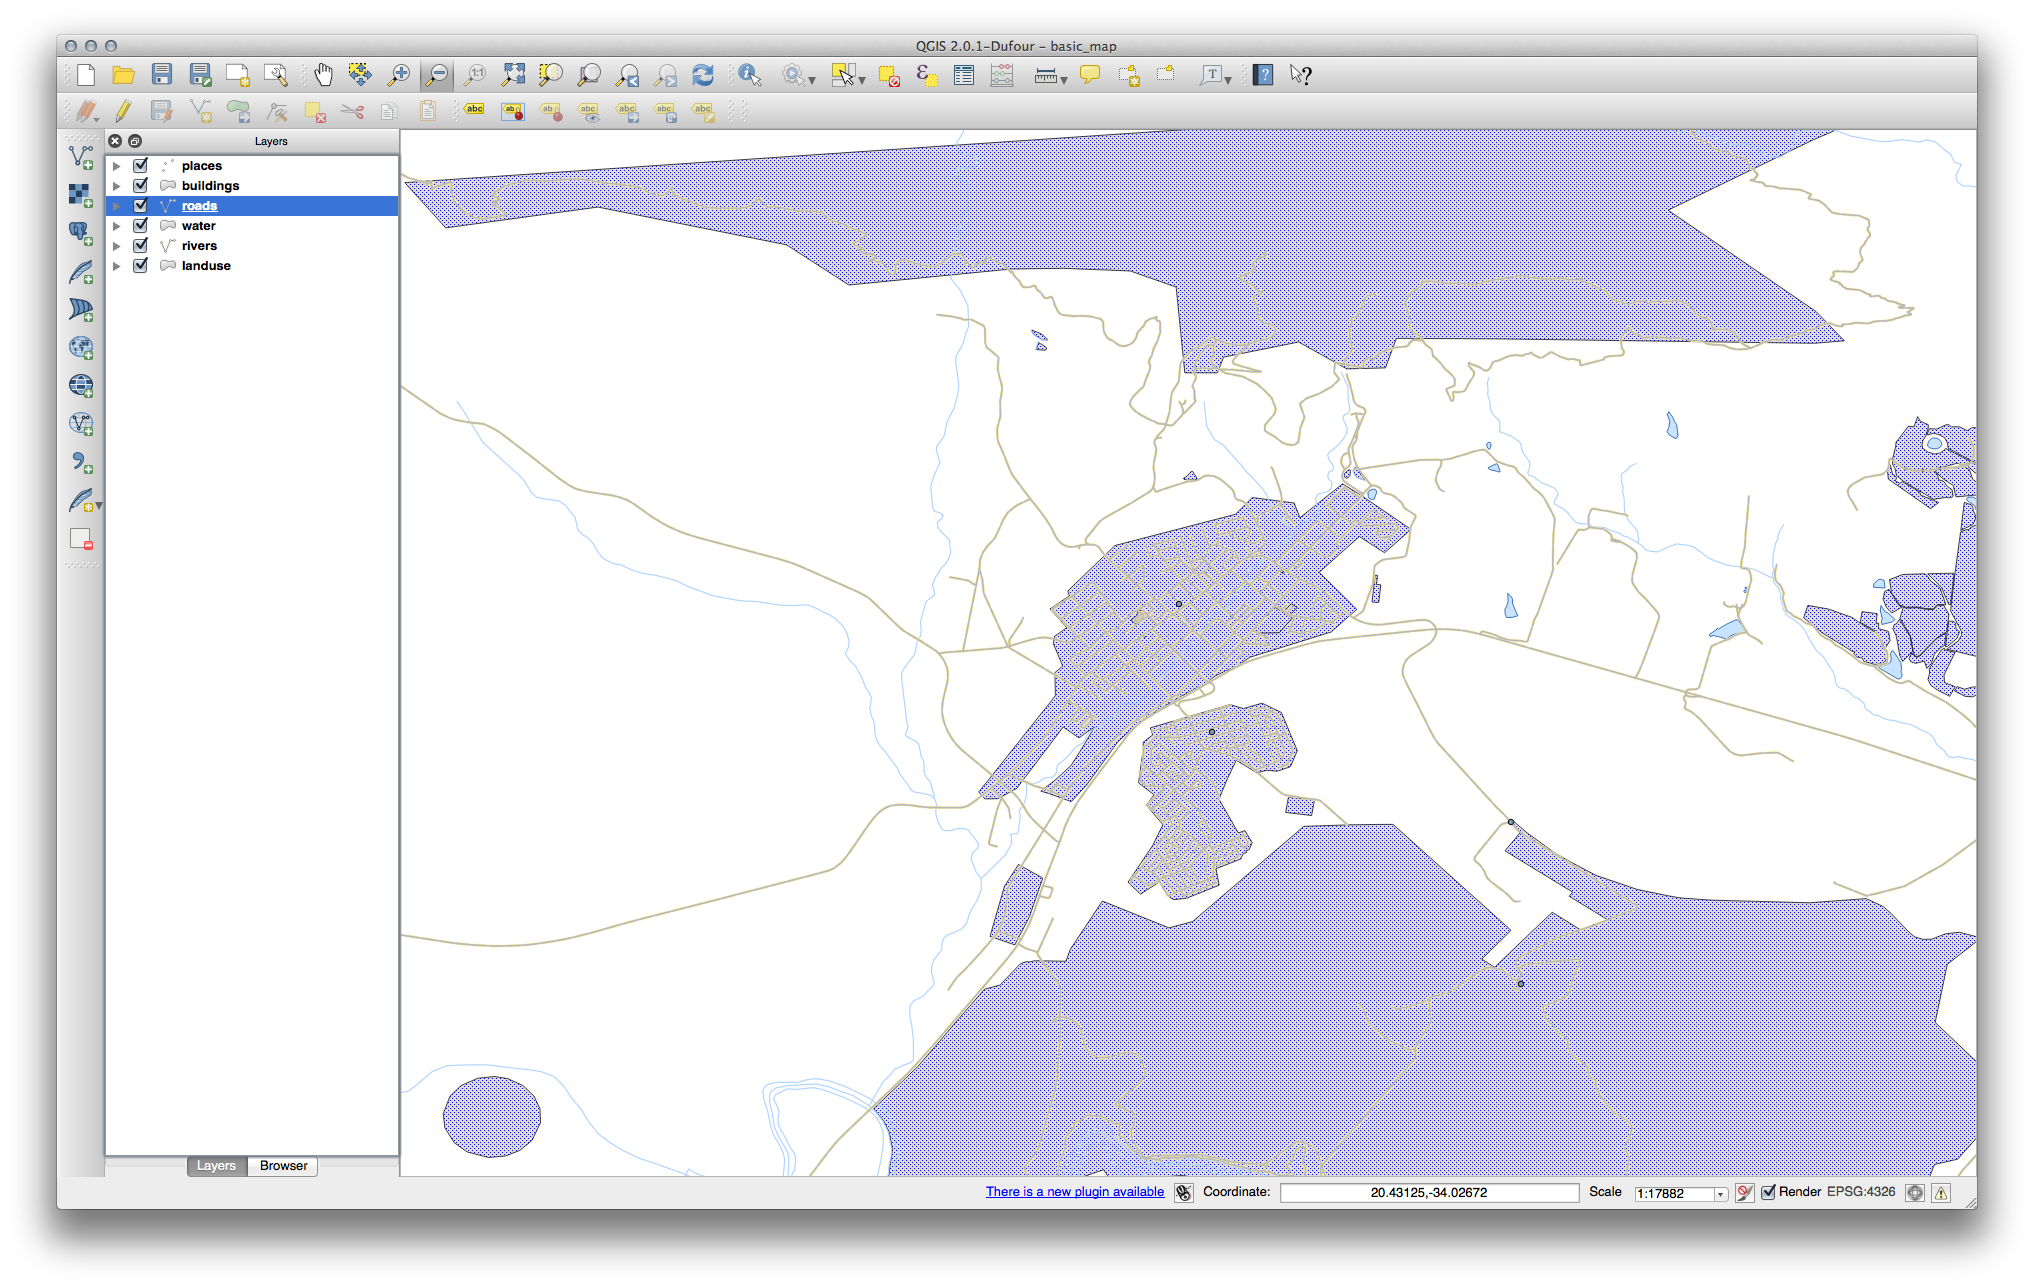
21.4.2. シンボルの構造
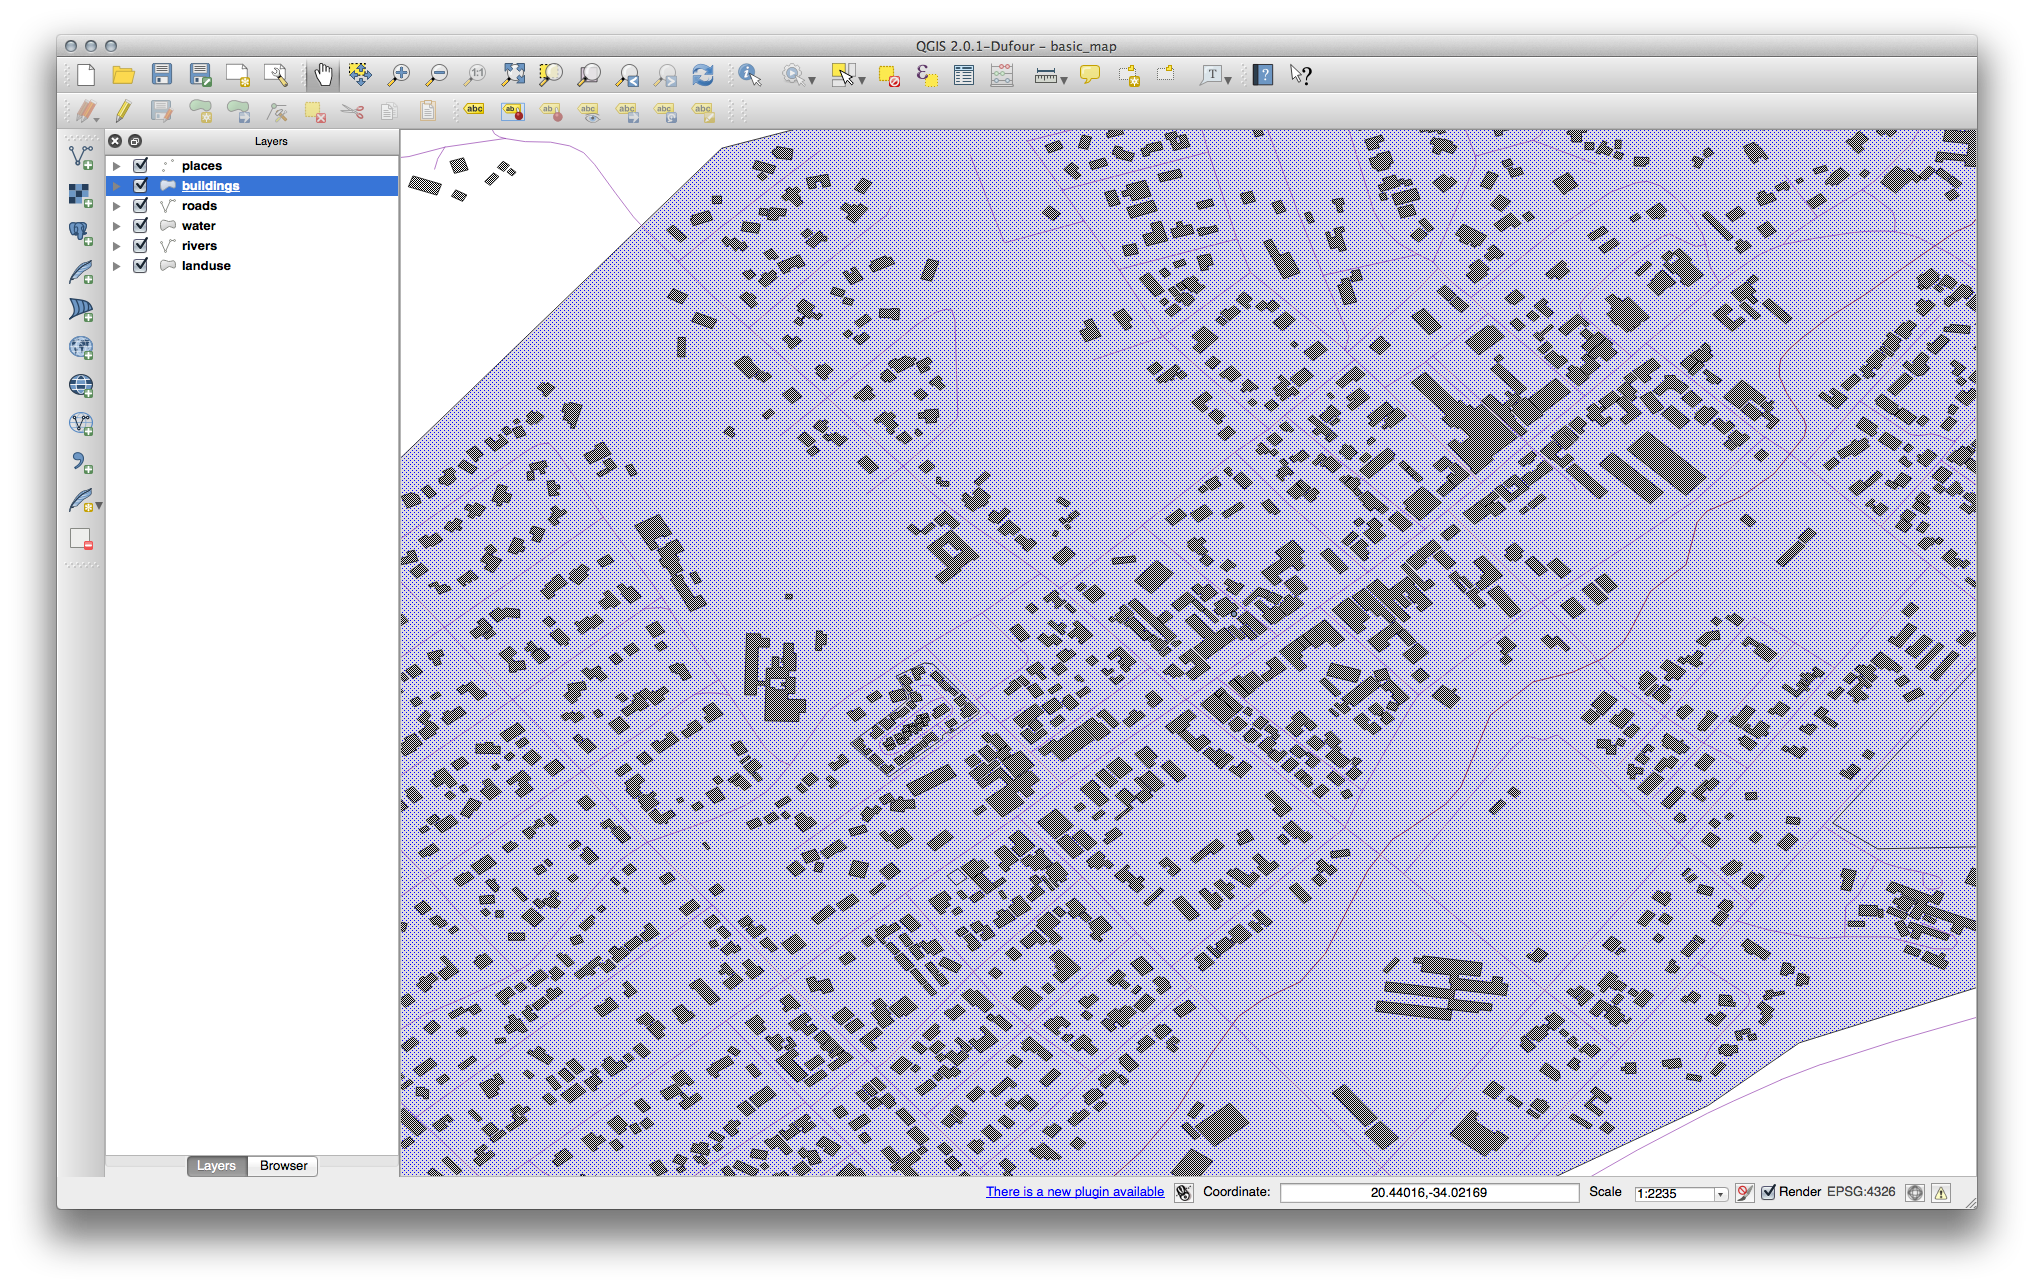
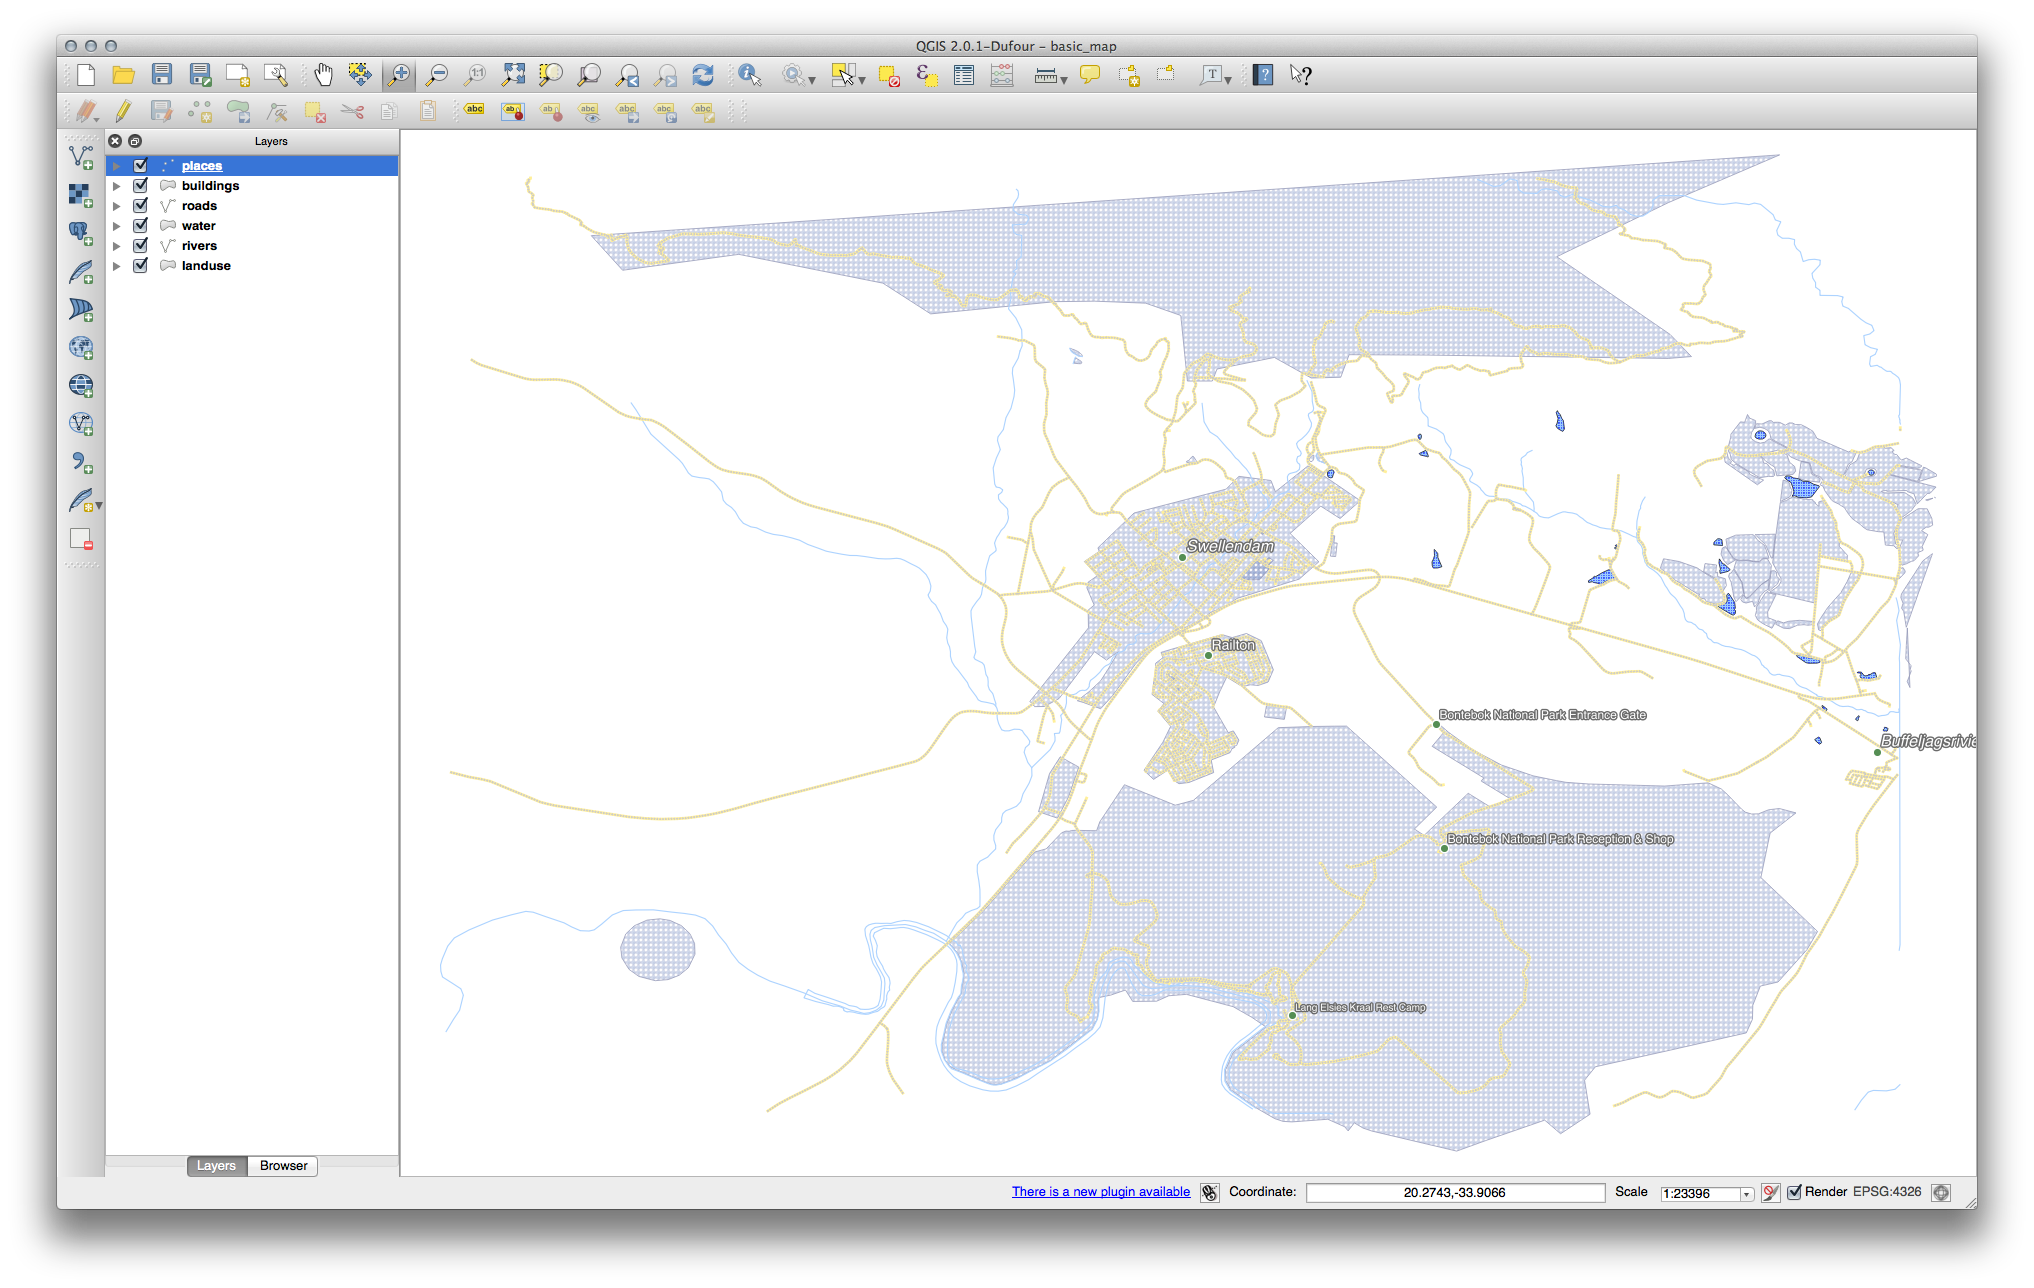
これであなたの地図はこのように見えていると思います:
あなたが初心者レベルのユーザーであれば、ここで止めた方が良いかもしれません。
上の方法を使って残りのレイヤーすべての色とスタイルを変更します。
オブジェクトにはできるだけ本来の色を使うようにしてください。たとえば、道路は赤や青ではなく、灰または黒であるべきです。
- Also feel free to experiment with different Fill Style and Border Style settings for the polygons.
21.4.4.  シンボルのレベル
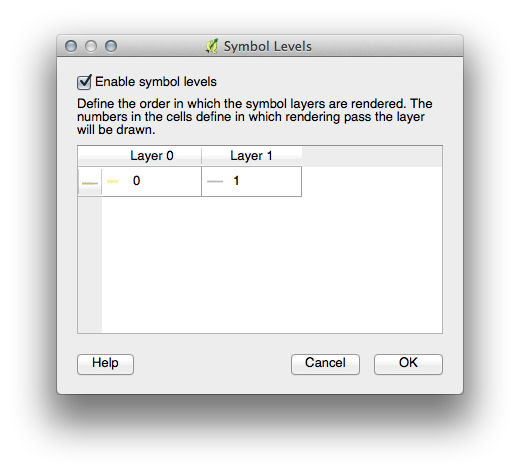
To make the required symbol, you need two symbol layers:
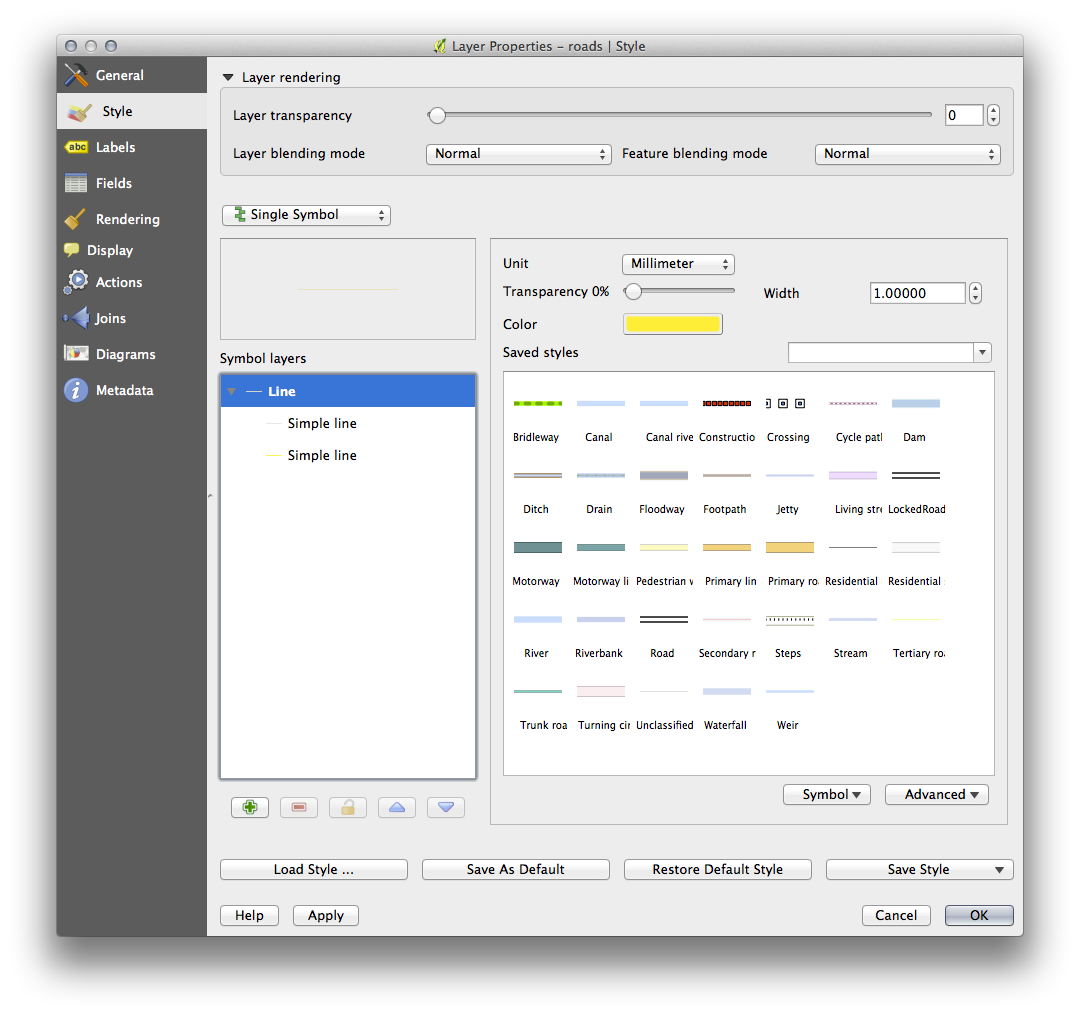
The lowest symbol layer is a broad, solid yellow line. On top of it there is a slightly thinner solid gray line.
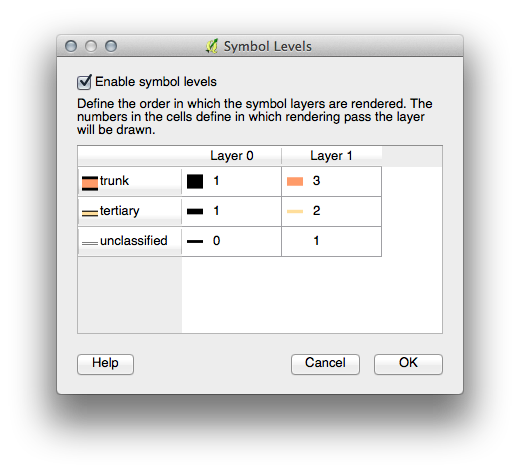
If your symbol layers resemble the above but you’re not getting the result you want, check that your symbol levels look something like this:
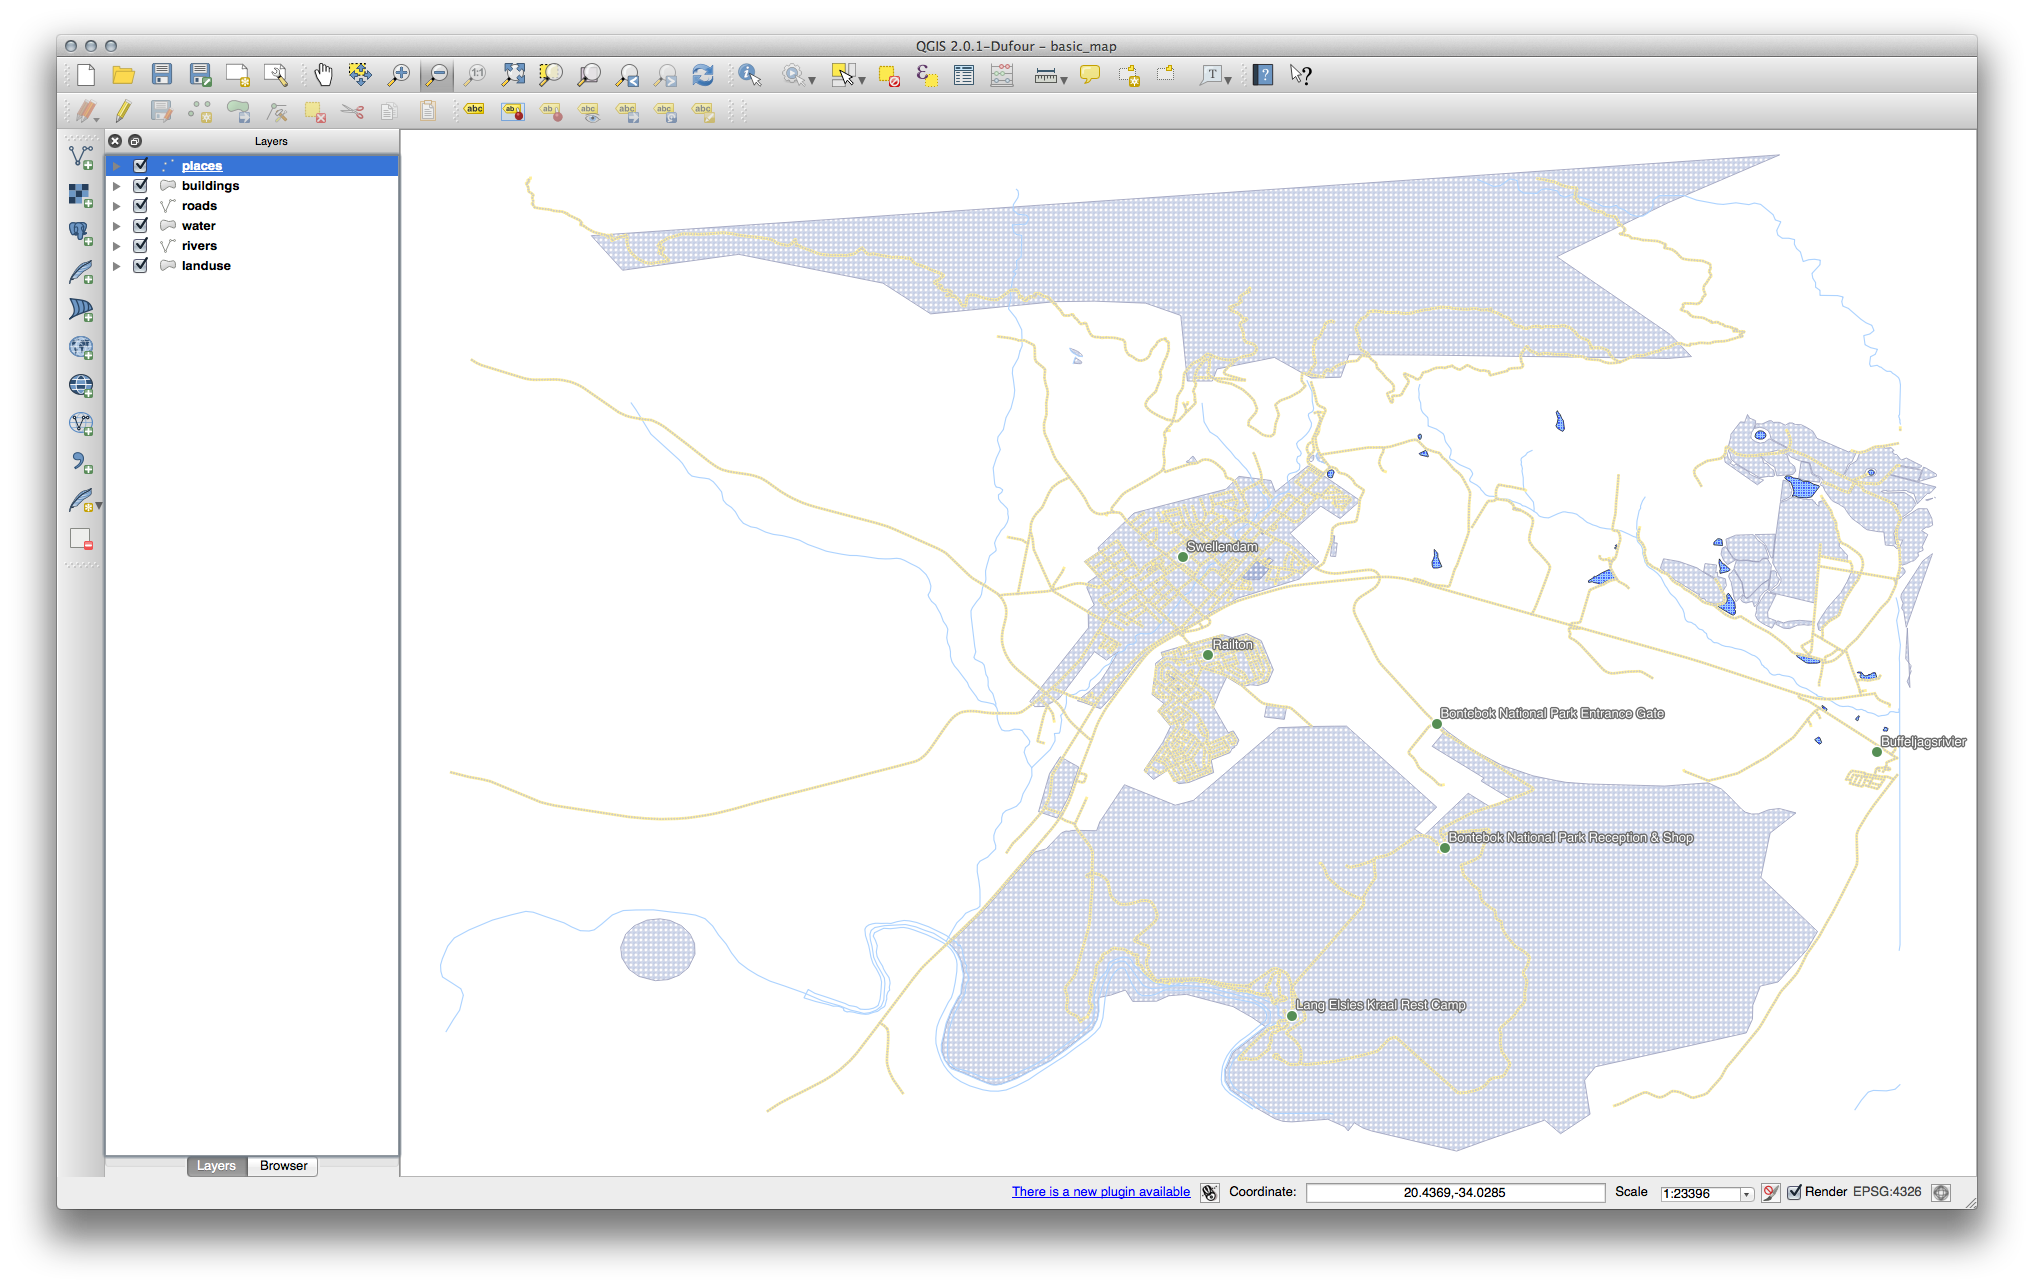
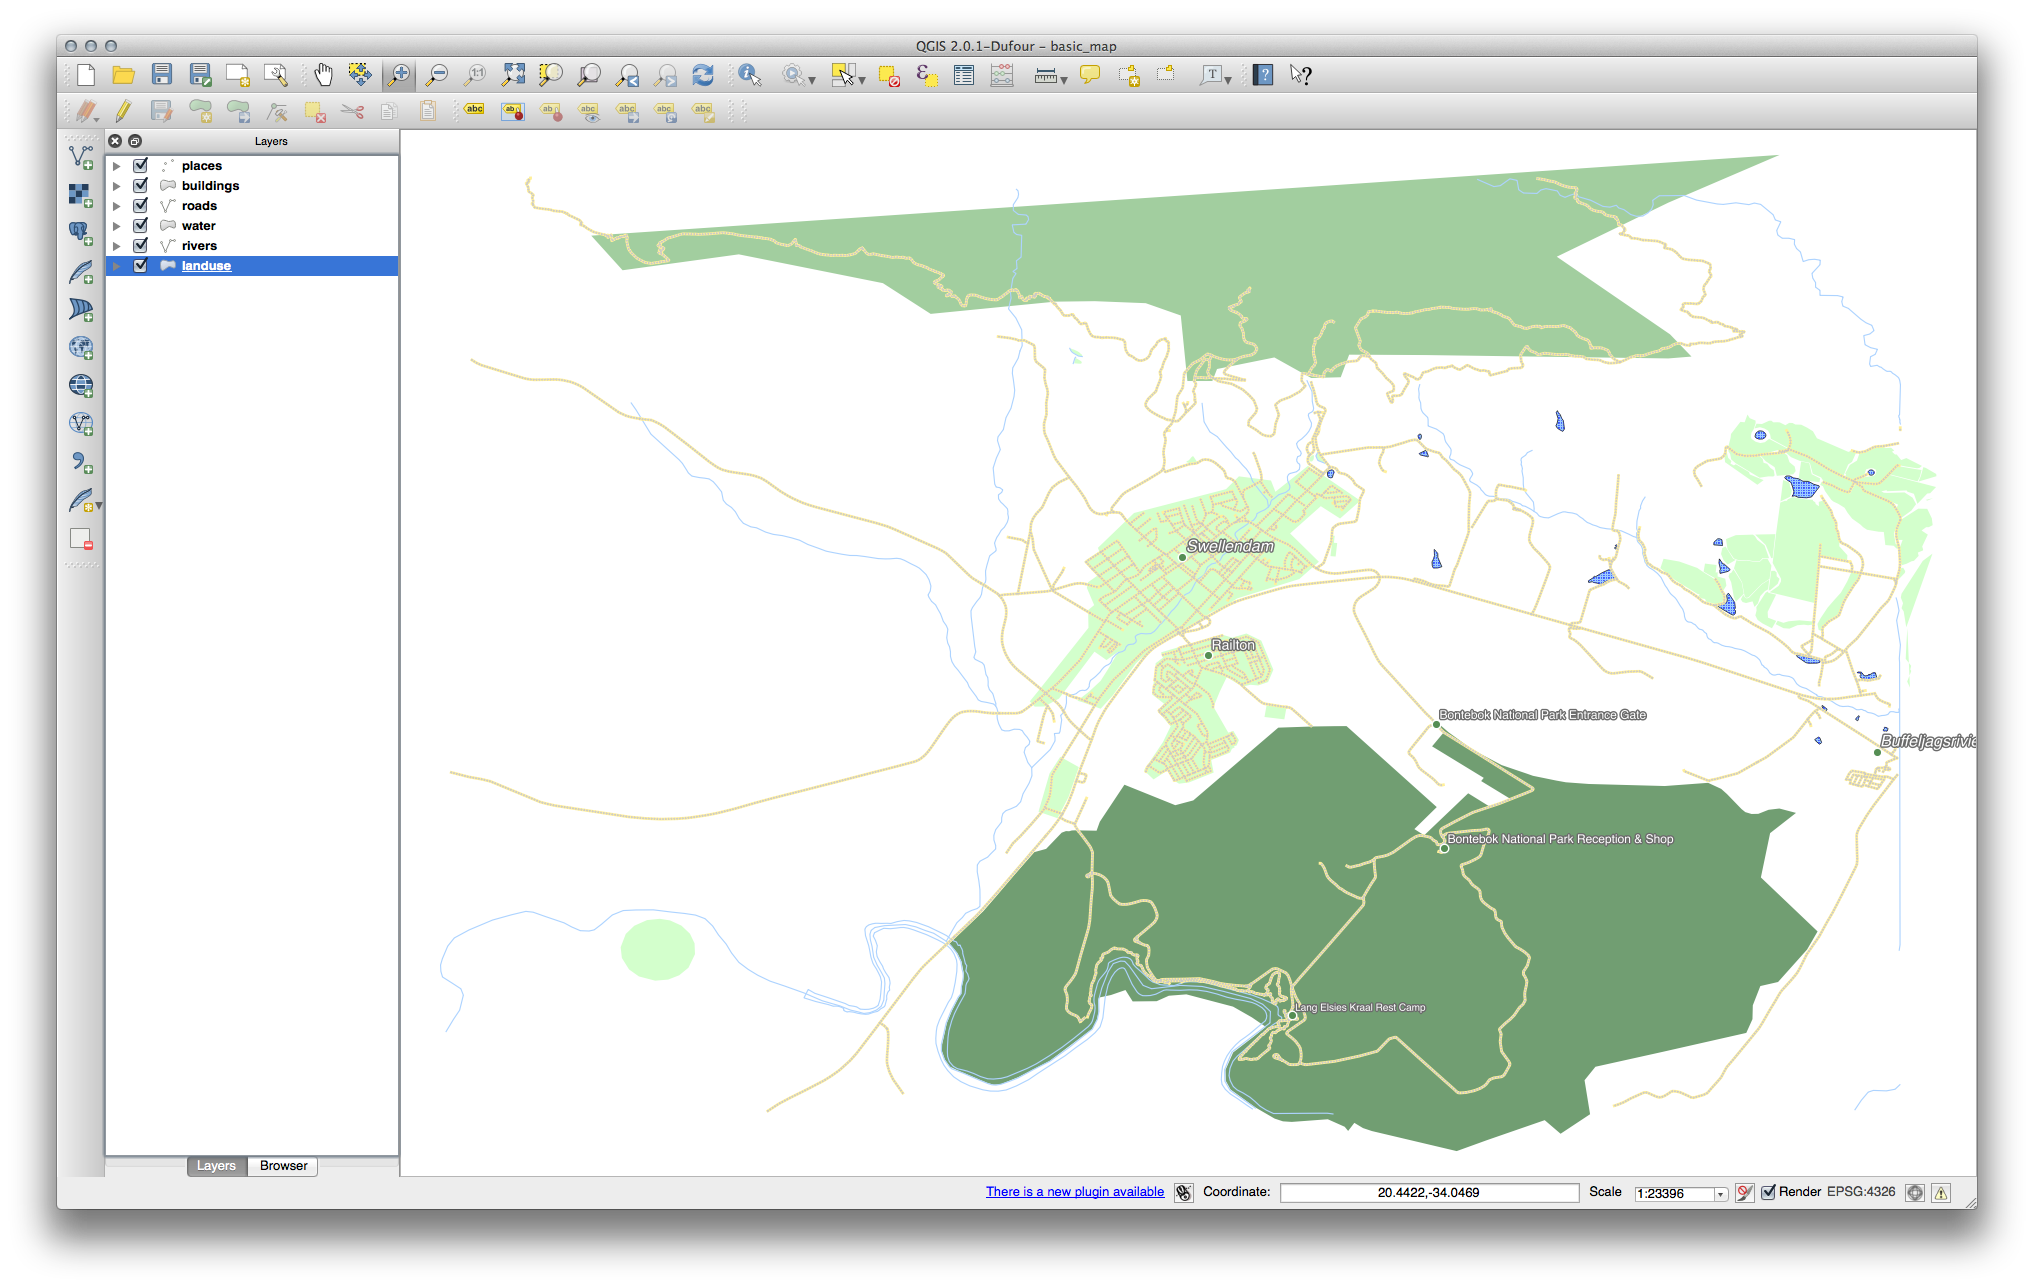
これであなたの地図は次のように見えるようになったはずです:
21.5. Results For 属性データ
21.6. Results For ラベルツール
21.6.1. ラベルのカスタマイズ (パート 1)
今、地図はマーカー・ポイントを示さなければならず、ラベルは 2.0 mm だけオフセットされなければなりません:マーカーとラベルのスタイルは、両方が地図上ではっきりと見えることを可能にする必要があります。
21.6.2. ラベルのカスタマイズ (パート 2)
一つの可能な解ではこの最終製品があります:

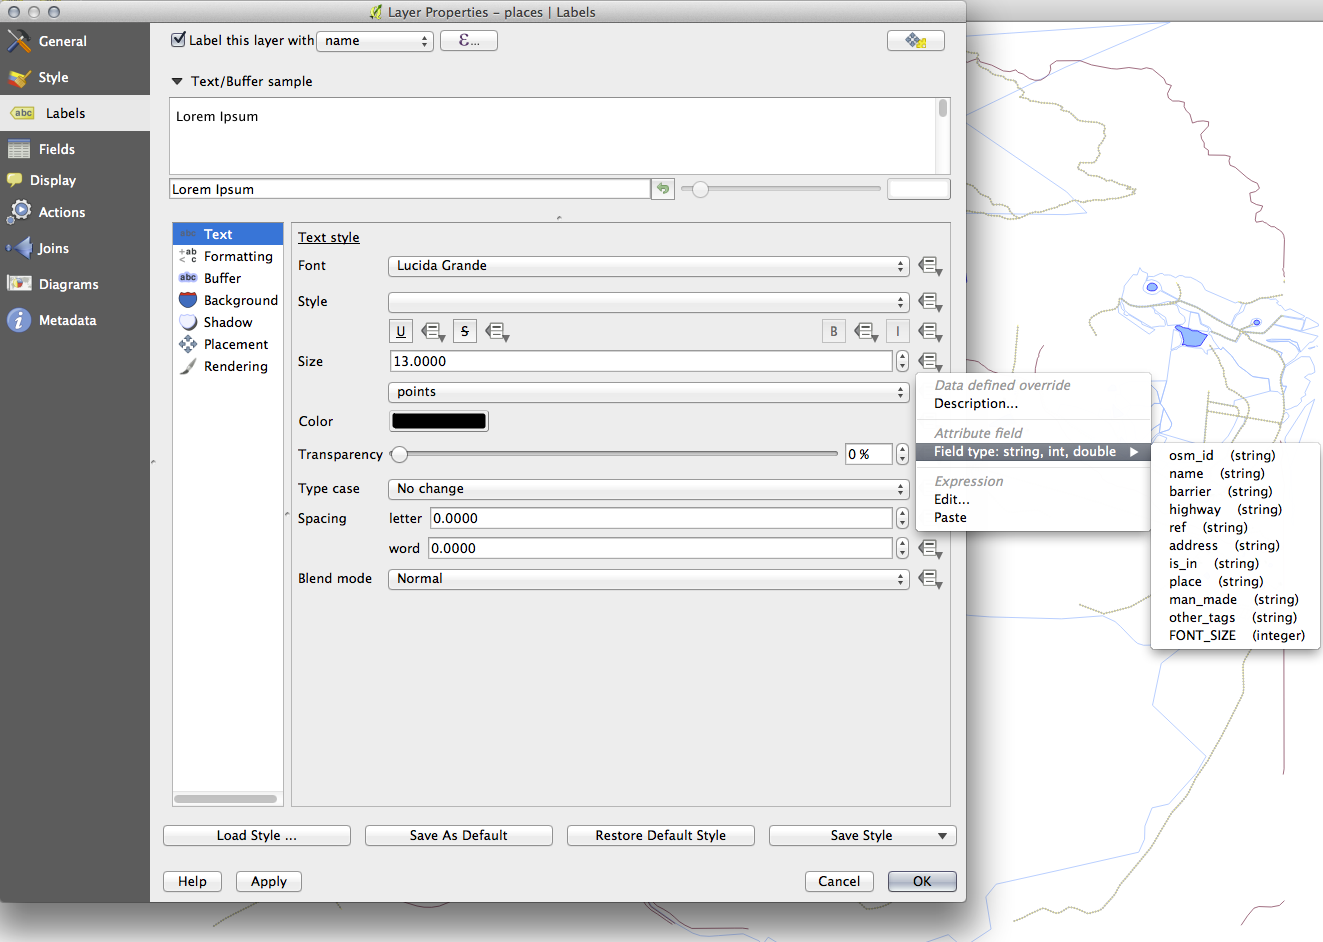
この結果に到着するには:
フォントサイズ 10 、 ラベル距離 1.5 mm 、 シンボル幅 と シンボルサイズ 3.0 mm を使用します。
さらに、この例では characterラベルをラップ オプションを使用します。
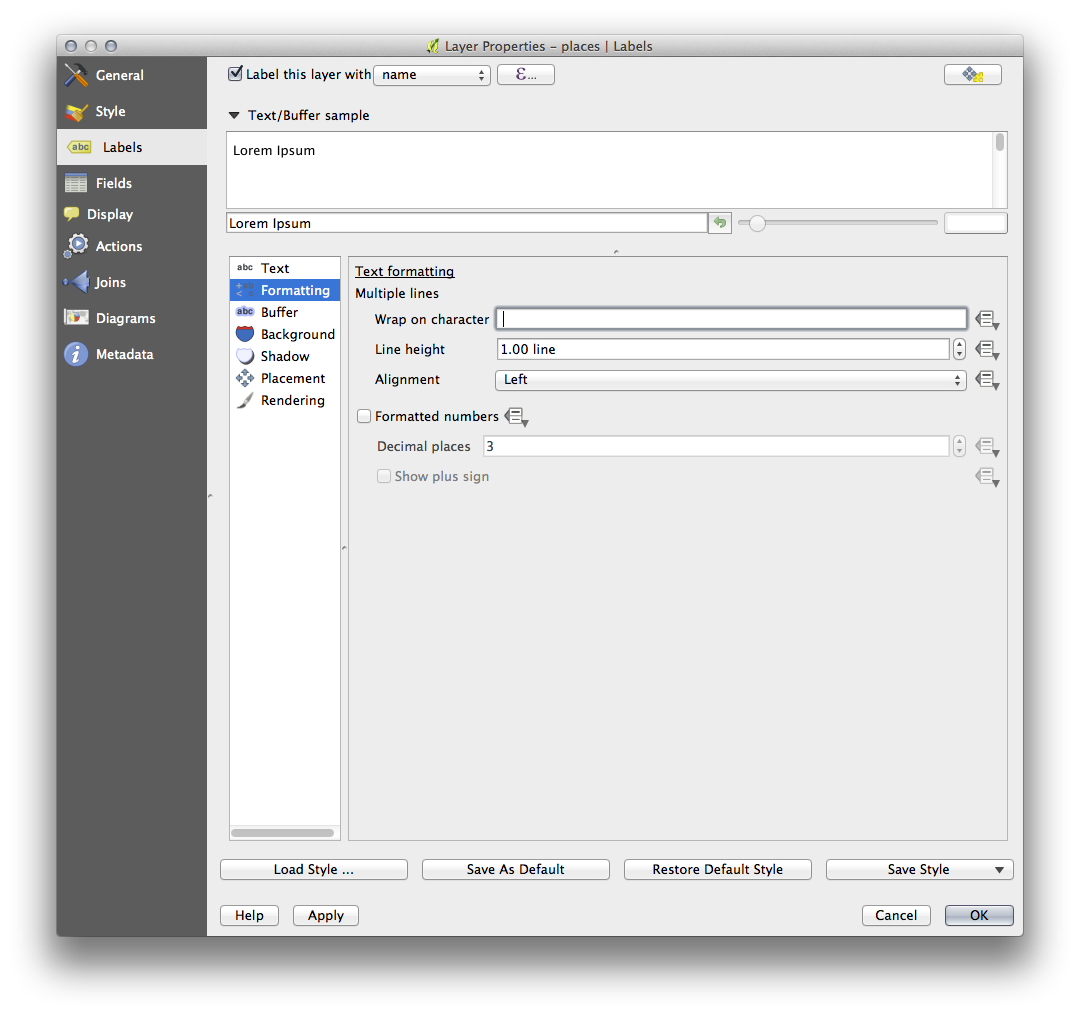
このフィールドに space と入力し 適用 をクリックして、同じ効果を達成します。この場合には、地名の一部は非常に長く、その結果複数の行を持つ名前で、非常にユーザーに優しくはありません。この設定が自分の地図にとってより適切と見つけるかもしれません。
21.7. Results For 分類
21.8. Results For 新しいベクターデータセットを作成する
21.8.2. トポロジ: リングツールを追加
正確な形状は重要ではありませんが、あなたの地物の中央には穴が空くことになります。こちらのように。
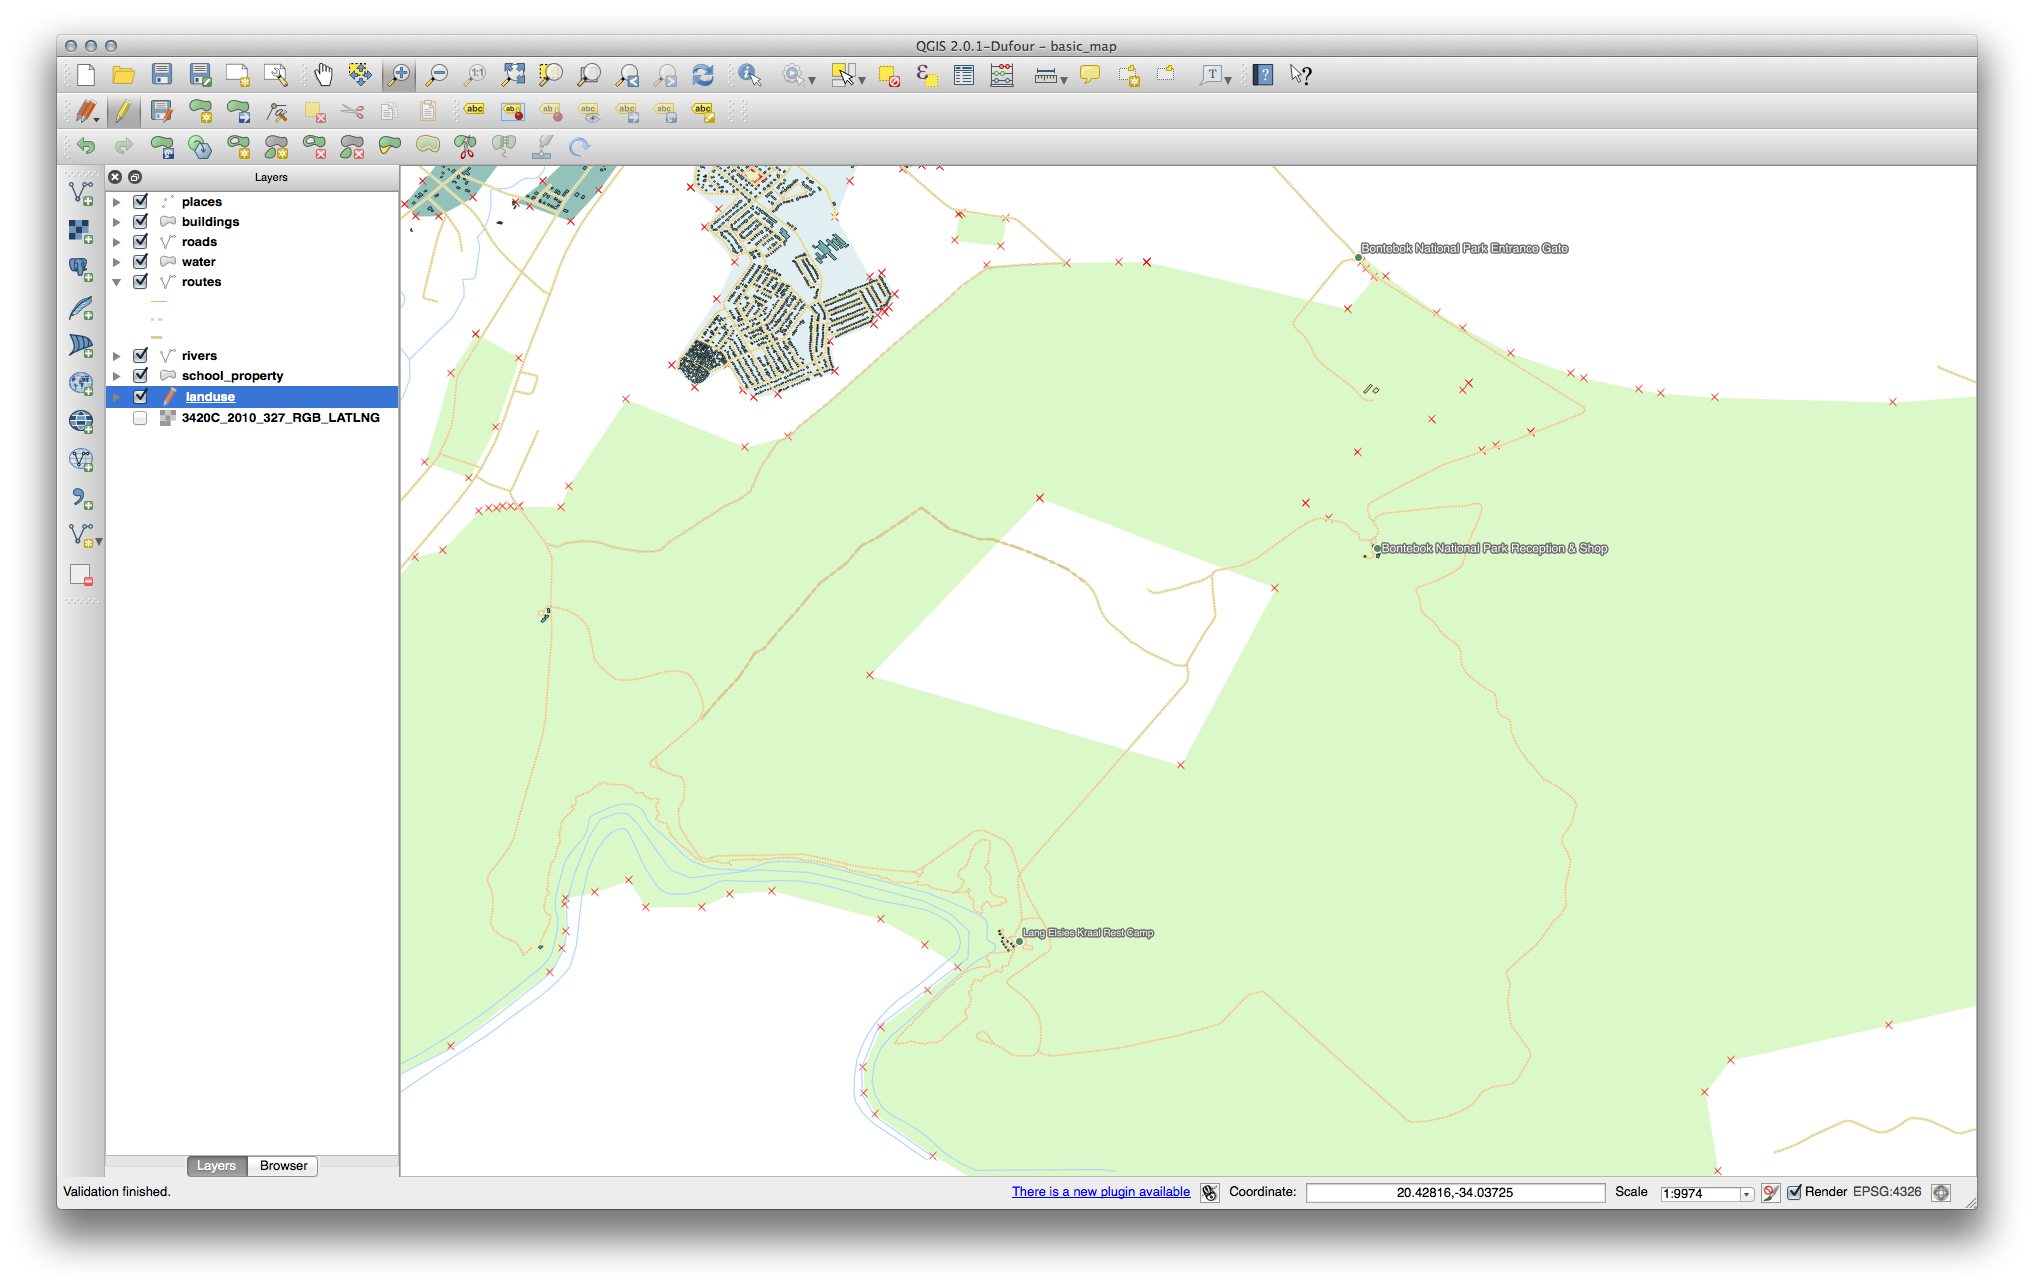
次のツールのための演習を続行する前に編集を取り消します。
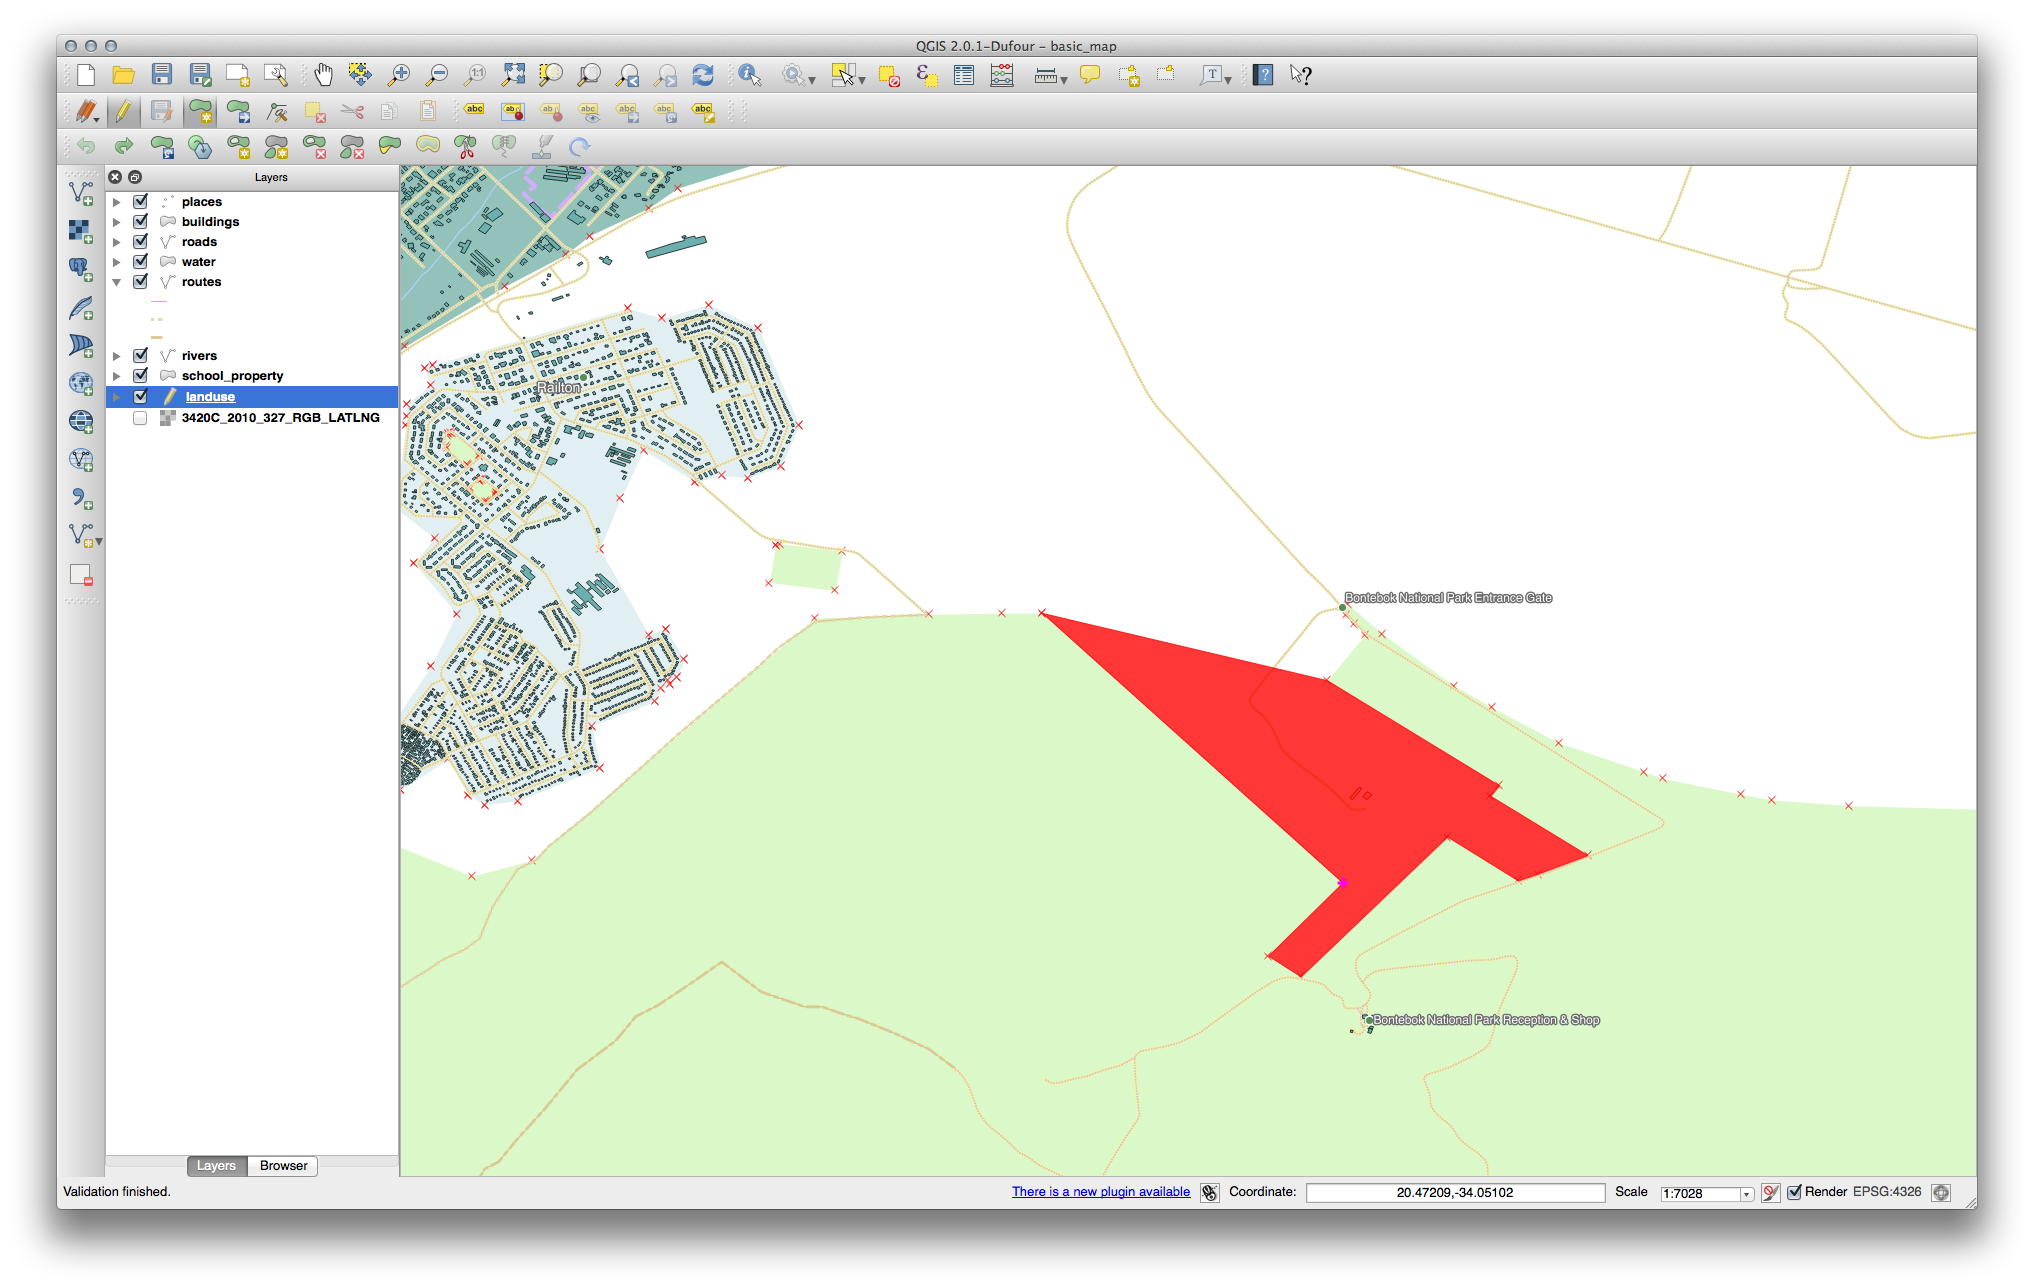
21.8.3. トポロジ: パートを追加ツール
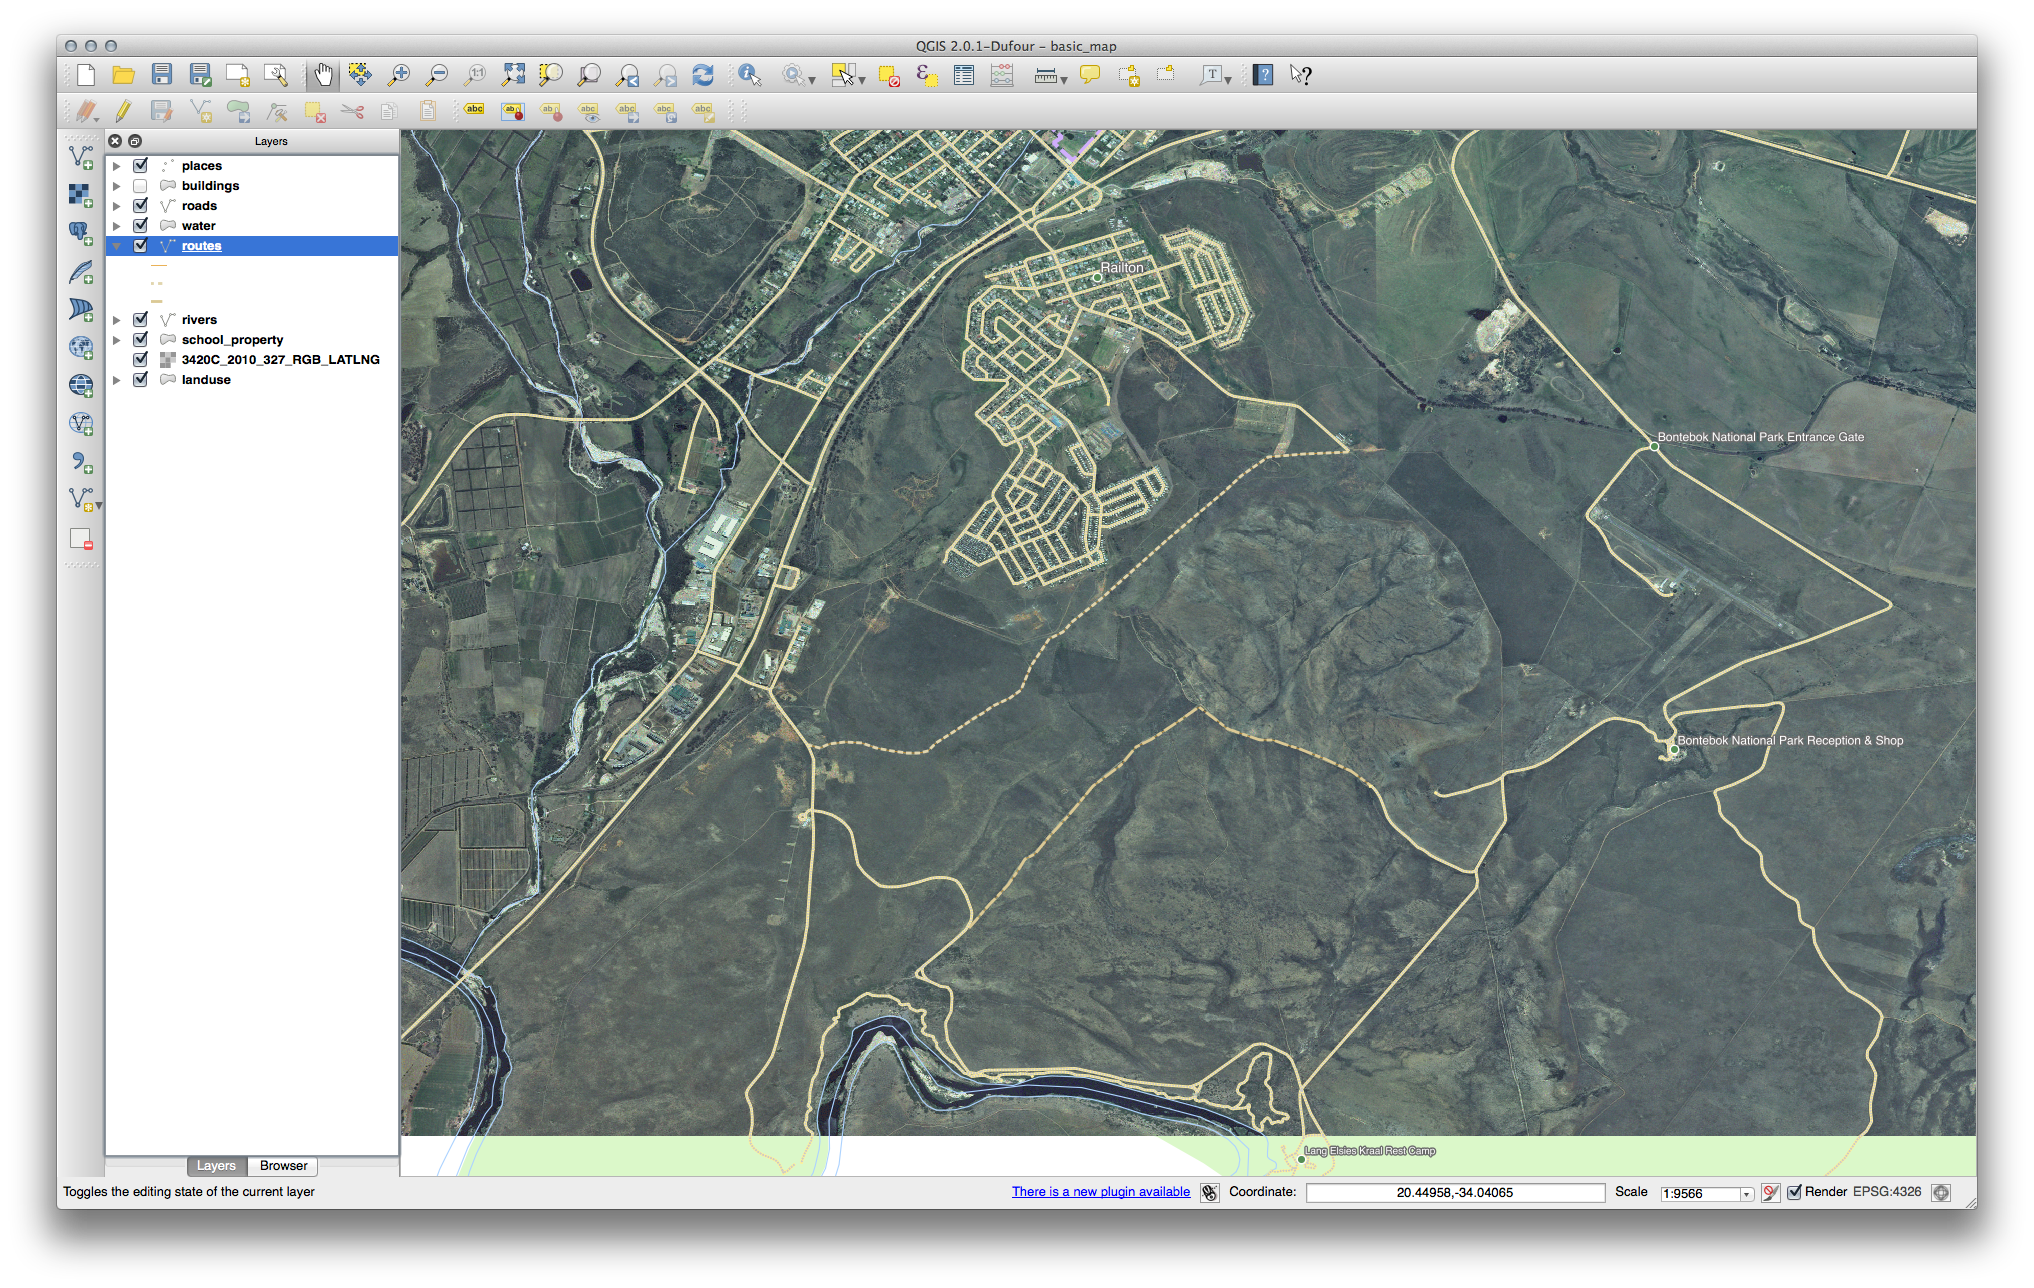
最初に Bontebok National Park を選択します:
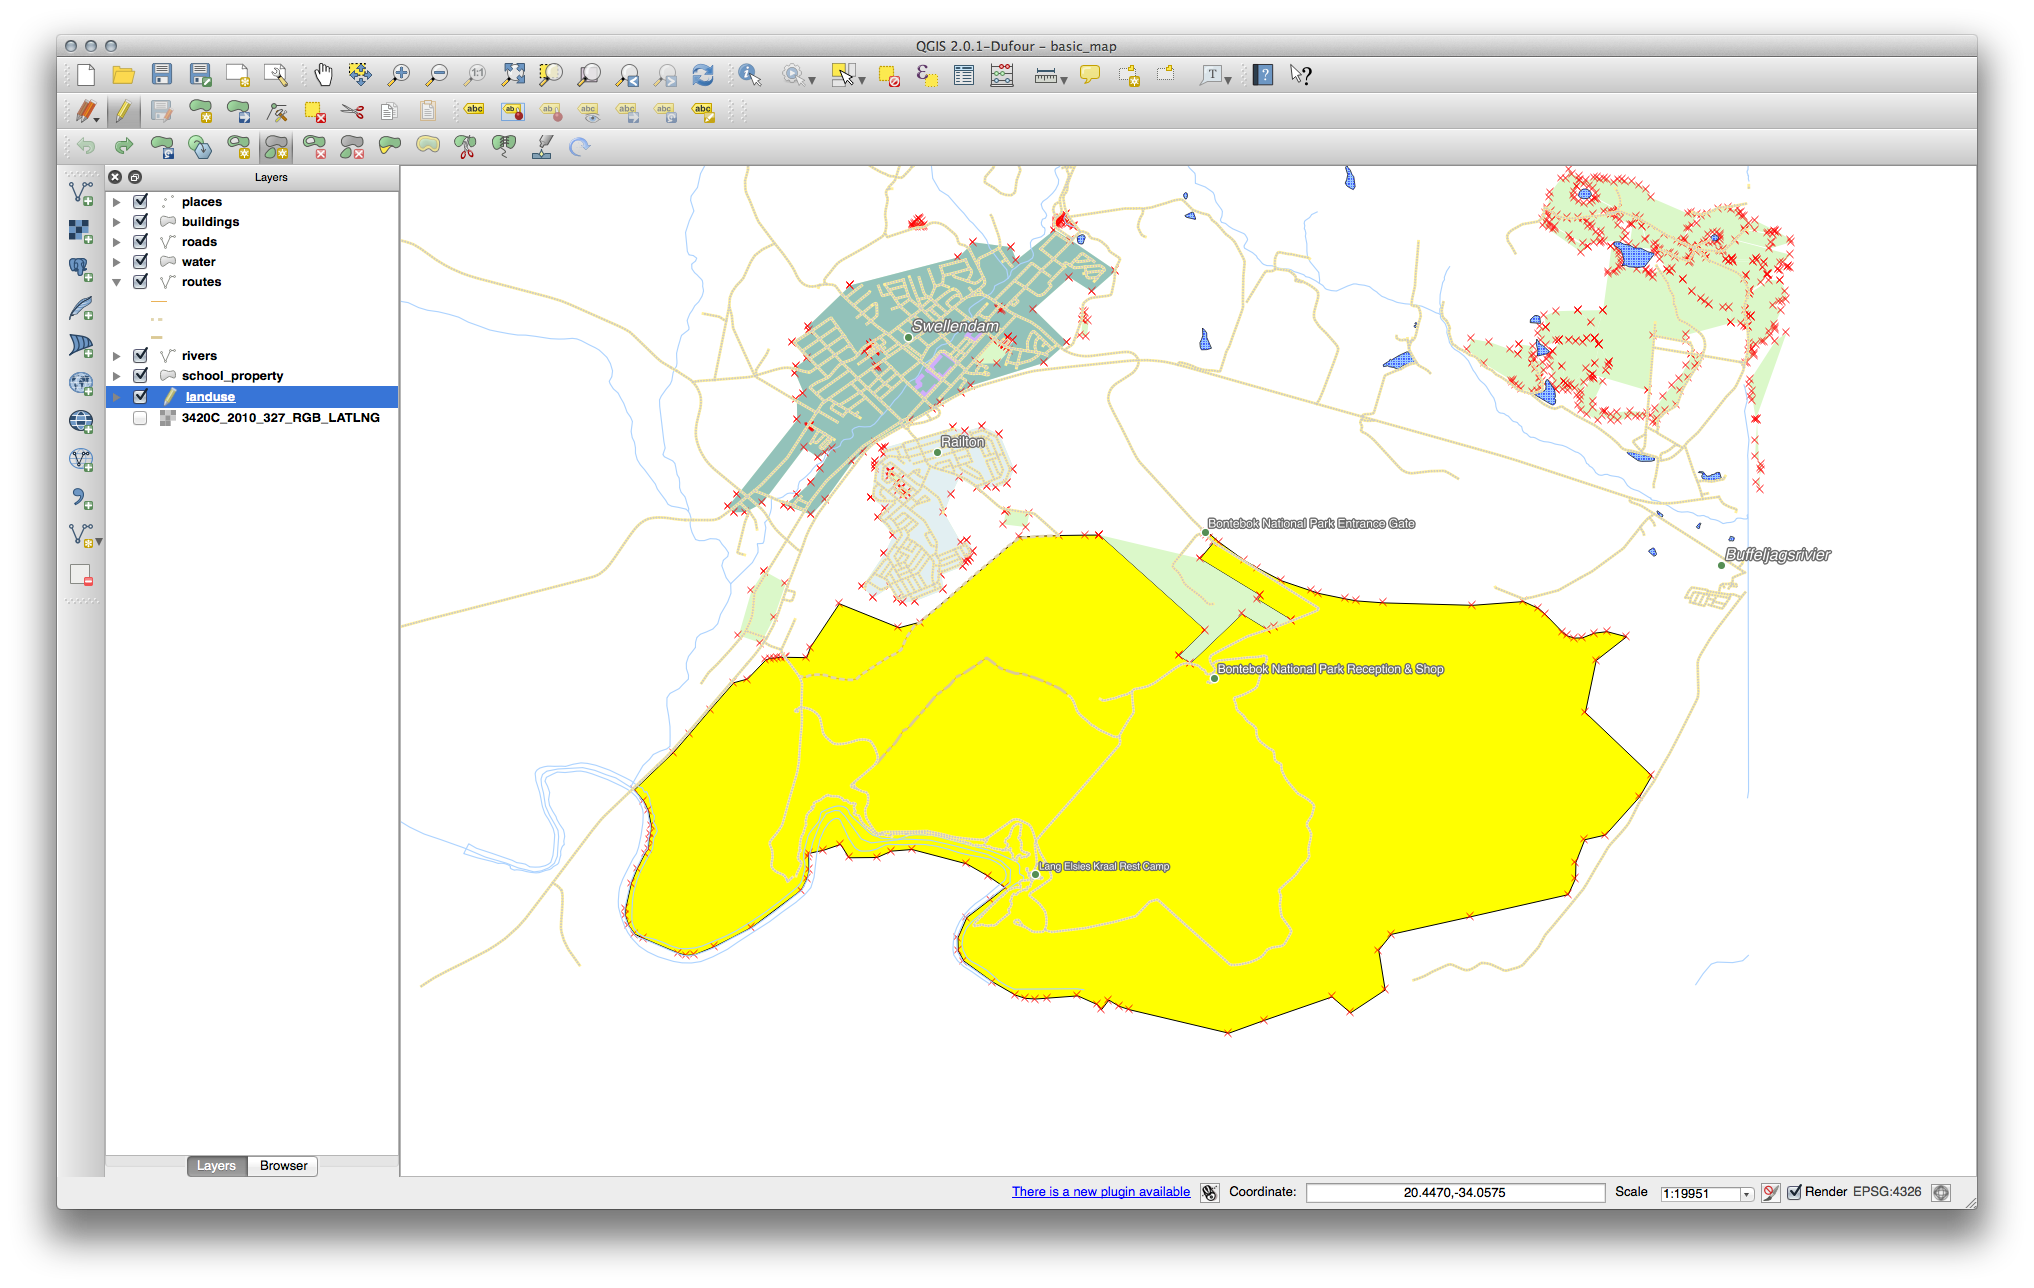
ここで新しいパートを追加します:
次のツールのための演習を続行する前に編集を取り消します。
21.8.4.  地物をマージ
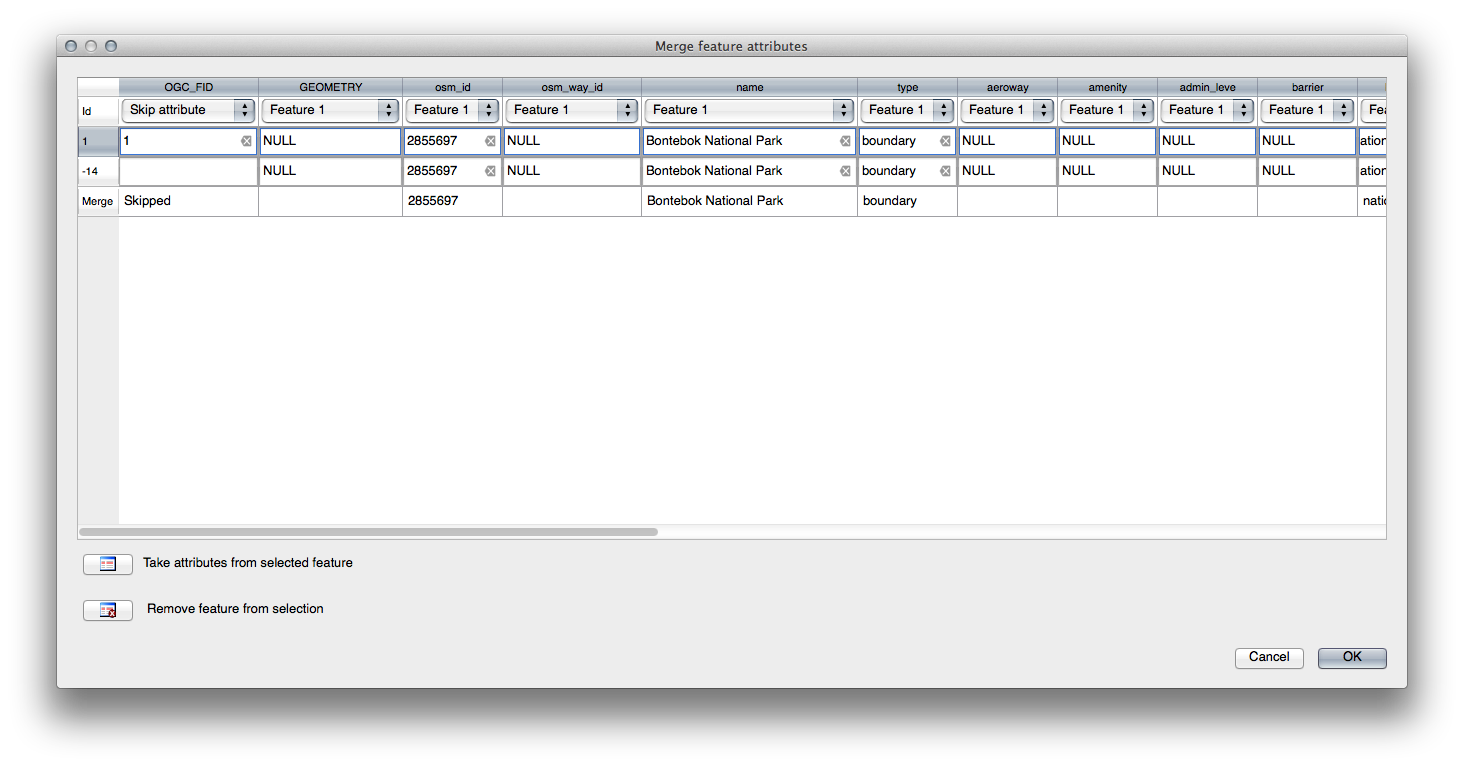
選択した地物のマージ ツールを使う際には、最初にマージしたいポリゴンを両方選んでください。
1 の属性の OGC_FID を持つ地物をソースとして使用します(ダイアログでそのエントリをクリックし、それから 選択地物から属性を取る ボタンをクリックしてください):
ノート
- 別のデータセットを使用している場合、可能性が高いのはあなたの
元々のポリゴンの OGC_FID は 1 にはならないでしょう。 OGC_FID を持っている地物だけを選択してください。
ノート
選択地物の属性をマージ ツールを使用すると、ジオメトリは別々のまま、それらに同じ属性を与えます。
21.9. Results For ベクター分析
21.9.1. Extract Your Layers from OSM Data
For the purpose of this exercise, the OSM layers which we are interested in are multipolygons and lines. The multipolygons layer contains the data we need in order to produce the houses, schools and restaurants layers. The lines layer contains the roads dataset.
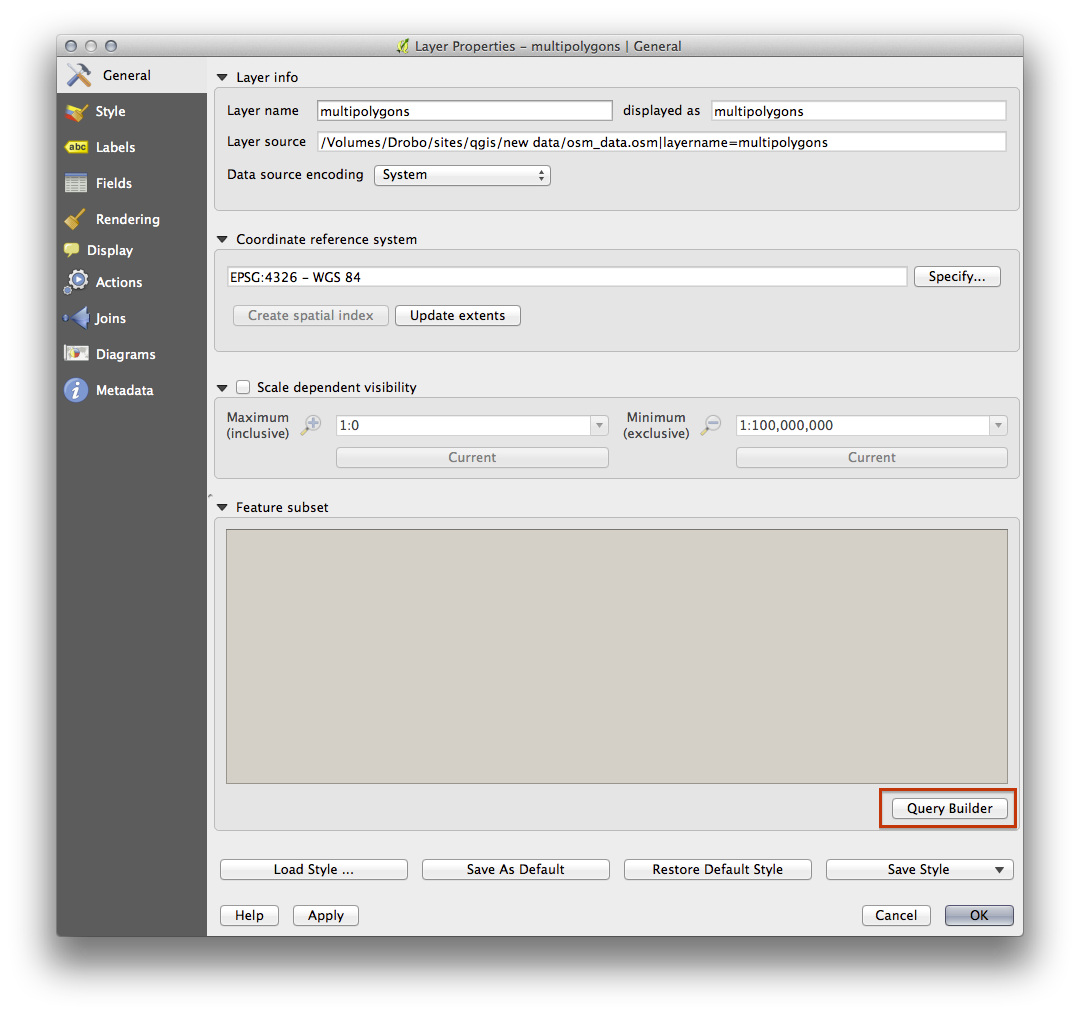
The Query Builder is found in the layer properties:
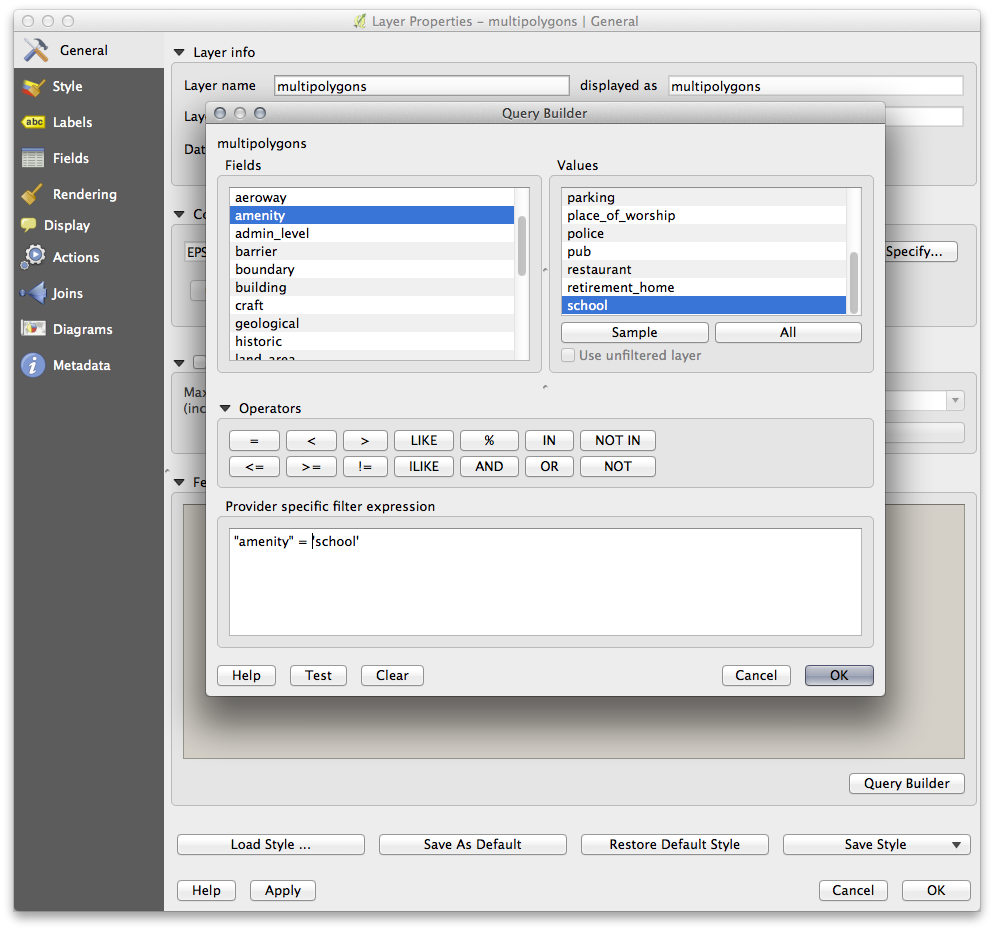
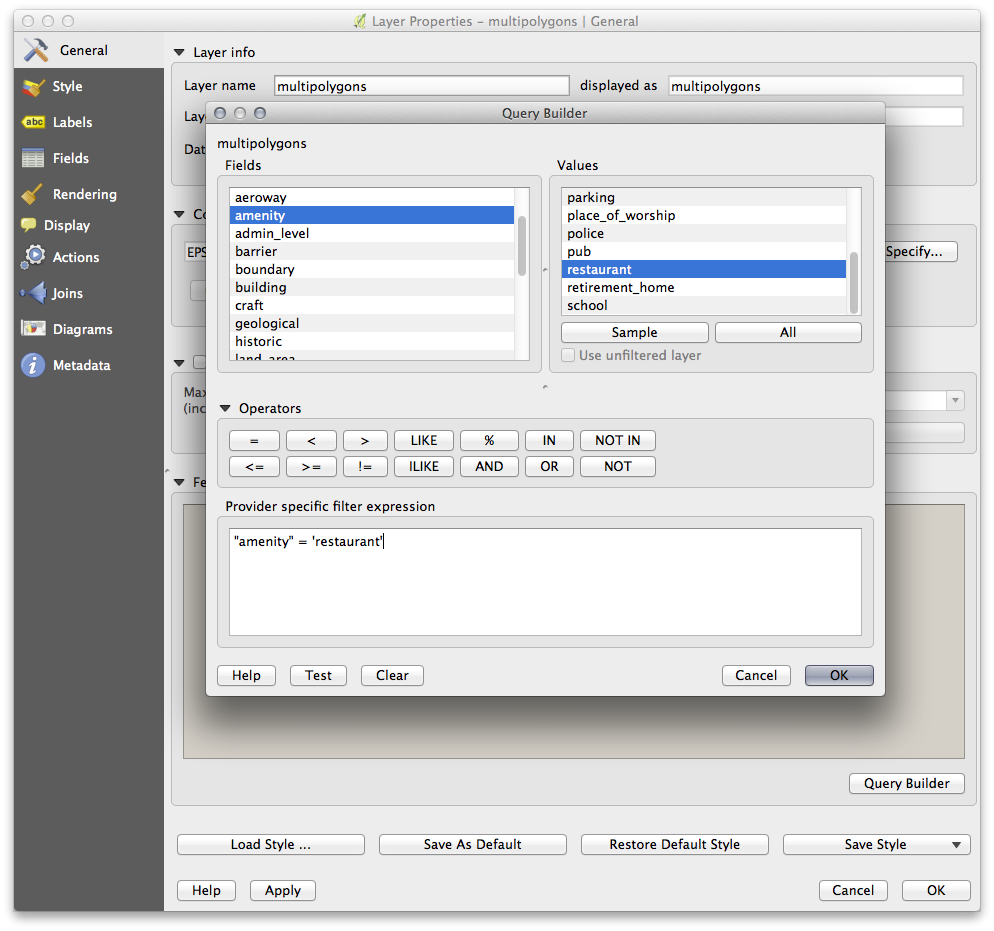
Using the Query Builder against the multipolygons layer, create the following queries for the houses, schools, restaurants and residential layers:

Once you have entered each query, click OK. You’ll see that the map updates to show only the data you have selected. Since you need to use again the multipolygons data from the OSM dataset, at this point, you can use one of the following methods:
- Rename the filtered OSM layer and re-import the layer from osm_data.osm, OR
- Duplicate the filtered layer, rename the copy, clear the query and create your new query in the Query Builder.
ノート
Although OSM’s building field has a house value, the coverage in your area - as in ours - may not be complete. In our test region, it is therefore more accurate to exclude all buildings which are defined as anything other than house. You may decide to simply include buildings which are defined as house and all other values that have not a clear meaning like yes.
To create the roads layer, build this query against OSM’s lines layer:
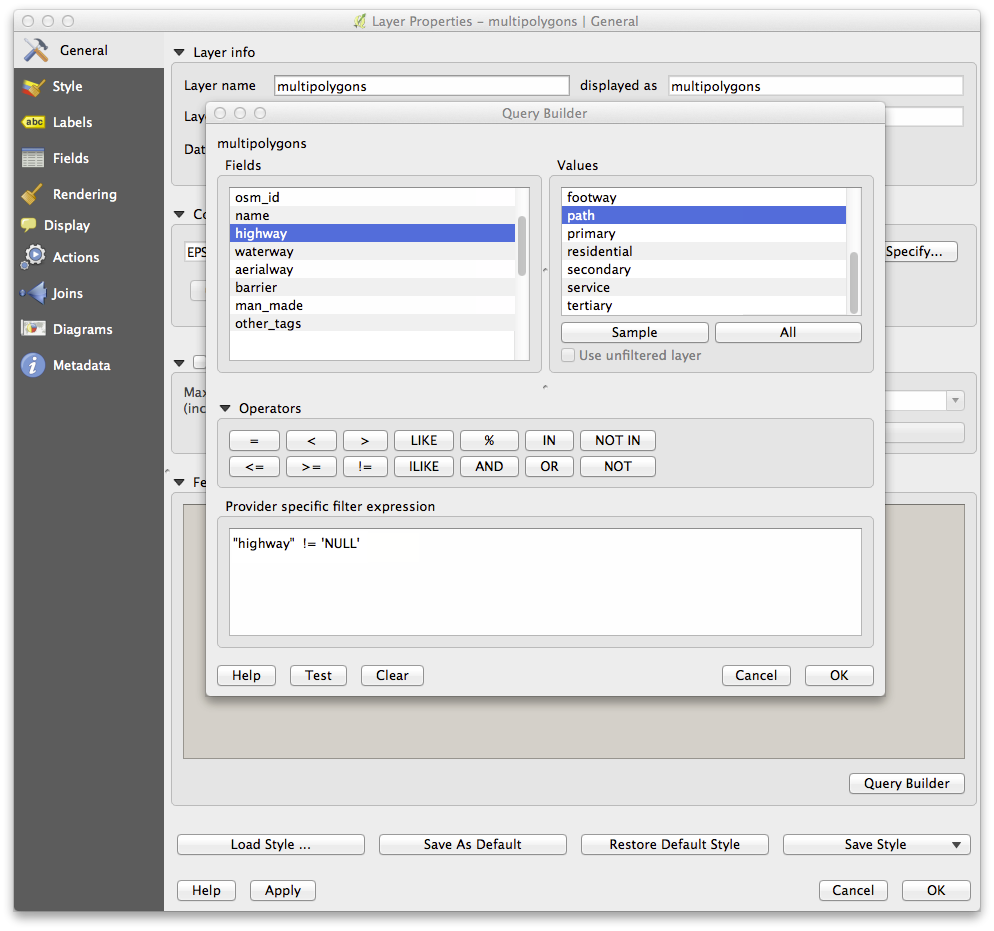
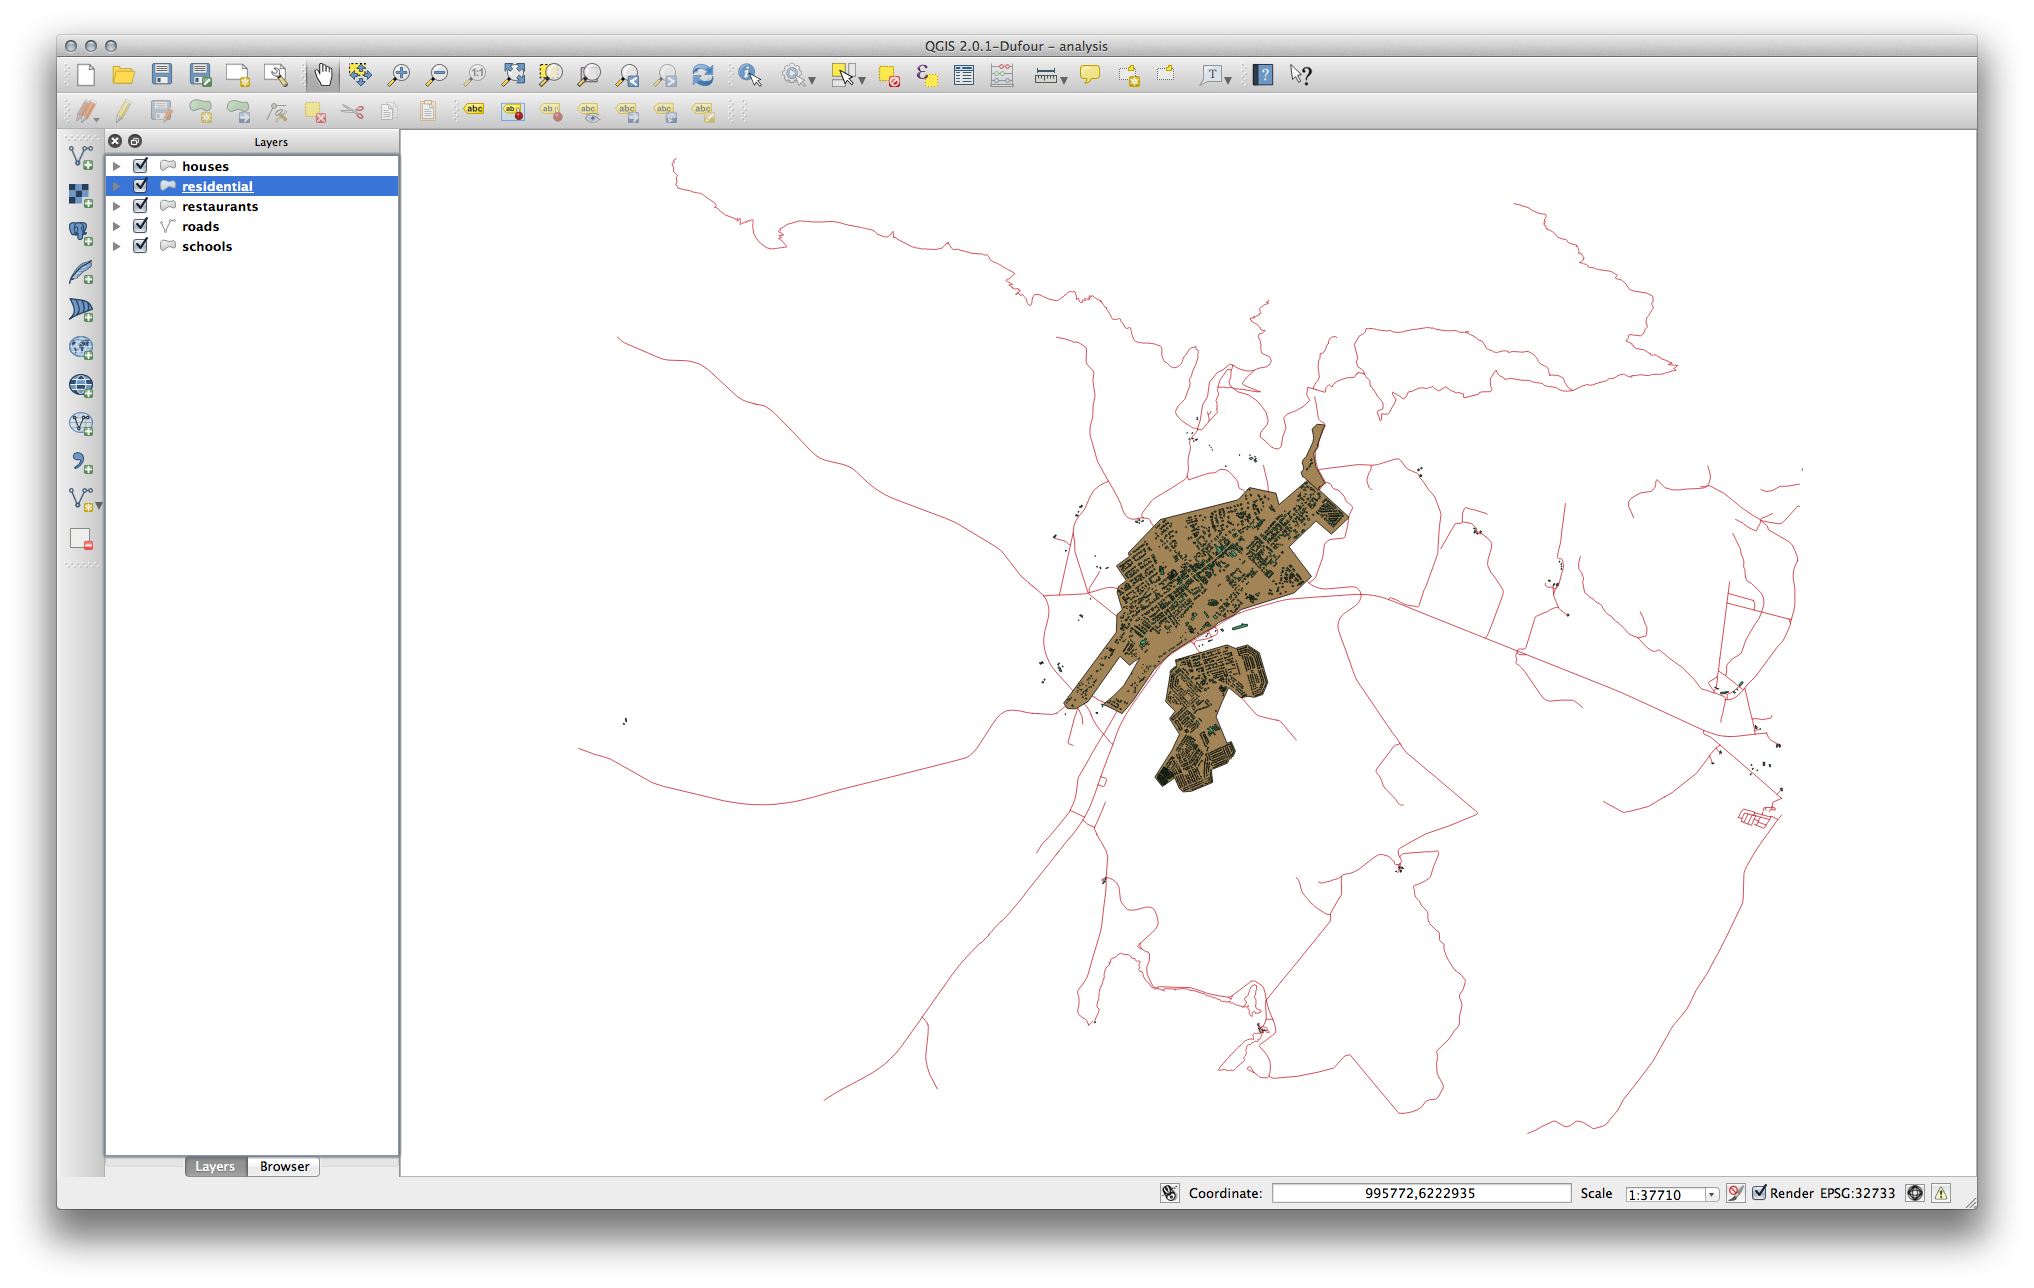
You should end up with a map which looks similar to the following:
21.9.2. 高校からの距離
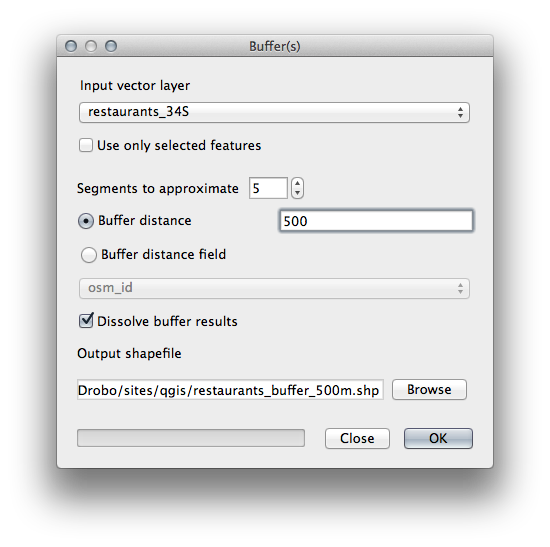
あなたのバッファダイアログはこのように見えるはずです:

The Buffer distance is 1000 meters (i.e., 1 kilometer).
The Segments to approximate value is set to 20. This is optional, but it’s recommended, because it makes the output buffers look smoother. Compare this:
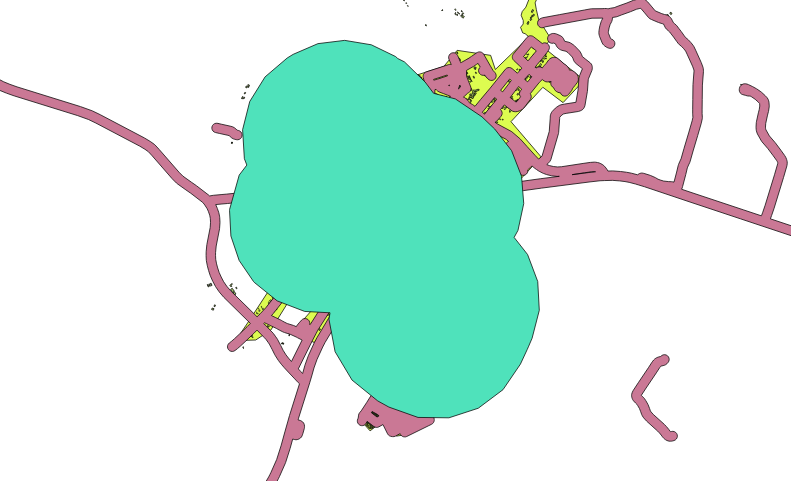
これに:
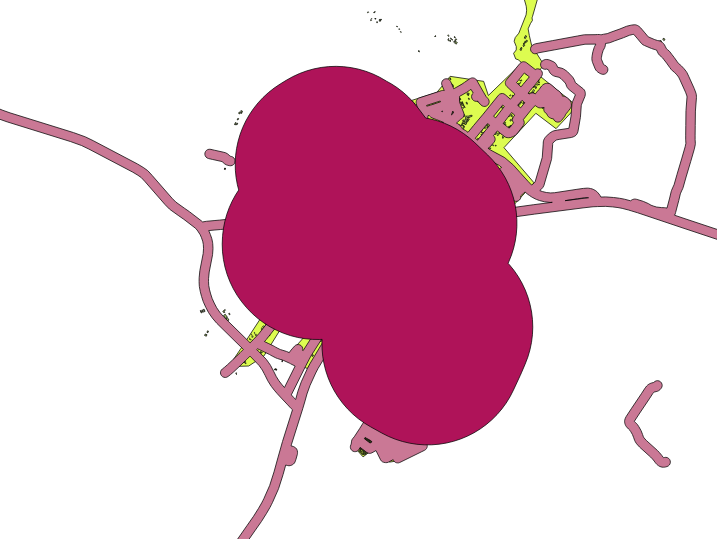
The first image shows the buffer with the Segments to approximate value set to 5 and the second shows the value set to 20. In our example, the difference is subtle, but you can see that the buffer’s edges are smoother with the higher value.
21.9.3. レストランからの距離
To create the new houses_restaurants_500m layer, we go through a two step process:
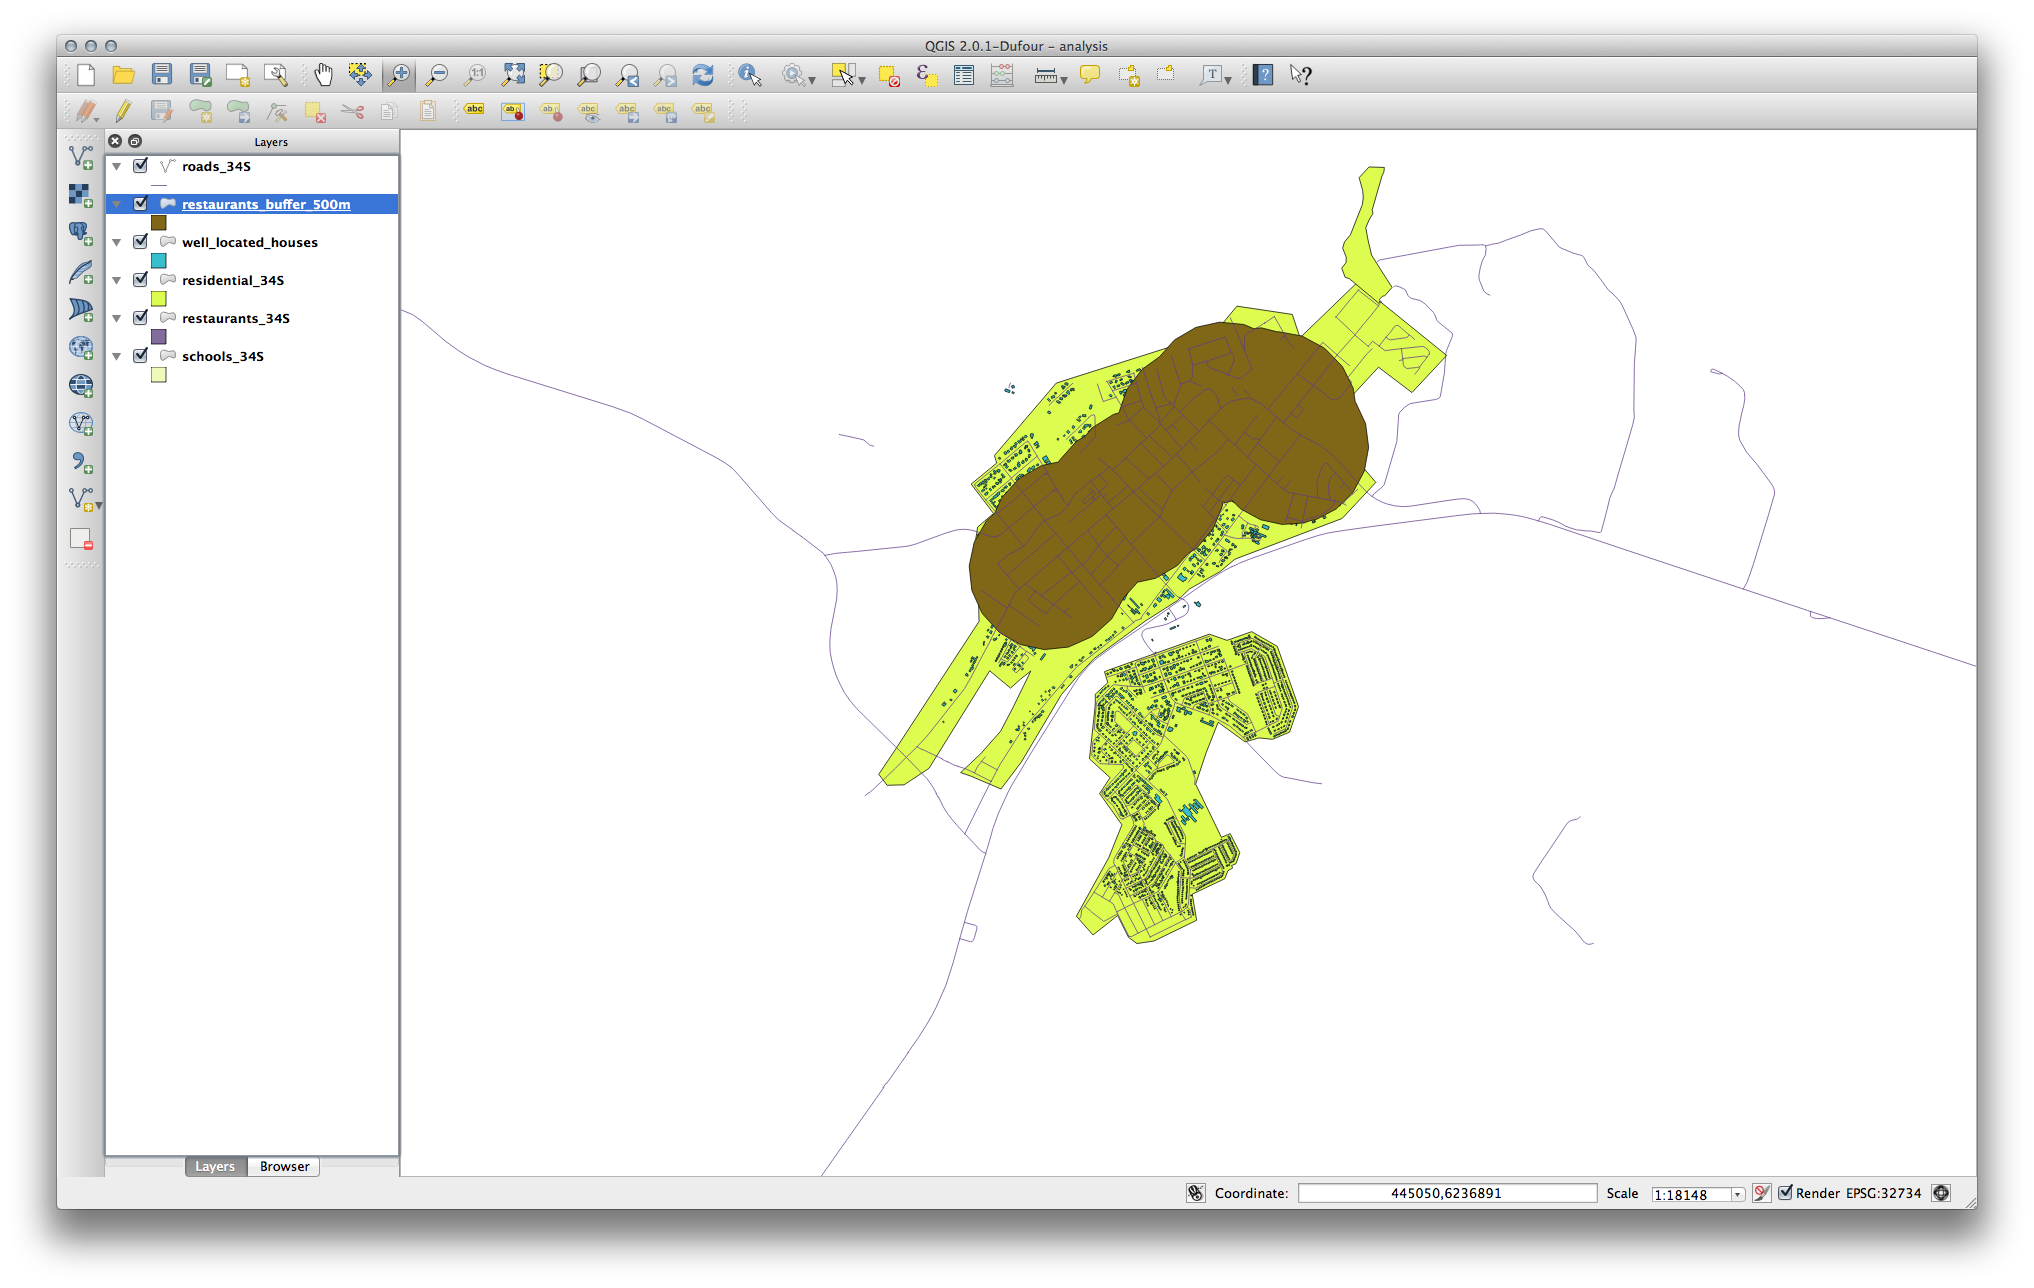
最初に、レストランの周囲に500m のバッファを作成し、地図にレイヤーを追加します:
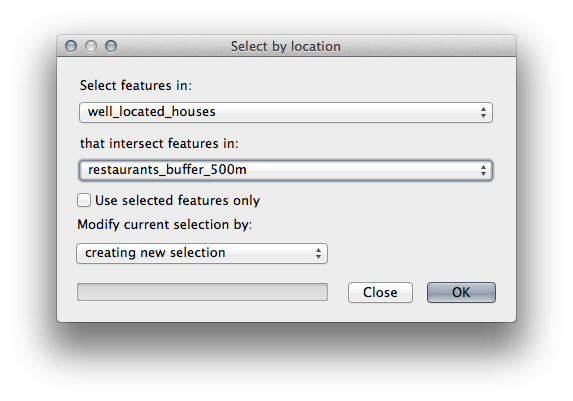
Next, select buildings within that buffer area:
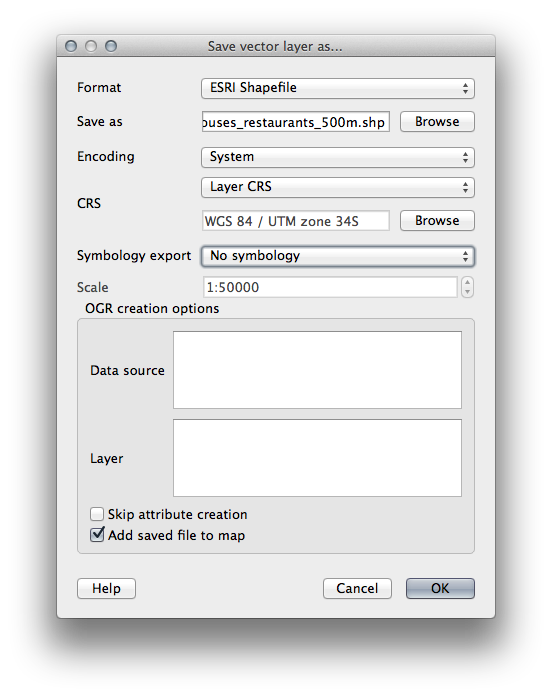
Now save that selection to our new houses_restaurants_500m layer:
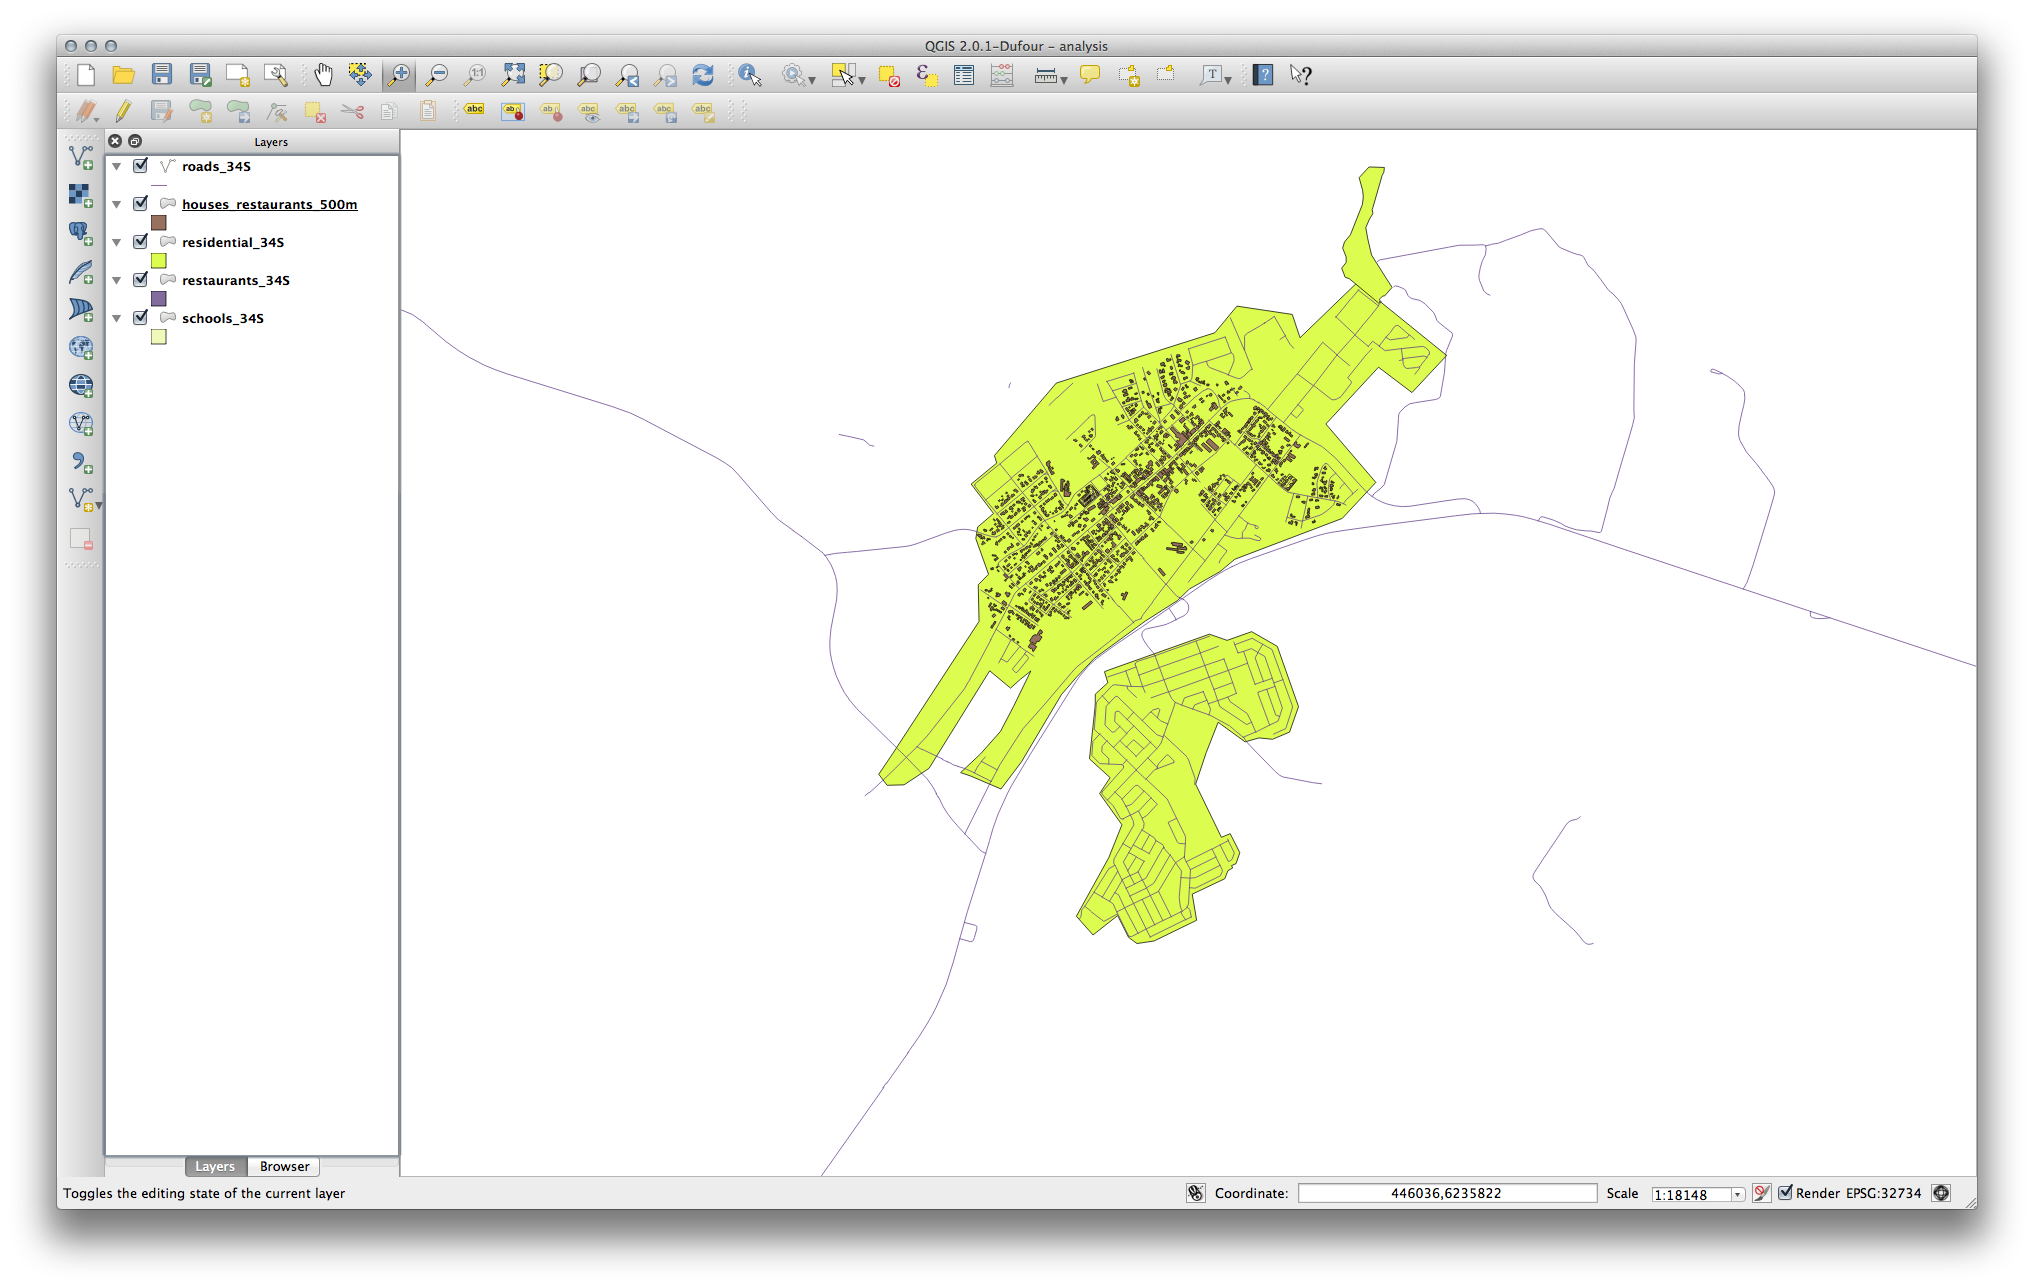
これであなたの地図には道路から50m 以内、学校から1km 以内、そしてレストランから500m 以内の建物だけが表示されます:
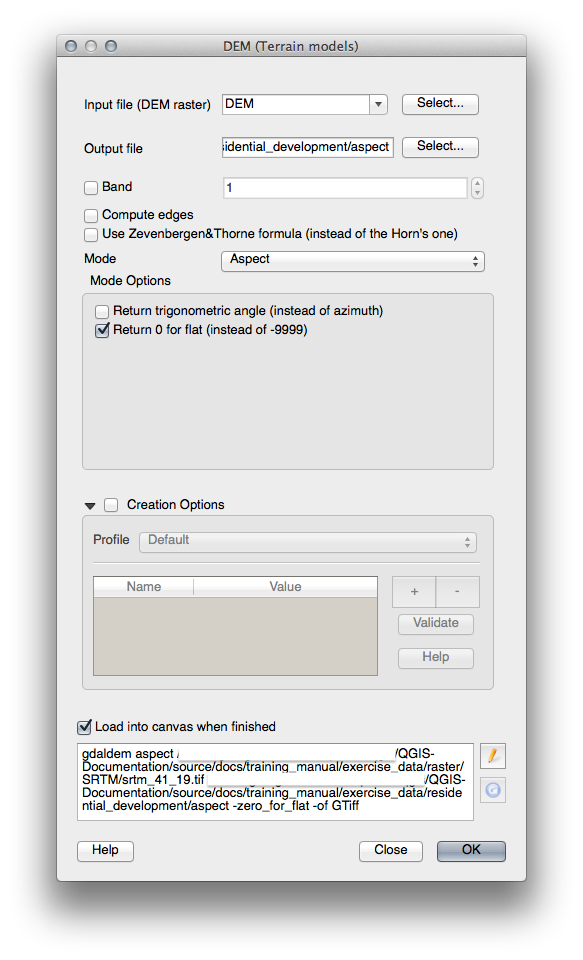
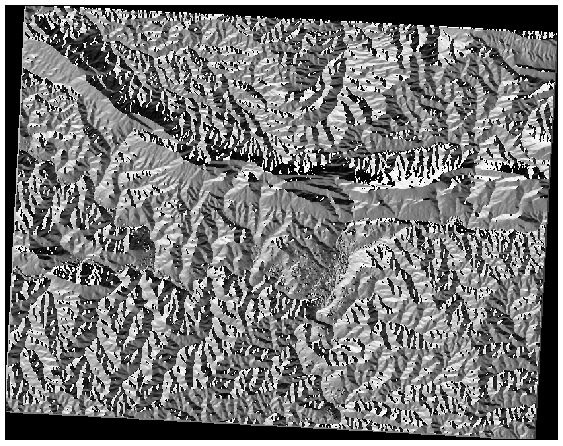
21.10. Results For ラスター分析
21.11. Results For 分析を完了させる
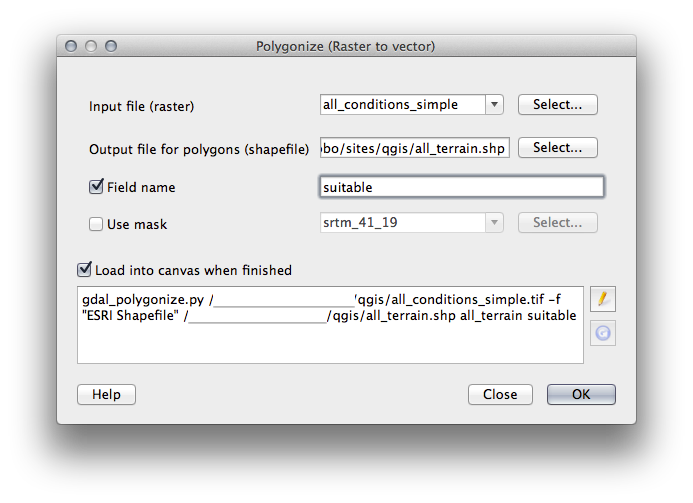
21.11.1. ラスターからベクター
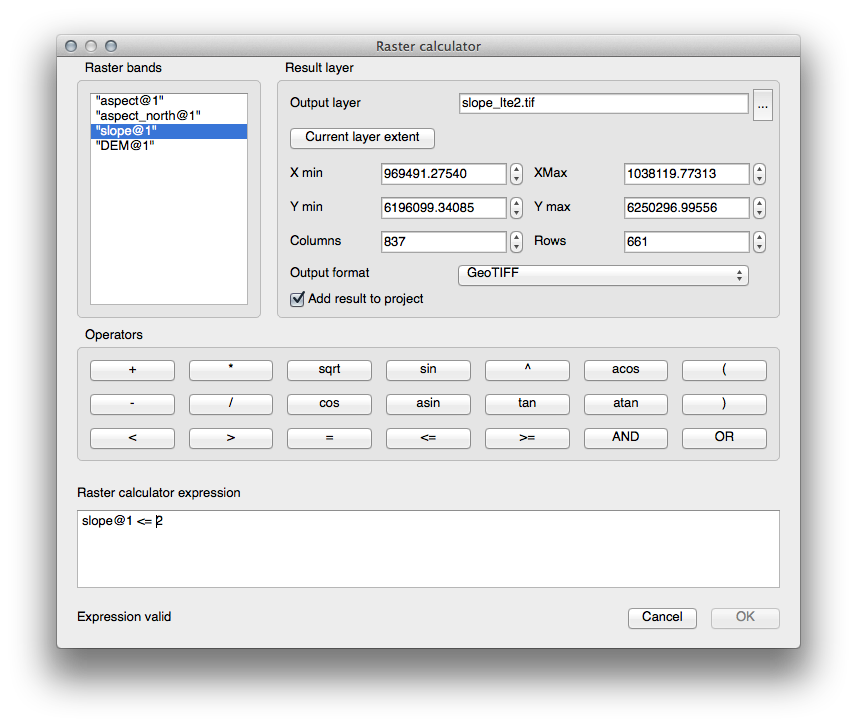
- Open the Query Builder by right-clicking on the all_terrain layer in the Layers list, select the General tab.
次に、"suitable" = 1 クエリを構築します。
OK をクリックしてこの条件が満たされていないすべてのポリゴンをフィルタリングします。
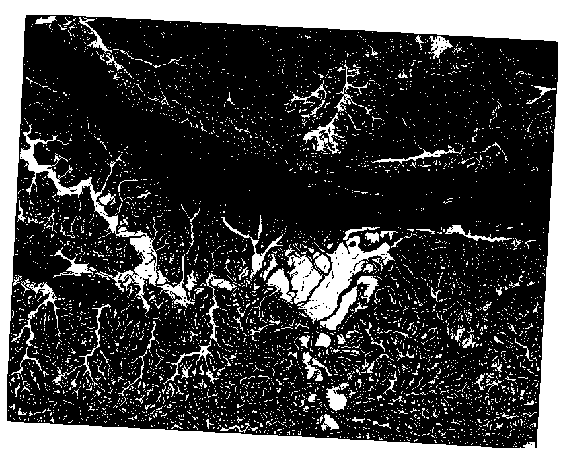
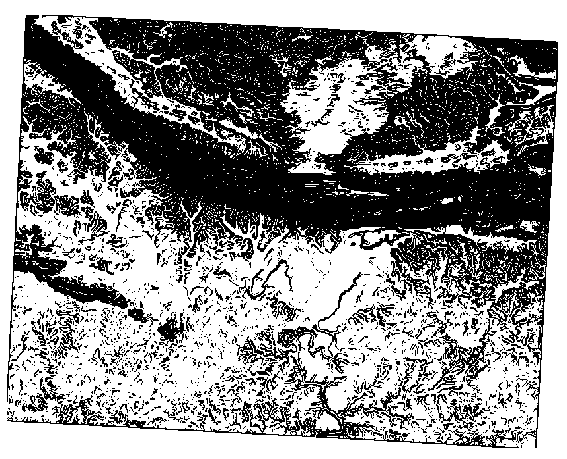
オリジナルのラスター上で閲覧するとその領域は完全にオーバーラップされるはずです:
- You can save this layer by right-clicking on the all_terrain layer in the Layers list and choosing Save As..., then continue as per the instructions.
21.11.2. 結果を精査
Intersect ツールによって new_solution レイヤー中の建物の一部が「スライス」されることがあることに気づくことがあります。これは、建物の一部のみ - それゆえ資産の一部のみ -が適した地形の上にあることを示しています。したがって、賢明にデータセットから、これらの建物を排除できます
21.11.3. 分析を改善する
現時点ではあなたの分析は次のように見えるはずです:
全ての方向に100メートルのための連続円形領域を考えます。
それは半径100メートルより大きい場合、(すべての方向から)、その大きさから100m減算して、それが途中で放置された部分になります。
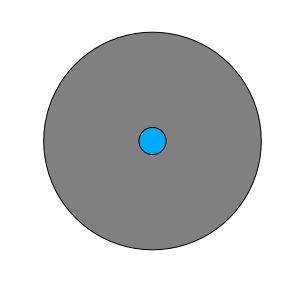
そのため、既存の suitable_terrain ベクターレイヤー上で100メートルの 内部バッファ を実行できます。バッファ機能の出力においては、元のレイヤーのどんな残りも、100メートルを超えて適した地形がある領域を表すことになります。
証明するために:
ベクター ‣ ジオプロセッシングツール ‣ バッファ に行き、バッファダイアログを開きます。
このように設定します:
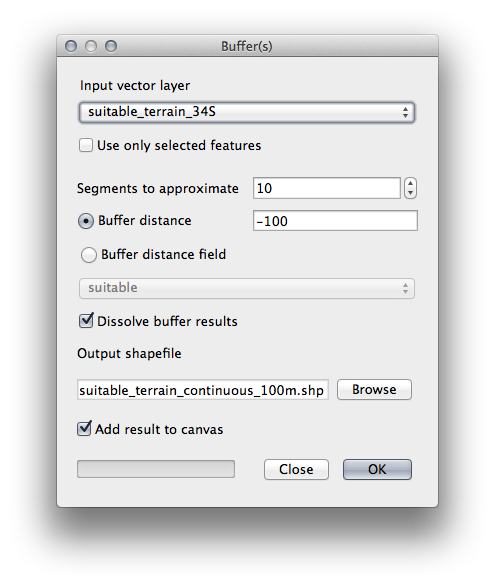
10 のセグメントで -100 のバッファ距離で suitable_terrain レイヤーを使用します。(地図が投影CRSを使用しているため、距離は自動的にメートル単位です。)
出力を exercise_data/residential_development/ 中に suitable_terrain_continuous100m.shp として保存します。
必要に応じて、あなたのオリジナルの suitable_terrain レイヤーの上に新しいレイヤーを移動してください。
作業結果は次のように見えるはずです:

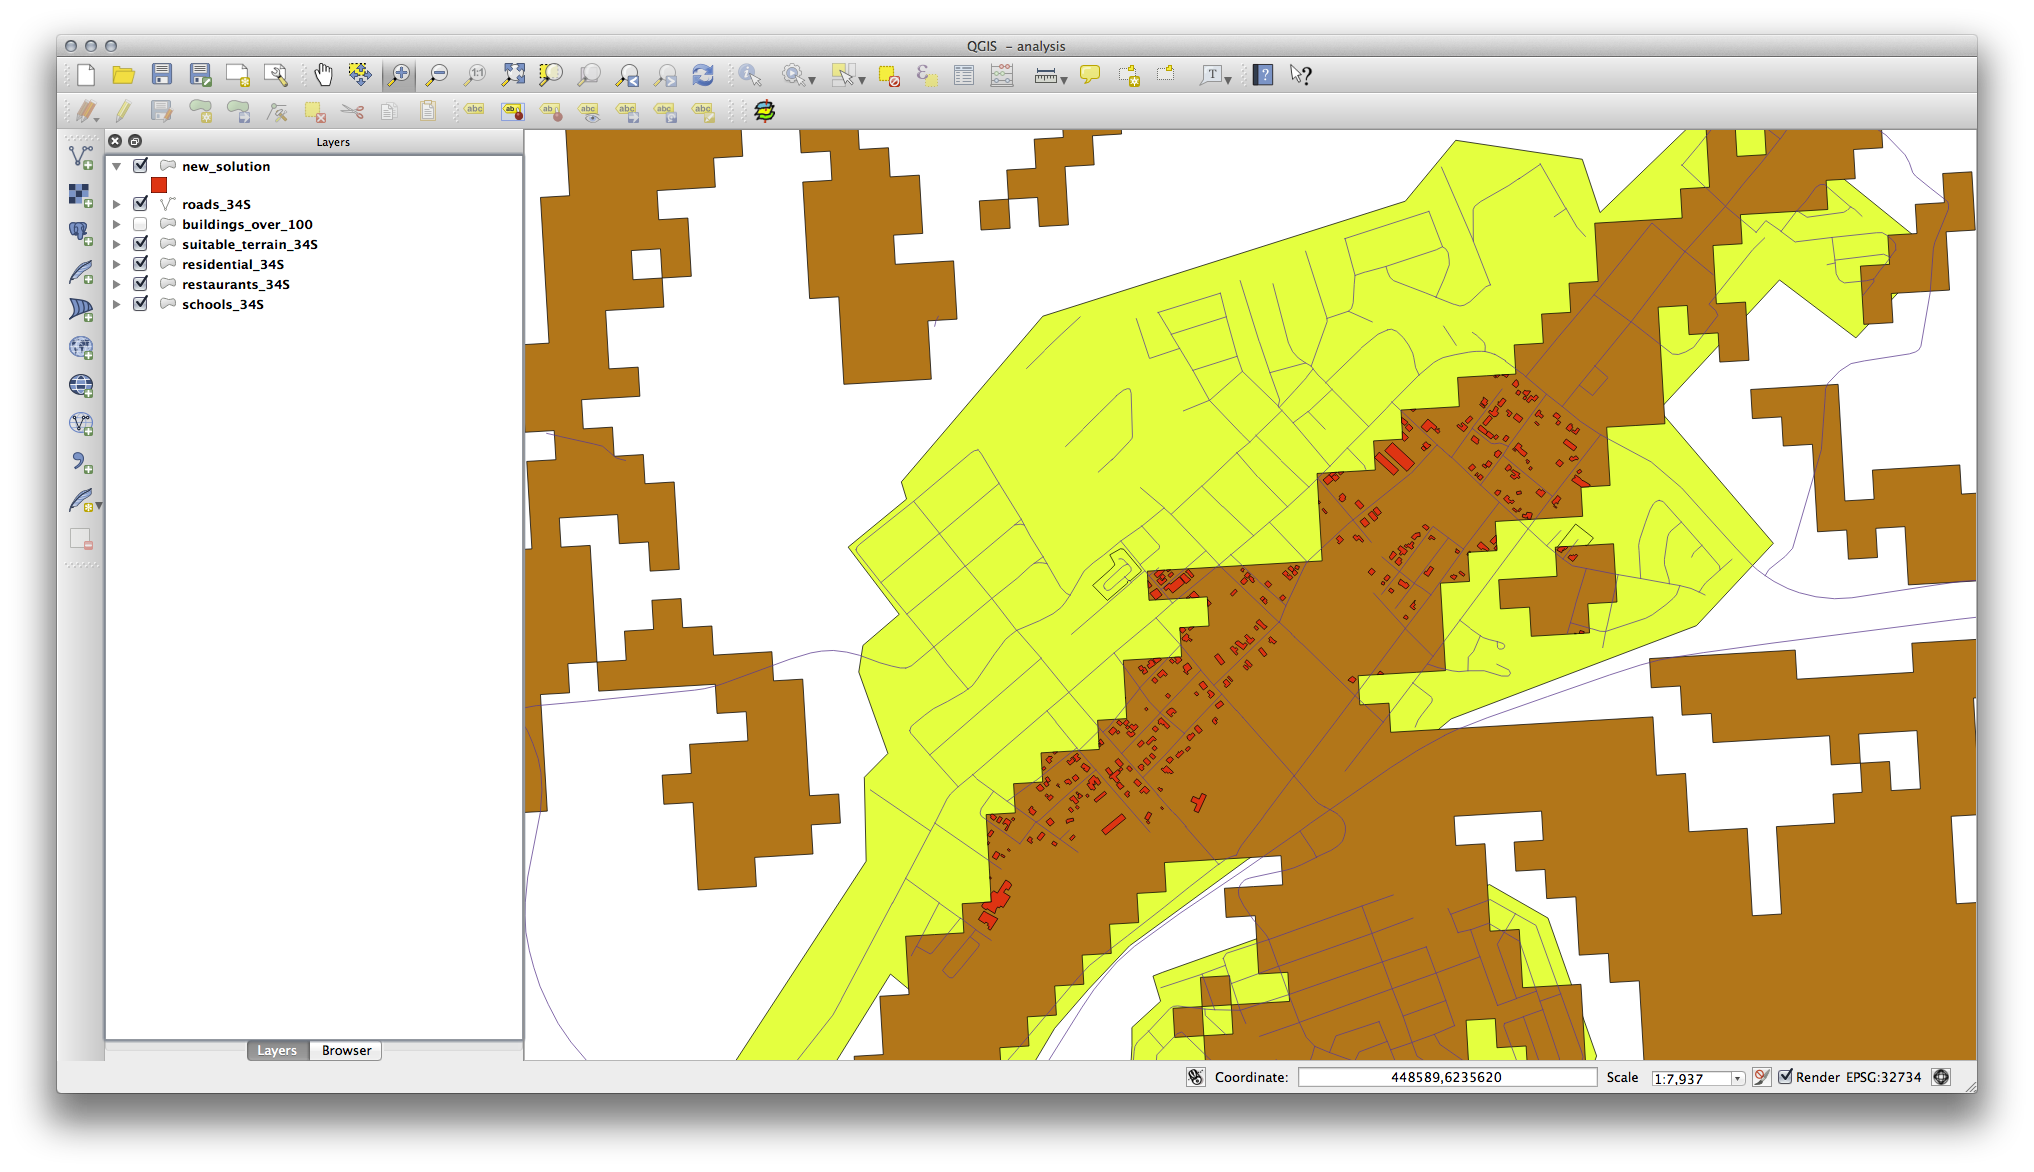
ここで 位置で選択 ツール( ベクター ‣ 研究のツール ‣ 位置で選択 )を使用します。
このように設定します:
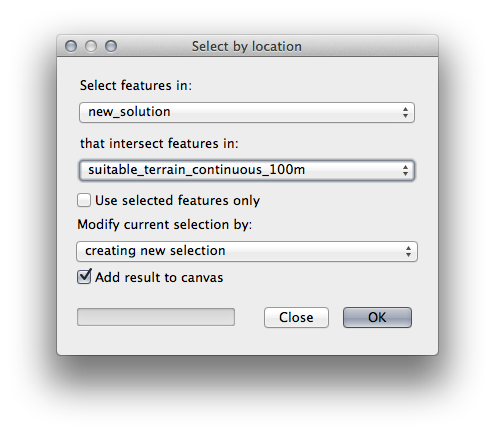
suitable_terrain_continuous100m.shp の中の地物に交差する new_solution 中の地物を選択します。
結果はこちらです:
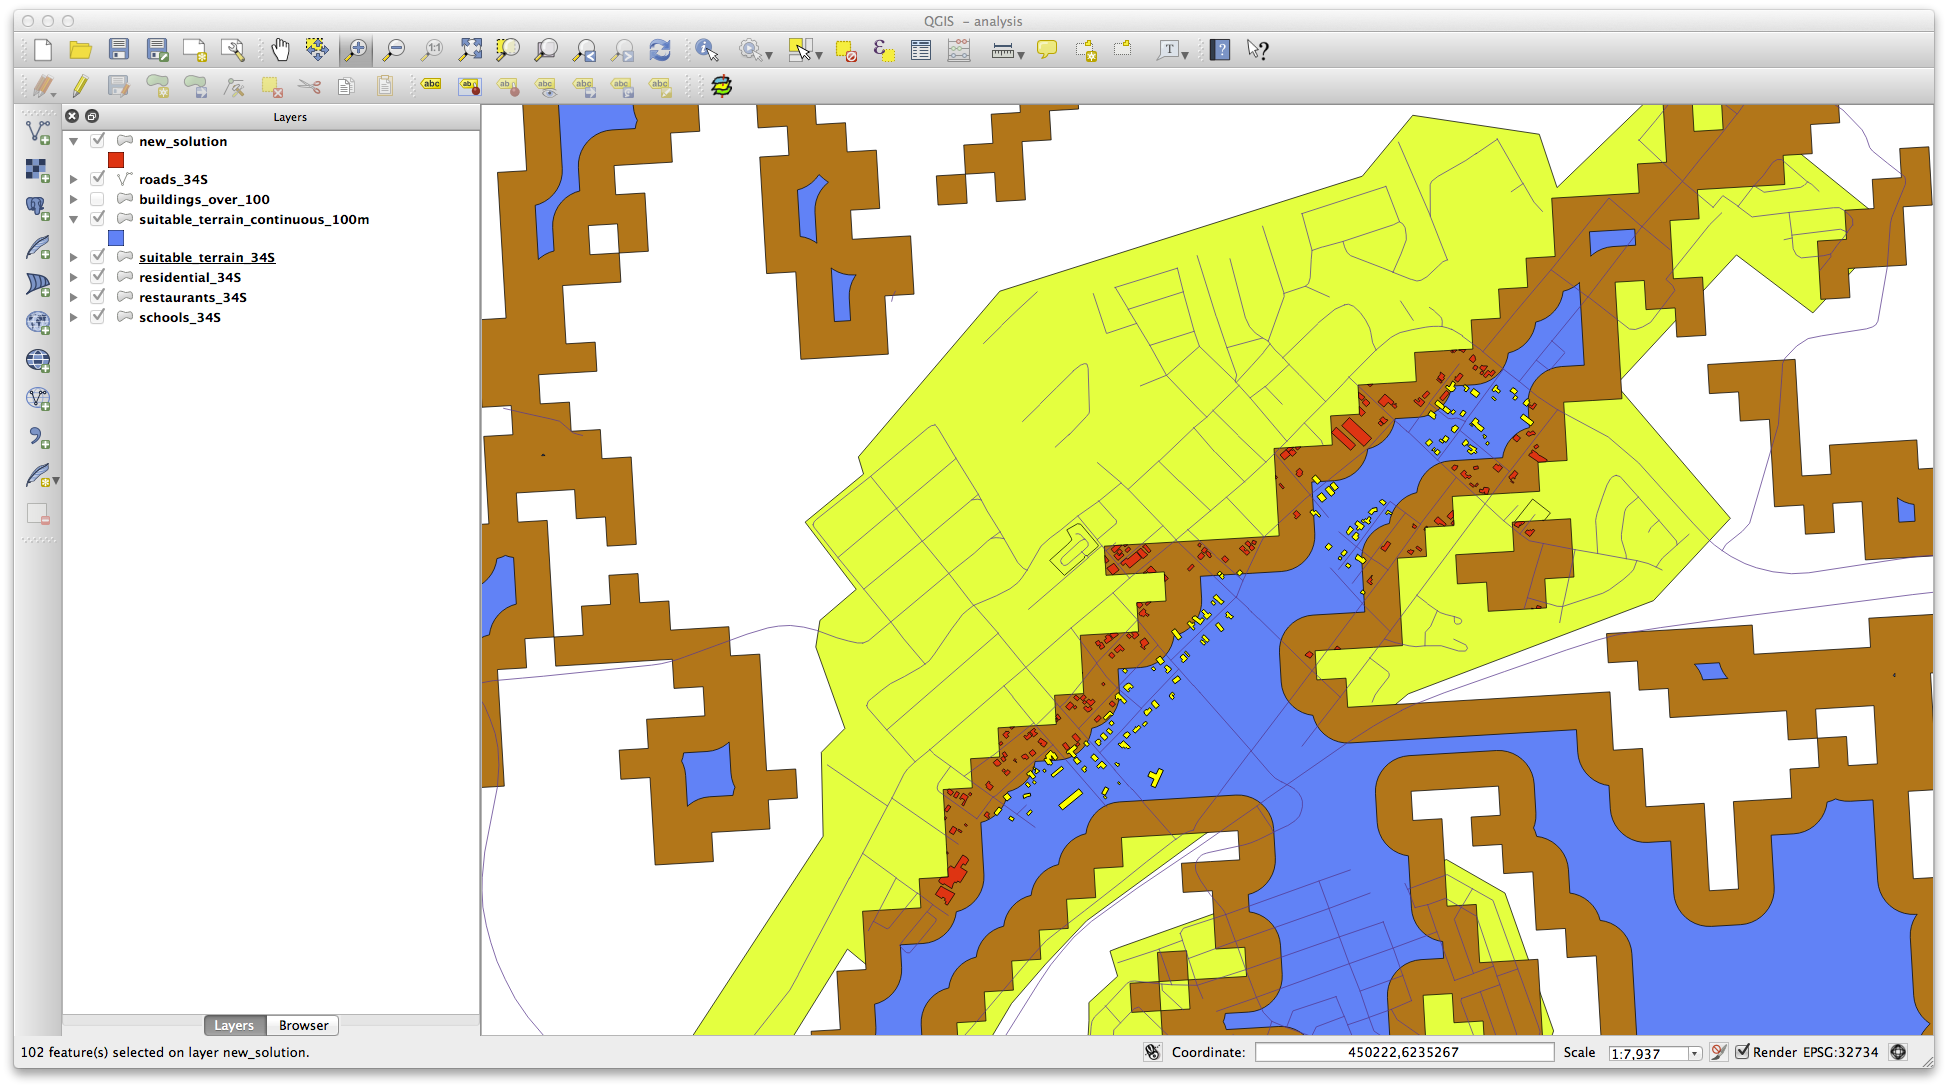
黄色の建物が選択されています。建物の一部は、新しい suitable_terrain_continuous100m レイヤー外に一部が落ちるものの、それらは元の suitable_terrain レイヤー範囲内に十分にあり、したがって私たちの要件のすべてを満たしています。
選択を exercise_data/residential_development/ 下に final_answer.shp として保存してください。
21.12. Results For WMS
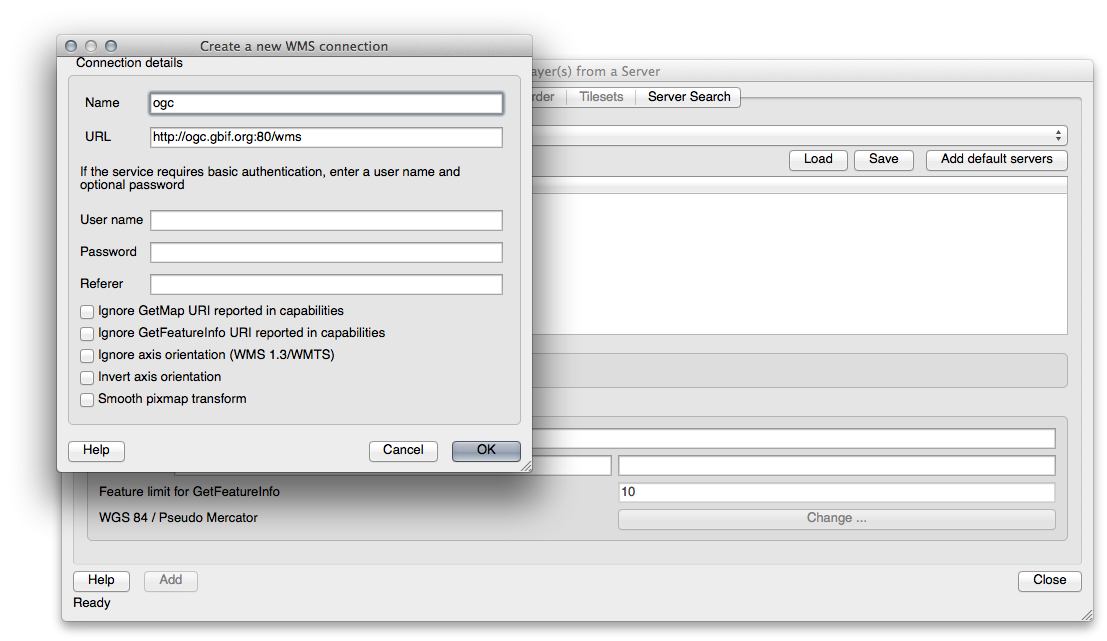
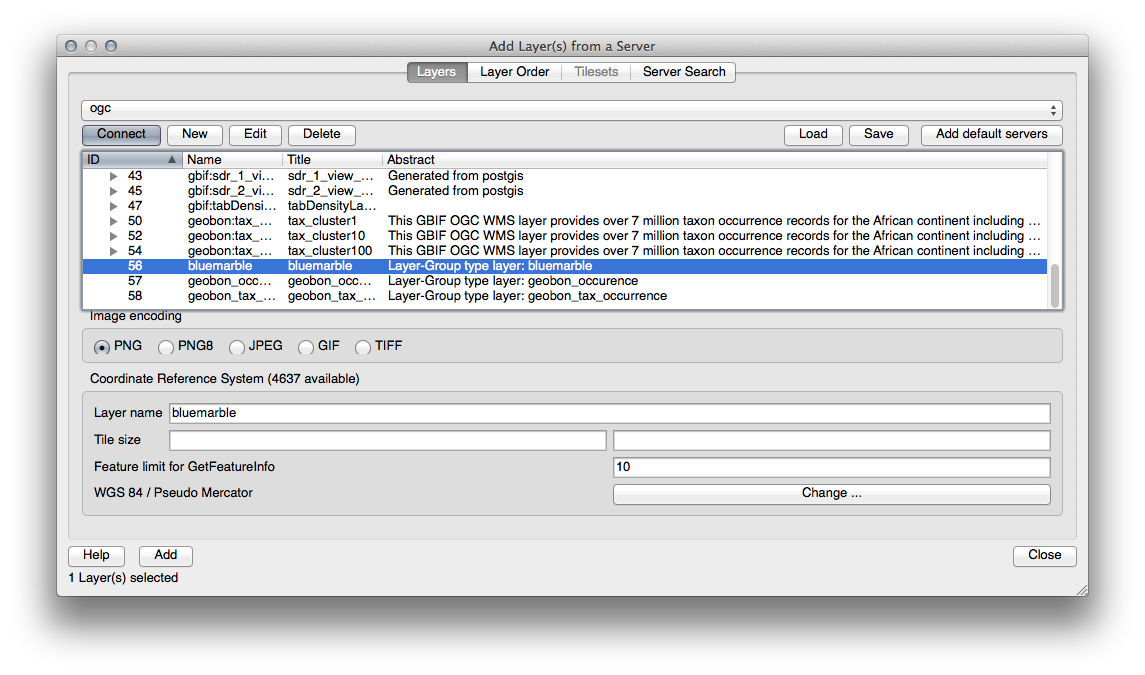
21.12.2. 新しいWMSサーバーの追加
新しいサーバーとそのサーバー上でホストされているように、適切なレイヤーを追加する前と同じアプローチを使用します。
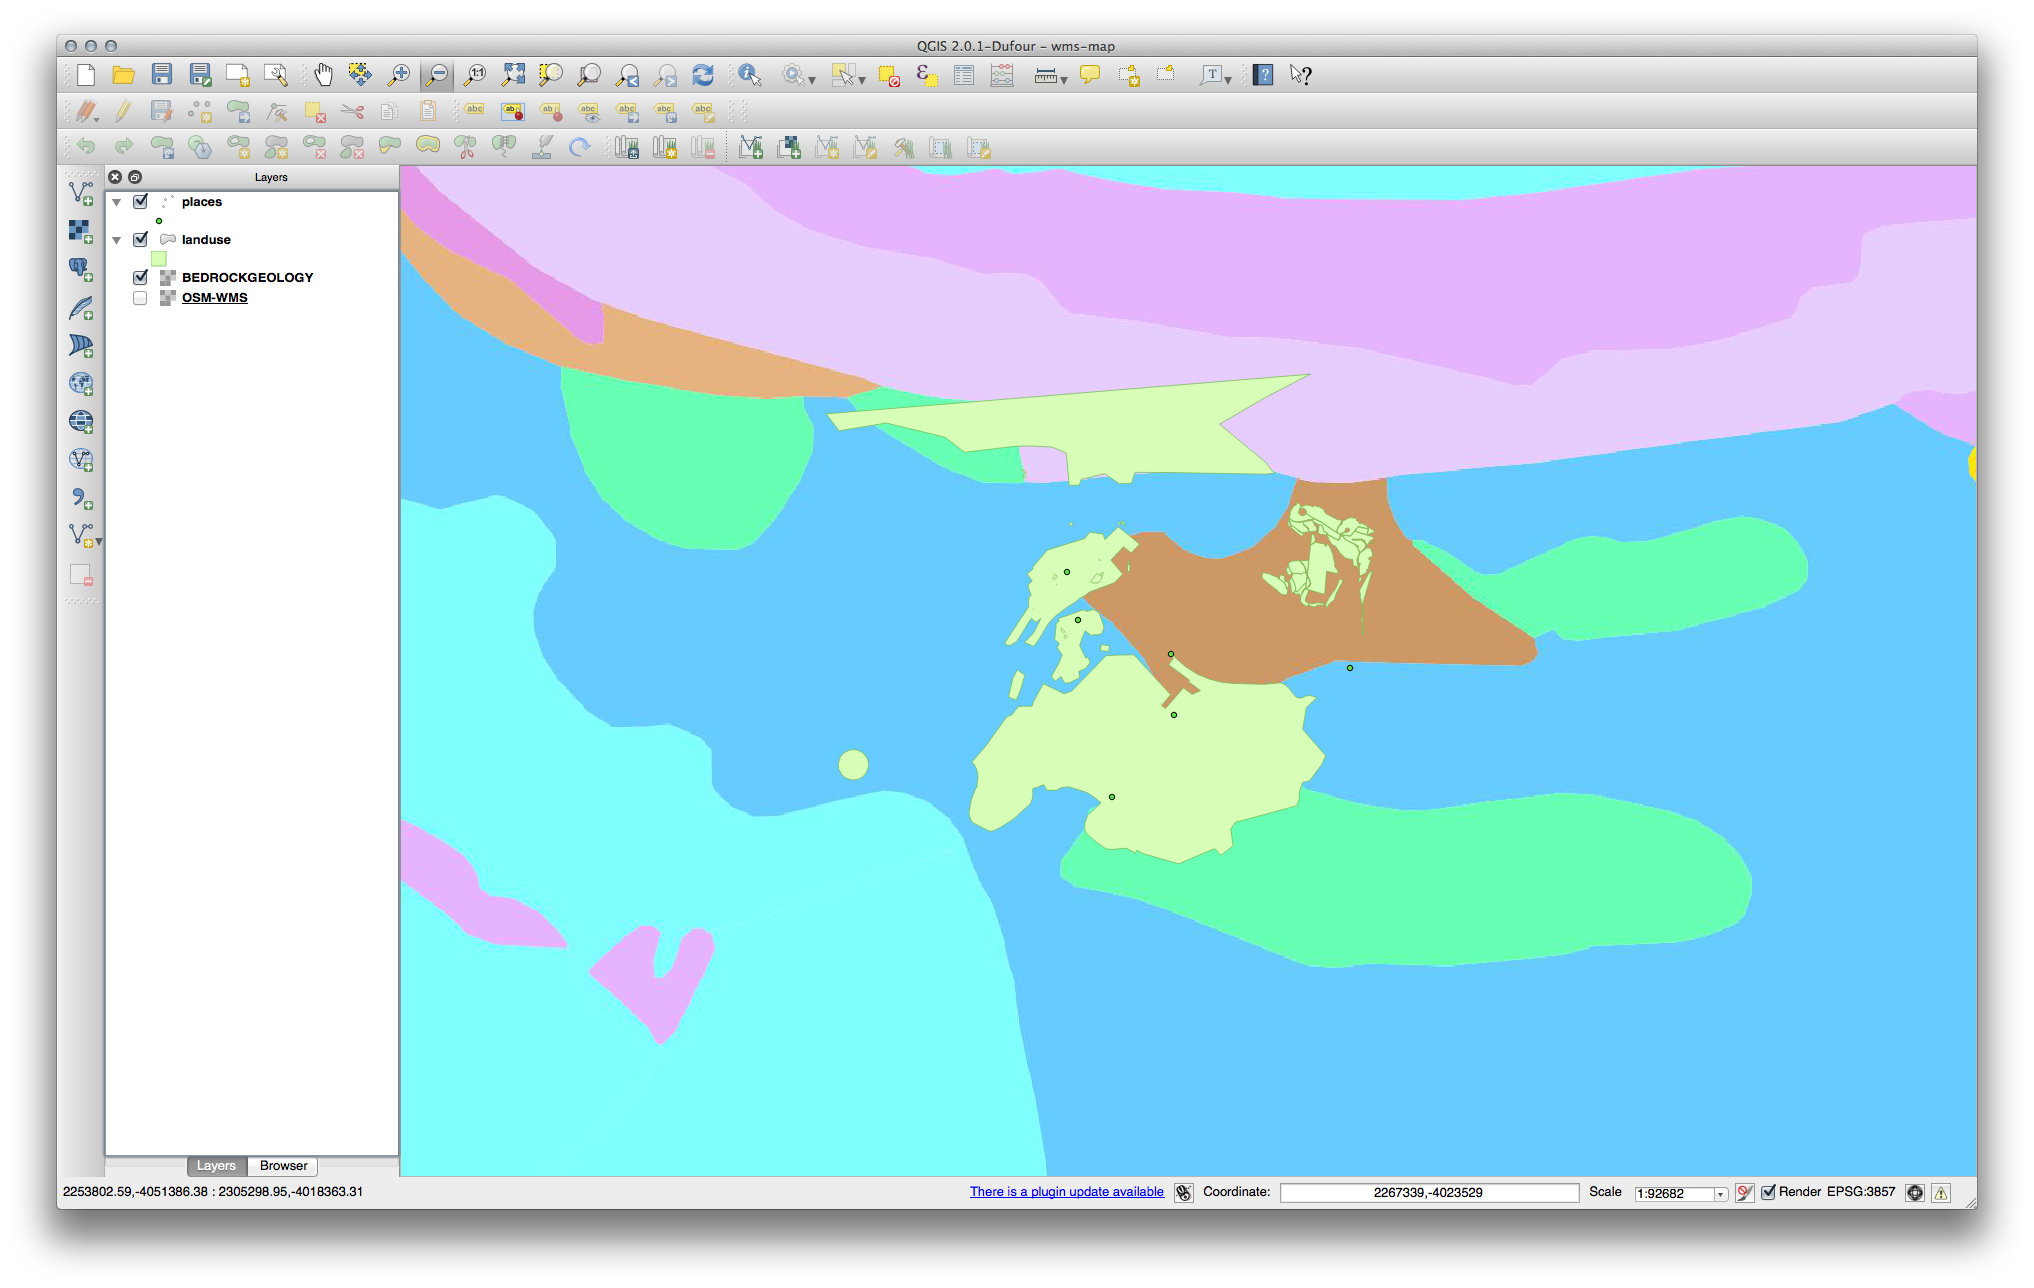
Swellendam 領域にズームインした場合、このデータセットは低解像度を持っていることに気づくでしょう:
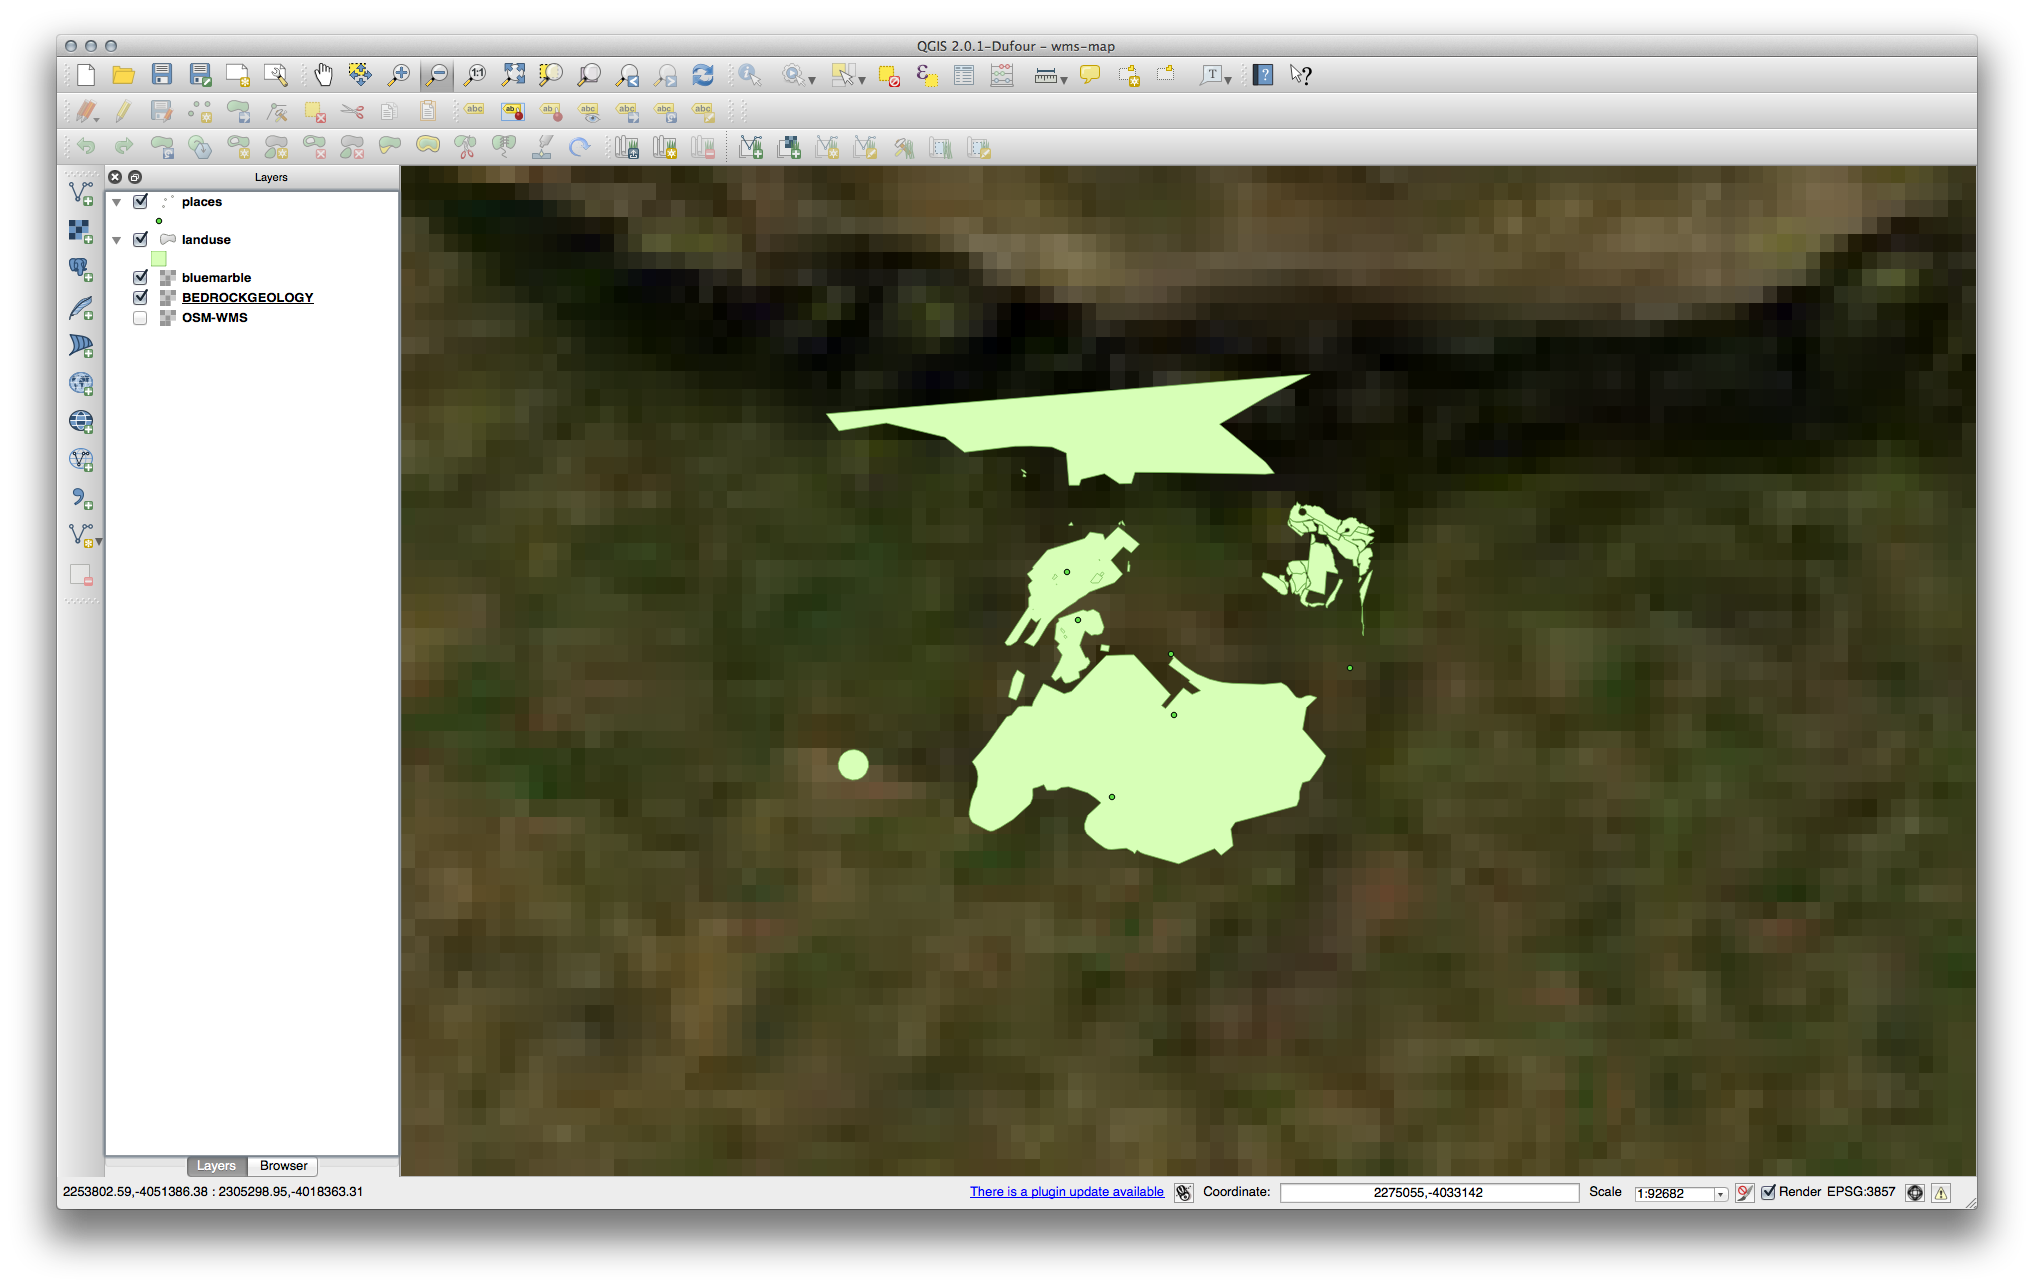
したがって、現在の地図にこのデータを使用しない方が良いです。ブルーマーブルデータは、グローバルまたは全国規模での方が適しています。
21.12.3. WMSサーバーの検索
You may notice that many WMS servers are not always available. Sometimes this is temporary, sometimes it is permanent. An example of a WMS server that worked at the time of writing is the World Mineral Deposits WMS at http://apps1.gdr.nrcan.gc.ca/cgi-bin/worldmin_en-ca_ows. It does not require fees or have access constraints, and it is global. Therefore, it does satisfy the requirements. Keep in mind, however, that this is merely an example. There are many other WMS servers to choose from.
21.13. Results For データベースの概念
21.13.1. 住所テーブルのプロパティ
理論上の住所テーブルのために、次のプロパティを保存したい場合があります:
House Number
Street Name
Suburb Name
City Name
Postcode
Country
住所オブジェクトを表すために、テーブルを作成するとき、これらのプロパティのそれぞれを表現するために列を作成し、SQL準拠し、おそらく短縮名とそれらに名前を付けるでしょう:
house_number
street_name
suburb
city
postcode
country
21.13.2. People(人々)テーブルを正規化する
people テーブルの主要な問題は、人の住所全体を含む単一の住所フィールドが存在することです。以前このレッスンでは、私たちの理論 address テーブルを考える、私たちは住所が多くの異なる特性で構成されていることを知っています。すべてのこれらのプロパティを1つのフィールド内に格納することにより、データを更新して照会することがはるかに困難にします。そこで、様々なプロパティに住所フィールドを分割する必要があります。これは、次のような構造を持つテーブルを与えるだろう:
id |     name      | house_no |  street_name   |    city    |   phone_no
 --+---------------+----------+----------------+------------+-----------------
 1 | Tim Sutton    |     3    | Buirski Plein  | Swellendam | 071 123 123
 2 | Horst Duester |     4    | Avenue du Roix | Geneva     | 072 121 122
ノート
次のセクションでは、さらに当社のデータベースの構造を改善するために、この例で使用することができ、外部キーの関係について学びます。
21.13.3. 人々テーブルのさらなる正規化
people テーブルは現在はこのようになっています:
id |     name     | house_no | street_id |  phone_no
---+--------------+----------+-----------+-------------
 1 | Horst Duster |        4 |         1 | 072 121 122
street_id 列は people オブジェクトと関連 street オブジェクト、 streets テーブルにある、の間の「1対多」関係を表します。
テーブルをさらに正規化する一つの方法は、名前のフィールドを 姓 と 名 に分割することです:
id | first_name | last_name  | house_no | street_id |  phone_no
---+------------+------------+----------+-----------+------------
 1 |    Horst   |   Duster   |     4    |     1     | 072 121 122
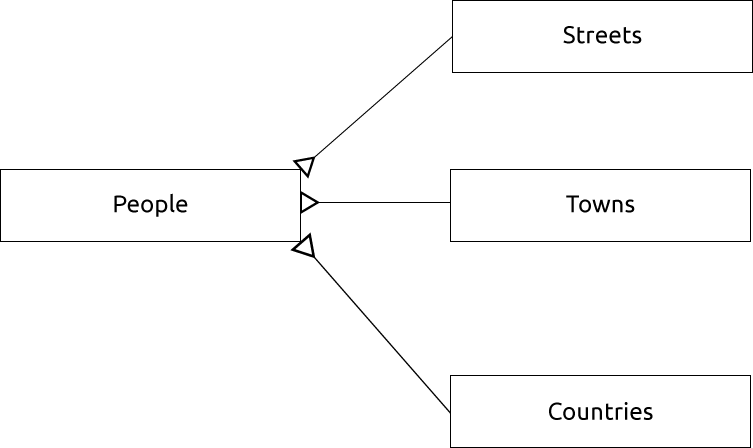
また、町名や都市名と国に対して別々のテーブルを作成し、「1対多」関係を介して私たちの people テーブルにそれらをリンクできます:
id | first_name | last_name | house_no | street_id | town_id | country_id
---+------------+-----------+----------+-----------+---------+------------
 1 |    Horst   |   Duster  |     4    |     1     |    2    |     1
これを表現するER図は次のようになります:
21.13.4. 人々テーブルを作成します
正しい人々テーブルを作成するために必要なSQLは:
create table people (id serial not null primary key,
                     name varchar(50),
                     house_no int not null,
                     street_id int not null,
                     phone_no varchar null );
テーブルのスキーマは(\d people と入力します)このようになります:
Table "public.people"

Column     |         Type          |                      Modifiers
-----------+-----------------------+-------------------------------------
id         | integer               | not null default
           |                       | nextval('people_id_seq'::regclass)
name       | character varying(50) |
house_no   | integer               | not null
street_id  | integer               | not null
phone_no   | character varying     |
Indexes:
  "people_pkey" PRIMARY KEY, btree (id)
ノート
説明のために、FKEY制約は意図的に省略しています。
21.13.5. DROPコマンド
people テーブルは streets テーブルへの外部キー制約があるため、DROPコマンドは、このケースでは動作しない理由があります。これは、 streets テーブルをドロップする(または削除する)と、存在しない streets データへの参照が people テーブルに残ることを意味します。
ノート
CASCADE コマンドを使用して streets テーブルを強制的に削除することは可能ですが、これは people と streets テーブルへの関係づけられていた他のテーブルも削除します。注意して使用してください!
21.13.6. 新しい街路を挿入
使用する必要があるSQLコマンドは、(選択した名前を持つ通りの名前を置き換えできます)、このようになります:
insert into streets (name) values ('Low Road');
21.13.7. 外部キー関係に新しい人を追加
これが正しいSQL文です:
insert into streets (name) values('Main Road');
insert into people (name,house_no, street_id, phone_no)
  values ('Joe Smith',55,2,'072 882 33 21');
街路テーブルを再び(以前のようにselect文を使用して)見ると、 主要道路 エントリのための id は 2 であることがわかるでしょう。
だから上では数 2 を入力するしかできなかったでしょう。私たちが上記のエントリで完全に書き出された 主要道路 を見ていないにもかかわらず、データベースはそれを 2 という street_id 値を持つものと関連付けできるでしょう。
ノート
すでに新しい street オブジェクトを追加している場合、新しい 主要道路 のIDは 2 でなく 3 だったということがあるかもしれません。
21.13.8. 街路名を返す
これが使用すべき正しいSQL文です:
select count(people.name), streets.name
from people, streets
where people.street_id=streets.id
group by streets.name;
結果::
count |    name
------+-------------
    1 | Low Street
    2 | High street
    1 | Main Road
(3 rows)
ノート
テーブル名をフィールド名の接頭辞にしていることに気づくでしょう(例えばpeople.nameとstreets.name)。フィールド名があいまいな(つまり、データベース内のすべてのテーブル間で一意ではない)時はいつでもこれが行われる必要があります。
21.14. Results For 空間クエリ
21.14.1. 空間クエリで使用される単位
例のクエリで使用されている単位は度です。それはレイヤーが使用しているCRSがWGS 84であるためです。これは地理的CRSです、つまりその単位は度であることを意味します。投影CRSは、UTM投影でのように、メートル単位です。
クエリを書くときはレイヤーのCRSがどの単位かを知る必要があることを忘れないでください。これにより期待する結果が返されるクエリを記述できるでしょう。
21.15. Results For ジオメトリ構築
21.15.1. ラインストリングを作成する
alter table streets add column the_geom geometry;
alter table streets add constraint streets_geom_point_chk check
     (st_geometrytype(the_geom) = 'ST_LineString'::text OR the_geom IS NULL);
insert into geometry_columns values ('','public','streets','the_geom',2,4326,
     'LINESTRING');
create index streets_geo_idx
  on streets
  using gist
  (the_geom);
21.15.2. テーブルをリンクする
delete from people;
alter table people add column city_id int not null references cities(id);
(QGISで都市をキャプチャ)
insert into people (name,house_no, street_id, phone_no, city_id, the_geom)
   values ('Faulty Towers',
           34,
           3,
           '072 812 31 28',
           1,
           'SRID=4326;POINT(33 33)');

insert into people (name,house_no, street_id, phone_no, city_id, the_geom)
   values ('IP Knightly',
           32,
           1,
           '071 812 31 28',
           1,F
           'SRID=4326;POINT(32 -34)');

insert into people (name,house_no, street_id, phone_no, city_id, the_geom)
   values ('Rusty Bedsprings',
           39,
           1,
           '071 822 31 28',
           1,
           'SRID=4326;POINT(34 -34)');
次のエラーメッセージが出ている場合:
ERROR:  insert or update on table "people" violates foreign key constraint
        "people_city_id_fkey"
DETAIL: Key (city_id)=(1) is not present in table "cities".
そのときは都市テーブルのポリゴンを作成して実験している間、それらのいくつかを削除してやり直してしまっていることを意味します。都市テーブルのエントリをチェックして、何らかの存在する id を使用するだけです。
21.16. Results For 簡易地物モデル
21.16.1. 表を投入
create table cities (id serial not null primary key,
                     name varchar(50),
                     the_geom geometry not null);
 alter table cities
 add constraint cities_geom_point_chk
 check (st_geometrytype(the_geom) = 'ST_Polygon'::text );
21.16.2. GEOMETRY_COLUMNS表を投入
insert into geometry_columns values
      ('','public','cities','the_geom',2,4326,'POLYGON');
21.16.3. ジオメトリを追加する
select people.name,
       streets.name as street_name,
       st_astext(people.the_geom) as geometry
from   streets, people
where  people.street_id=streets.id;
結果::
     name     | street_name |   geometry
--------------+-------------+---------------
 Roger Jones  | High street |
 Sally Norman | High street |
 Jane Smith   | Main Road   |
 Joe Bloggs   | Low Street  |
 Fault Towers | Main Road   | POINT(33 -33)
(5 rows)
ご覧のとおり、私たちの制限ではデータベースへの null の追加を認めています。