8.3. Lesson: 地形解析
ある種のラスターからはそれが表す地形の洞察をより多く得ることができます。数値標高モデル(DEM)がこの点では特に有用です。このレッスンでは先ほどからの住宅開発案の調査地域についてより詳しく調べるのに地形解析ツールを使用します。
このレッスンの目標: 地形に関する詳細な情報を取得するために地形解析ツールを使用します。
8.3.1.  Follow Along: 陰影起伏を計算する
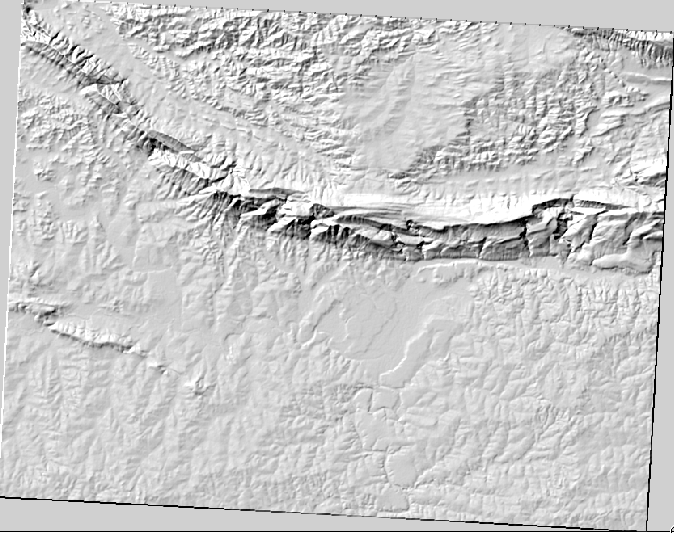
The DEM you have on your map right now does show you the elevation of the terrain, but it can sometimes seem a little abstract. It contains all the 3D information about the terrain that you need, but it doesn’t look like a 3D object. To get a better look at the terrain, it is possible to calculate a hillshade, which is a raster that maps the terrain using light and shadow to create a 3D-looking image.
To work with DEMs, you should use QGIS’ all-in-one DEM (Terrain models) analysis tool.
- Click on the menu item Raster ‣ Analysis ‣ DEM (Terrain models).
- In the dialog that appears, ensure that the Input file is the DEM layer.
- Set the Output file to hillshade.tif in the directory exercise_data/residential_development.
- Also make sure that the Mode option has Hillshade selected.
- Check the box next to Load into canvas when finished.
- You may leave all the other options unchanged.
- Click OK to generate the hillshade.
- When it tells you that processing is completed, click OK on the message to get rid of it.
- Click Close on the main DEM (Terrain models) dialog.
hillshade と呼ばれる新しいレイヤーが次のように表示されます:
きれいで3次元的に見えますが、これは改善できるでしょうか? 陰影図はそれだけでは石膏模型のように見えます。どうにかしてそれを他のよりカラフルなラスターと一緒に使用できないでしょうか? もちろんできます。オーバーレイとして陰影図を使用します。
8.3.2. Follow Along: 陰影図をオーバーレイとして使用する
陰影図は一日のある時点の日光について非常に有用な情報を提供することができますが審美的な目的で使うこともできます。それを使えば地図をよりよく見せることができます。陰影図をほとんど透過させる設定がその鍵となります。
Change the symbology of the original DEM to use the Pseudocolor scheme as in the previous exercise.
Hide all the layers except the DEM and hillshade layers.
Click and drag the DEM to be beneath the hillshade layer in the Layers list.
Set the hillshade layer to be transparent by opening its Layer Properties and go to the Transparency tab.
Set the Global transparency to 50%:
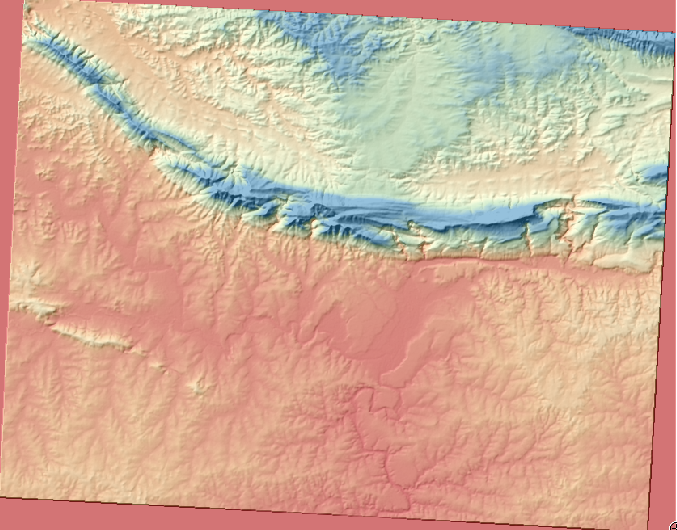
Click OK on the Layer Properties dialog. You’ll get a result like this:
Switch the hillshade layer off and back on in the Layers list to see the difference it makes.
このように陰影図を使用すると景観の地形を誇張することが可能です。その効果があなたにとって十分な強さだと思えない場合には、 hillshade レイヤーの透明度を変更すればよいですが、もちろん、陰影起伏がより明るくなるほど、その背後の色は薄暗くなります。ちょうど良いバランスを見つける必要があります。
Remember to save your map when you are done.
ノート
For the next two exercises, please use a new map. Load only the DEM raster dataset into it (exercise_data/raster/SRTM/srtm_41_19.tif). This is to simplify matters while you’re working with the raster analysis tools. Save the map as exercise_data/raster_analysis.qgs.
8.3.3.  Follow Along: 傾斜の計算
地形の傾斜がどれほど急であるかを知るのも有用なことです。たとえば、土地に家を建てたい場合には比較的平坦な土地が必要です。
To do this, you need to use the Slope mode of the DEM (Terrain models) tool.
Open the tool as before.
Select the Mode option Slope:
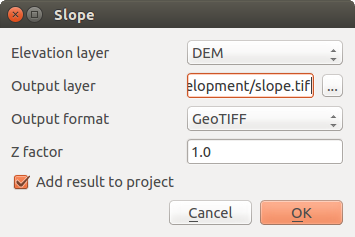
Set the save location to exercise_data/residential_development/slope.tif
Enable the Load into canvas... checkbox.
Click OK and close the dialogs when processing is complete, and click Close to close the dialog. You’ll see a new raster loaded into your map.
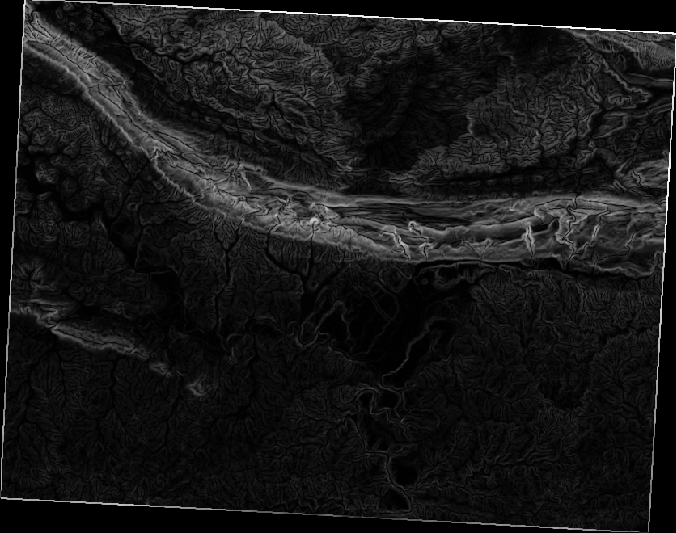
With the new raster selected in the Layers list, click the Stretch Histogram to Full Dataset button. Now you’ll see the slope of the terrain, with black pixels being flat terrain and white pixels, steep terrain:
8.3.4. Try Yourself calculating the aspect
The aspect of terrain refers to the direction it’s facing in. Since this study is taking place in the Southern Hemisphere, properties should ideally be built on a north-facing slope so that they can remain in the sunlight.
- Use the Aspect mode of the DEM (Terain models) tool to calculate the aspect of the terrain.
8.3.5. Follow Along: ラスター計算機の使用
不動産仲介業者の問題を振り返ってみましょう。この前 ベクター分析 レッスンの中で取り組みました。買い手は建物を購入してその地所に小さなコテージを建てたいとしましょう。私たちは南半球では開発に理想的な小地所は北向きで傾斜が5度未満の場所であることを知っています。しかし、もし傾斜が2度未満の場合、斜面方位は重要ではありません。
幸いにも、あなたは既に斜面方位だけではなく傾斜を示すラスターを持っていますが、両方の条件が同時に満たされている場所を知る方法がありません。この分析はどのように行うことができるでしょうか?
その答えは ラスター計算機 です。
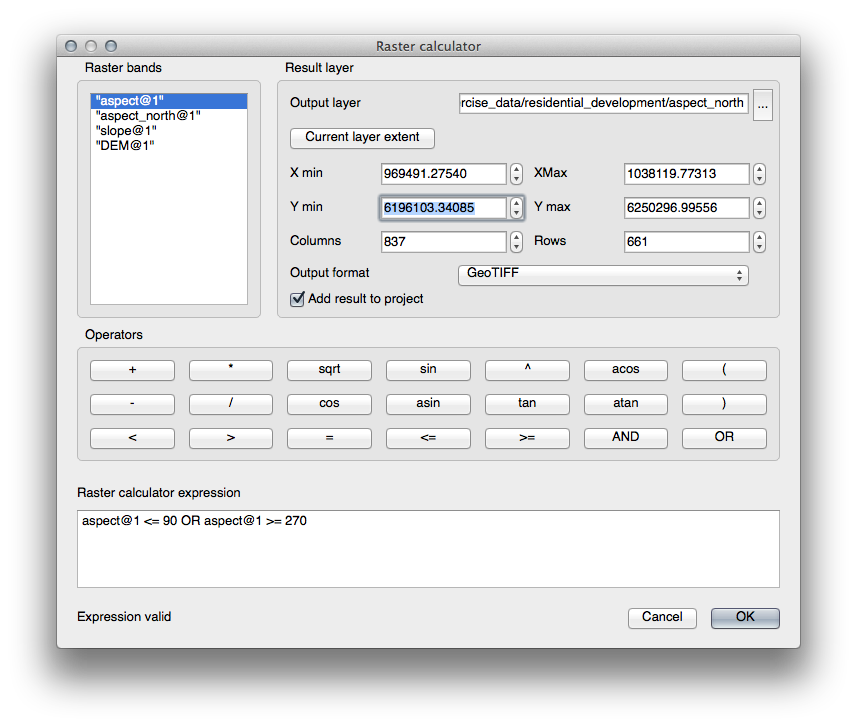
- Click on Raster > Raster calculator... to start this tool.
- To make use of the aspect dataset, double-click on the item aspect@1 in the Raster bands list on the left. It will appear in the Raster calculator expression text field below.
North is at 0 (zero) degrees, so for the terrain to face north, its aspect needs to be greater than 270 degrees and less than 90 degrees.
In the Raster calculator expression field, enter this expression:
aspect@1 <= 90 OR aspect@1 >= 270
Set the output file to aspect_north.tif in the directory exercise_data/residential_development/.
Ensure that the box Add result to project is checked.
Click OK to begin processing.
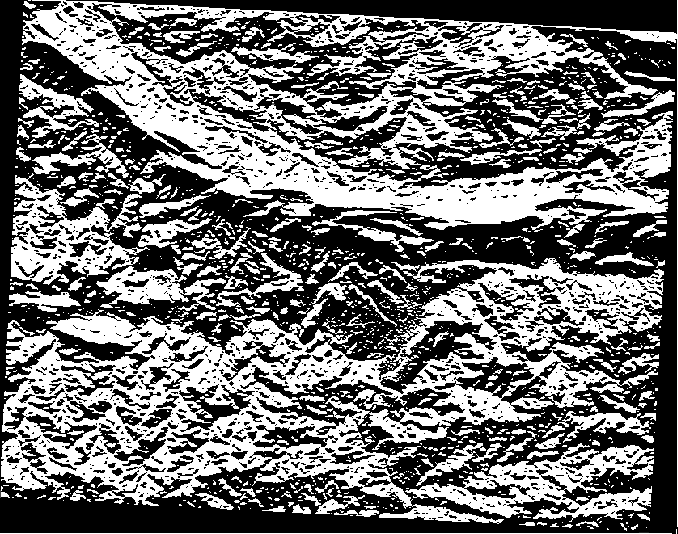
あなたの結果はこのようになります:
8.3.6. Try Yourself
斜面方位の次は DEM レイヤーの新しい2つの独立した分析を行います。
- The first will be to identify all areas where the slope is less than or equal to 2 degrees.
- The second is similar, but the slope should be less than or equal to 5 degrees.
- Save them under exercise_data/residential_development/ as slope_lte2.tif and slope_lte5.tif.
8.3.7. Follow Along: ラスター分析結果を組み合わせる
今、あなたは DEM レイヤーから作られた3つの新しいラスターを持っています:
aspect_north: 地形が北に面している
slope_lte2: 斜面傾斜が2度以下
slope_lte2: 斜面傾斜が5度以下
Where the conditions of these layers are met, they are equal to 1. Elsewhere, they are equal to 0. Therefore, if you multiply one of these rasters by another one, you will get the areas where both of them are equal to 1.
満たされるべき条件は、5度以下の傾斜で地形は北に面していなければならない。しかし、2度以下の斜面では地形の方位は問題ではない。
Therefore, you need to find areas where the slope is at or below 5 degrees AND the terrain is facing north; OR the slope is at or below 2 degrees. Such terrain would be suitable for development.
これらの抽出条件を満たすエリアを計算します:
Open your Raster calculator again.
Use the Raster bands list, the Operators buttons, and your keyboard to build this expression in the Raster calculator expression text area:
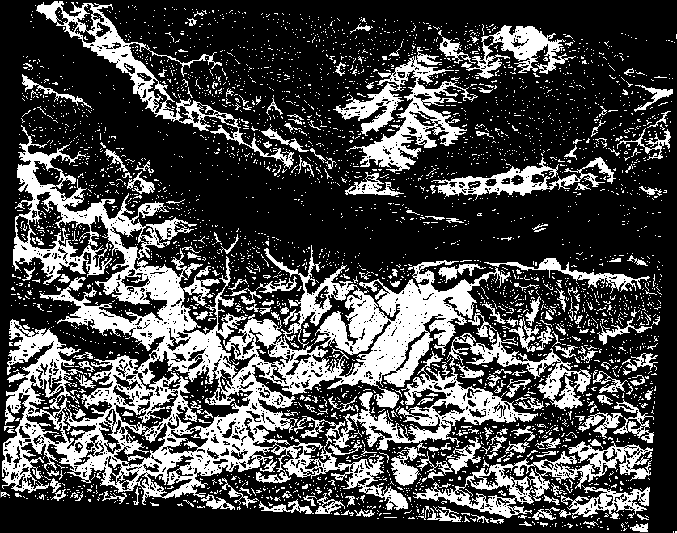
( aspect_north@1 = 1 AND slope_lte5@1 = 1 ) OR slope_lte2@1 = 1
Save the output under exercise_data/residential_development/ as all_conditions.tif.
Click OK on the Raster calculator. Your results:
8.3.8. Follow Along: ラスターを簡素化する
上の画像からわかるように、複合解析は条件を満たしている多くの非常に小さなエリアを残しました。しかし、これらは何かを建築するには小さすぎるので私たちの解析にとって本当に有用ではありません。小さく使用できないエリアをすべて取り除きましょう。
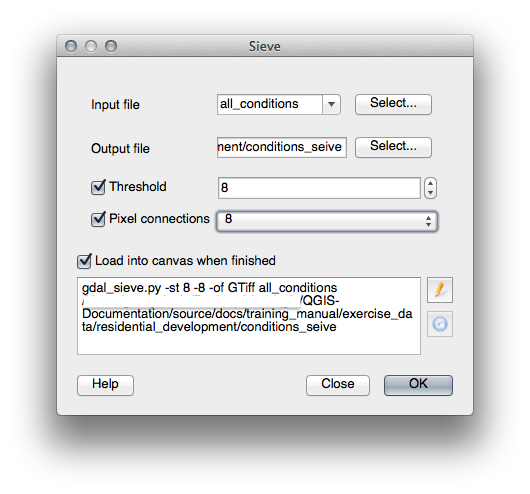
- Open the Sieve tool (Raster ‣ Analysis ‣ Sieve).
- Set the Input file to all_conditions, and the Output file to all_conditions_sieve.tif (under exercise_data/residential_development/).
- Set both the Threshold and Pixel connections values to 8, then run the tool.
Once processing is done, the new layer will load into the canvas. But when you try to use the histogram stretch tool to view the data, this happens:
どうなっているのでしょうか? 答えは新しいラスターファイルのメタデータにあります。
- View the metadata under the Metadata tab of the Layer Properties dialog. Look in the Properties section at the bottom.
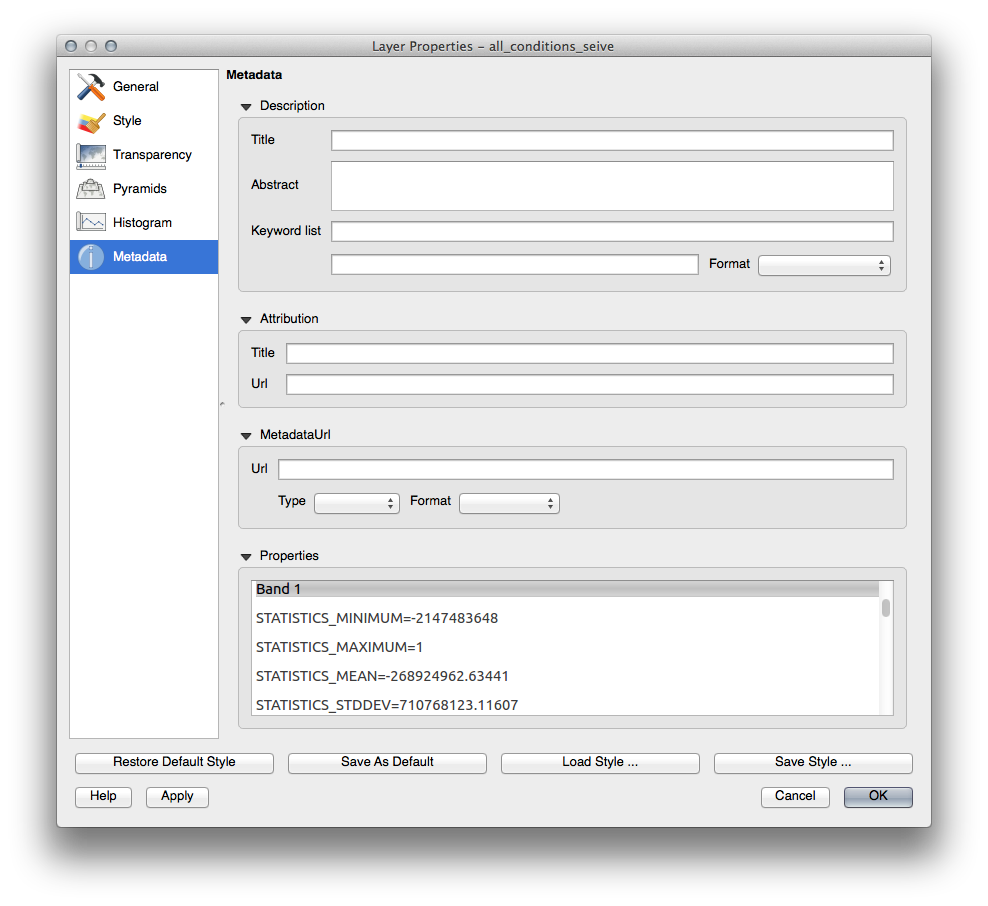
Whereas this raster, like the one it’s derived from, should only feature the values 1 and 0, it has the STATISTICS_MINIMUM value of a very large negative number. Investigation of the data shows that this number acts as a null value. Since we’re only after areas that weren’t filtered out, let’s set these null values to zero.
Open the Raster Calculator again, and build this expression:
(all_conditions_sieve@1 <= 0) = 0
This will maintain all existing zero values, while also setting the negative numbers to zero; which will leave all the areas with value 1 intact.
Save the output under exercise_data/residential_development/ as all_conditions_simple.tif.
出力はこのようになります:
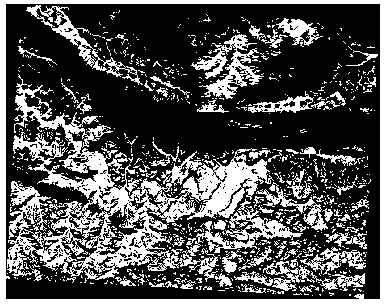
これは期待されたもので、以前の結果を簡素化したものです。あなたが得た結果が期待したものでない場合は、メタデータ(および該当する場合はベクターの属性)を見ると問題を解決するための要点がわかることを覚えておいて下さい。
8.3.9. In Conclusion
You’ve seen how to derive all kinds of analysis products from a DEM. These include hillshade, slope and aspect calculations. You’ve also seen how to use the raster calculator to further analyze and combine these results.
8.3.10. What’s Next?
2つの分析結果が得られました:潜在的に適した小地所を示すベクター分析の結果と潜在的に適した地形を示すラスター分析の結果です。この問題の最終的な結果に到達するためにどのようにこれらを組み合わせるか?それが次のレッスンのトピックです。次のモジュールで始まります。