Fontos
A fordítás közösségi munka, amihez itt tud csatlakozni. Ennek az oldalnak eddig 100.00%-a van lefordítva.
17. 3D csempék
17.1. Mik azok a 3D csempék?
A 3D-csempe nagy méretű 3D-s térinformatikai adathalmazok streamelésére és megjelenítésére szolgáló specifikáció. Hierarchikus struktúrát használ a 3D-tartalmak hatékony kezelésére és megjelenítésére, és dinamikusan tölti be a megfelelő részletességi szinteket a teljesítmény optimalizálása érdekében. Ez a technológia széles körben elterjedt a várostervezésében, az építészetben, a szimulációkban, a játékokban és a virtuális valóságban, és szabványosított, interoperábilis megoldást kínál komplex földrajzi adatok vizualizálására.
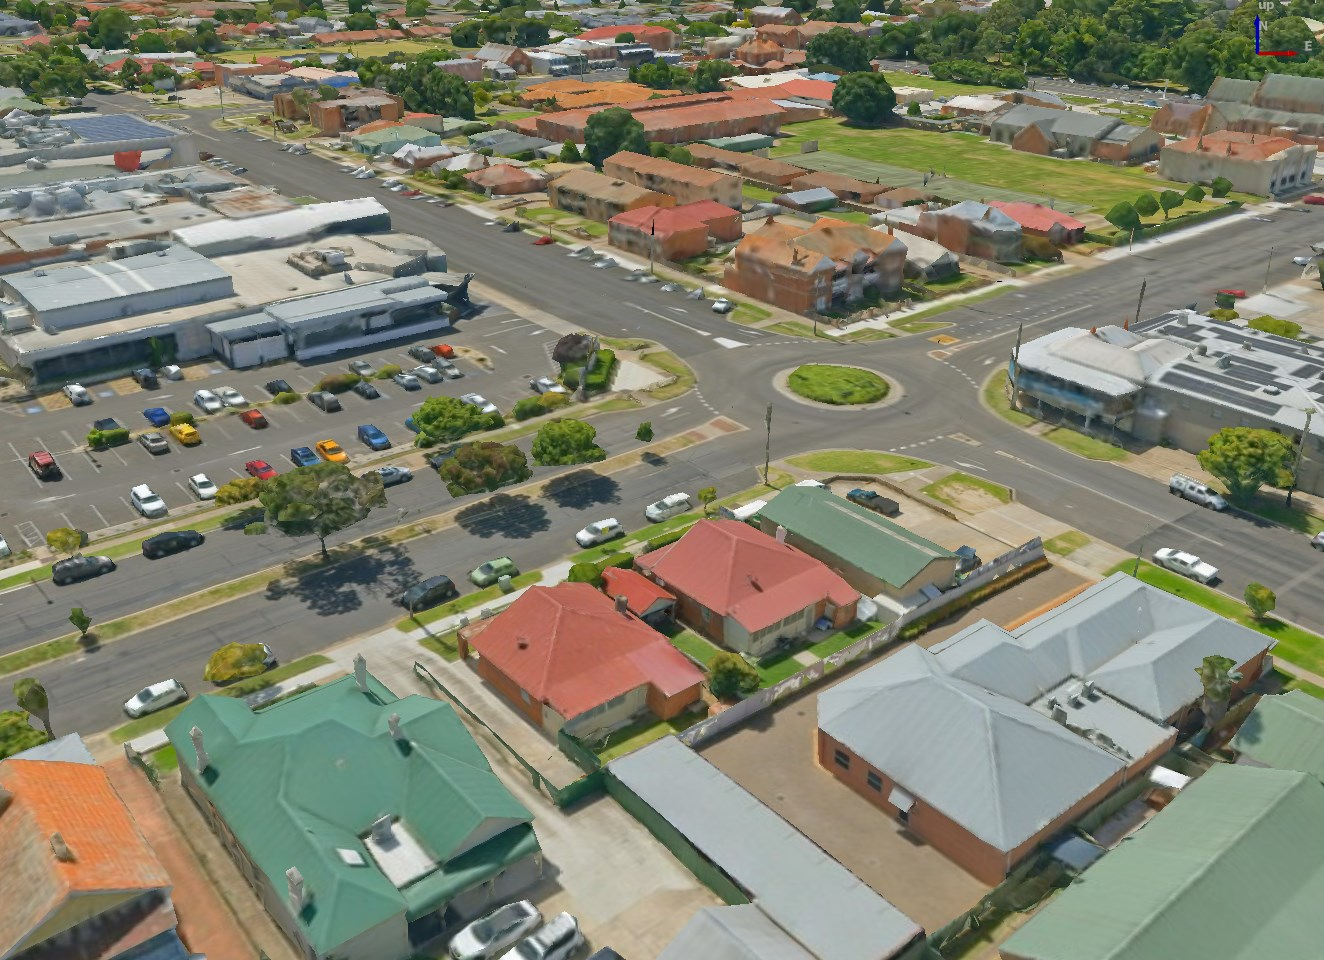
17.1. ábra Példa 3D csempékre
Jelenleg a QGIS kétféle 3D csempeformátumot támogat:
A Cesium 3D csempéket, elsősorban épületek vagy egész városok komplex 3D-modelljeihez használják. Az ilyen adathalmazokat felhőalapú platformok, például a Cesium Ion vagy a Google (Photorealistic 3D Tiles) biztosíthatják.
Kvantált hálócsempék, terepmagassági adatokhoz használatos.
Az adatok QGIS-hez való hozzáadásának módjáról szóló útmutatóért lásd: ref:3d_tiles.
17.2. 3D csempék tulajdonságai
A 3D csempék Rétegtulajdonságok párbeszédablakában a következő szakaszok láthatóak:
|
||
|
|
|


[1] Elérhetőek a Rétegstílus panelről is
17.2.1. Információs fül
Az Információ fül csak olvasható, és tömör összefoglalást ad az aktuális rétegről és metaadatairól. A következő információk láthatóak rajta:
a réteg szolgáltatójától függően: név, URL, forrás típusa és útvonala, zoomszintek száma
egyéni tulajdonságok, amelyekkel további információkat tárolható a rétegről az aktuális projektben. További tulajdonságok hozhatók létre és kezelhetők PyQGIS segítségével, különösen a setCustomProperty() metódus segítségével.
a koordináta-rendszer: neve, mértékegysége, módszere, pontossága, alappontja (statikus vagy dinamikus)
a kitöltött metaadatok közül válogatva: hozzáférés, terjedelem, hivatkozások, névjegyek, előzmények…
17.2.2. Forrás fül
A  Forrás lap alapvető információkat jelenít meg a kiválasztott 3D csempéről, többek között:
a Réteg neve, ami megjelenik a Rétegek panelen;
a Koordináta-rendszer: Megjeleníti a réteg Koordináta rendszerét (CRS). A réteg CRS-ét a legördülő listából egy nemrég használt CRS kiválasztásával vagy a
 Koordináta-rendszer kiválasztása gombra kattintva változtathatja meg (lásd Koordináta-rendszer választó). Ezt az eljárást csak akkor használja, ha a réteg CRS-e rossz vagy nincs megadva..
17.2.3. Jelrendszer lap
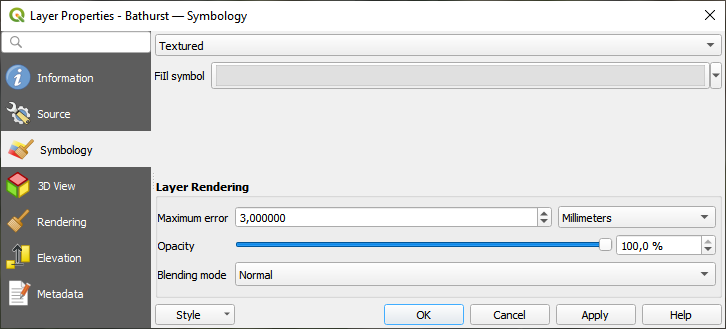
17.2. ábra Egy 3D csemperéteg jelrendszere
Alapértelmezés szerint a réteg textúrával van stílusozva, de a legördülő menüből kiválasztva a Drótváz opciót megváltoztathatja, hogy a háttérben látható drótvázszerű hálót lássa. A vektoros poligonokhoz hasonlóan a háló kitöltését és vonalszimbólumait is megváltoztathatja. A  Textúraszínek használata jelölőnégyzet bejelölésével minden hálóelem a teljes textúra átlagértékével jelenik meg. Ez egy jó lehetőség, ha nagy adathalmazokkal dolgozik, és gyors áttekintést szeretne kapni az adatokról.
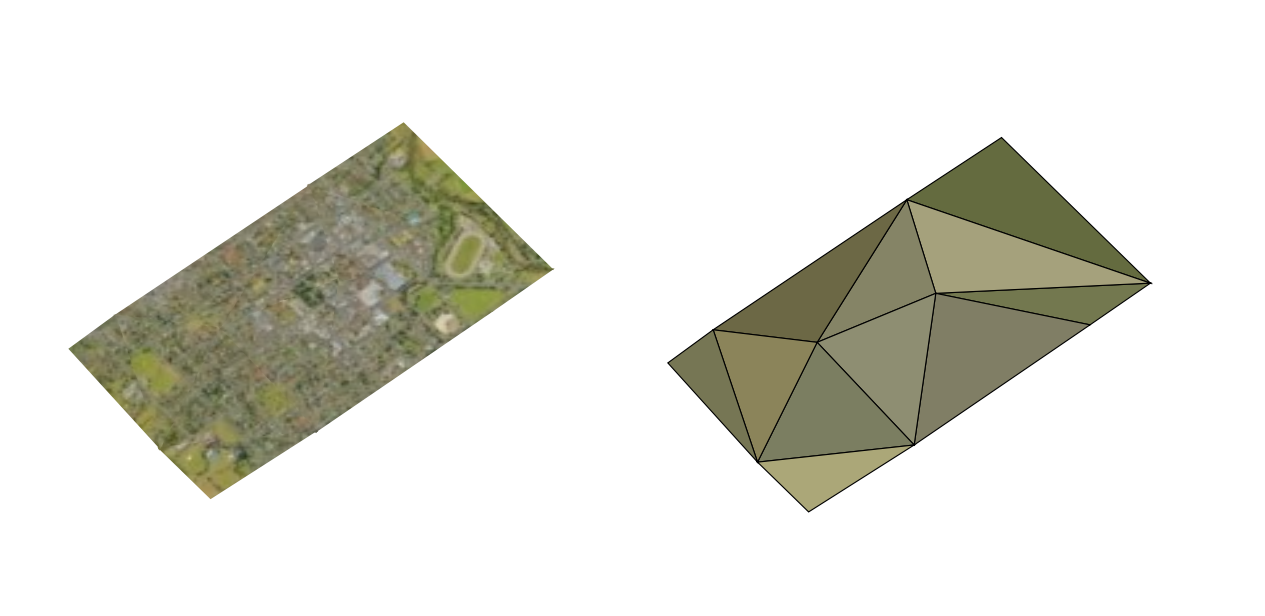
17.3. ábra 3D csempék – textúrázva és drótvázzal
Az adatok megtekintéséhez nyisson meg egy  Új 3D térkép nézetet.
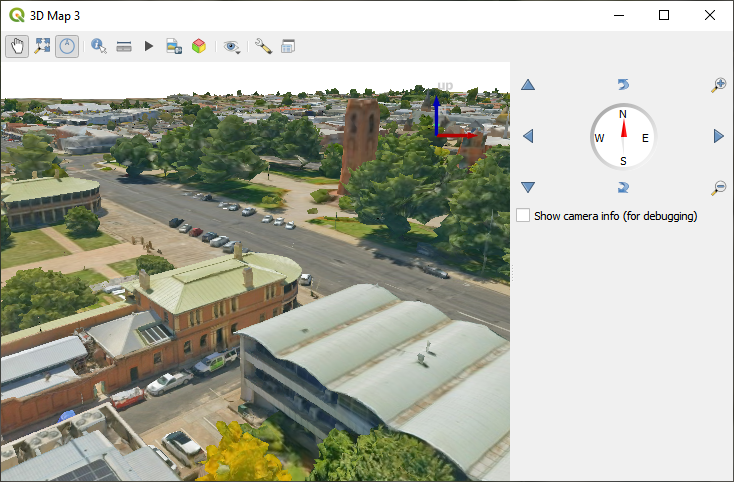
17.4. ábra 3D térképnézet
A Jelrendszer fülön is elvégezhet pár beállítást, amelyek minden esetben a réteg összes elemére hatnak:
Maximális hiba: Ez a paraméter határozza meg a 3D-modellben megjelenített részletesség szintjét. A pontfelhőkhöz hasonlóan a 3D csempék is gyakran több információt tartalmaznak, mint amennyi a vizuális ábrázoláshoz szükséges. Ezzel a beállítással szabályozhatja a megjelenítési sűrűség és a renderelési sebesség közötti egyensúlyt. Egy nagyobb érték (pl. 5 mm) észrevehető résekkel járhat az elemek között, míg egy kisebb érték (pl. 0,1 mm) túlzott részletességű rendereléshez vezethet, ami lelassíthatja a renderelési folyamatot. A beállítások egyéni igényekre szabásához különböző mértékegységek választhatók.
Átlátszatlanság: Ezzel az eszközzel állíthatja be az alatta lévő rétegek láthatóságát a térképvásznon. A csúszkával a saját igényeinek megfelelően állíthatja be a jelenetréteg láthatóságát. Alternatív megoldásként a csúszka melletti mezőben adhatja meg a láthatóság pontos, százalékos értékét.
Keverési mód: Ezekkel az eszközökkel olyan különleges megjelenítési hatásokat érhet el, amelyeket korábban csak a grafikus programokból ismerhetett. Az átfedő és az alatta lévő rétegek pixelei a Keverési módok pontban leírtak szerint lesznek keverve.
17.2.4. 3D nézet tulajdonságai
A Maximális képernyőterületi hiba meghatározza a terepcsempék részletesebbre cserélésének küszöbértékét (és fordítva), vagyis hogy a 3D nézet milyen hamar kezdjen nagyobb felbontású csempéket használni. Kisebb szám részletgazdagabb jelenetet eredményez az összetettebb megjelenítés rovására.
A
 Befoglaló téglalapok megjelenítése megjeleníti a terepcsempék 3D-s befoglaló téglalapjait (hasznos a tereppel kapcsolatos hibák elhárításához).
17.2.5. Megjelenítési tulajdonságok
A Méretarányfüggő láthatóság alatt beállíthatja a Maximum (magába foglaló) és Minimum (kizáró) méretarányt, meghatározva vele azt a méretarány-tartományt, amin belül az elemek megjelennek. Ezen a tartományon kívül rejtve lesznek. A  Beállítás a térképvászon aktuális méretarányára gomb segít az aktuális térképvászon méretarányát használni a tartomány láthatóságának határaként. Lásd még: Méretarányfüggő láthatóság választó.
17.2.6. Magassági beállítások
A  Magasság lap biztosít lehetőséget a réteg magassági tulajdonságainak kezelésére 3D térképnézetben. Konkrétan beállíthatja:
Magassági felszín: hogyan kell értelmezni a 3D réteg csúcsainak Z értékeit a terep magasságaként. Megadható egy Skálázási tényező és egy Eltolás.
17.2.7. Metaadat tulajdonságok
A  Metaadatok lapon lehetőség nyílik metaadat-jelentés létrehozására és szerkesztésére a rétegen. További információért lásd: Metaadatok.