11.1. 2D Map View
The 2D map view (also called Map canvas) is the central place where maps are displayed.
QGIS opens by default with a single map view (called main map),
showing layers in 2D, and tightly bound to the Layers panel.
That window reflects the rendering (symbology, labeling, visibilities…)
you applied to the loaded layers.
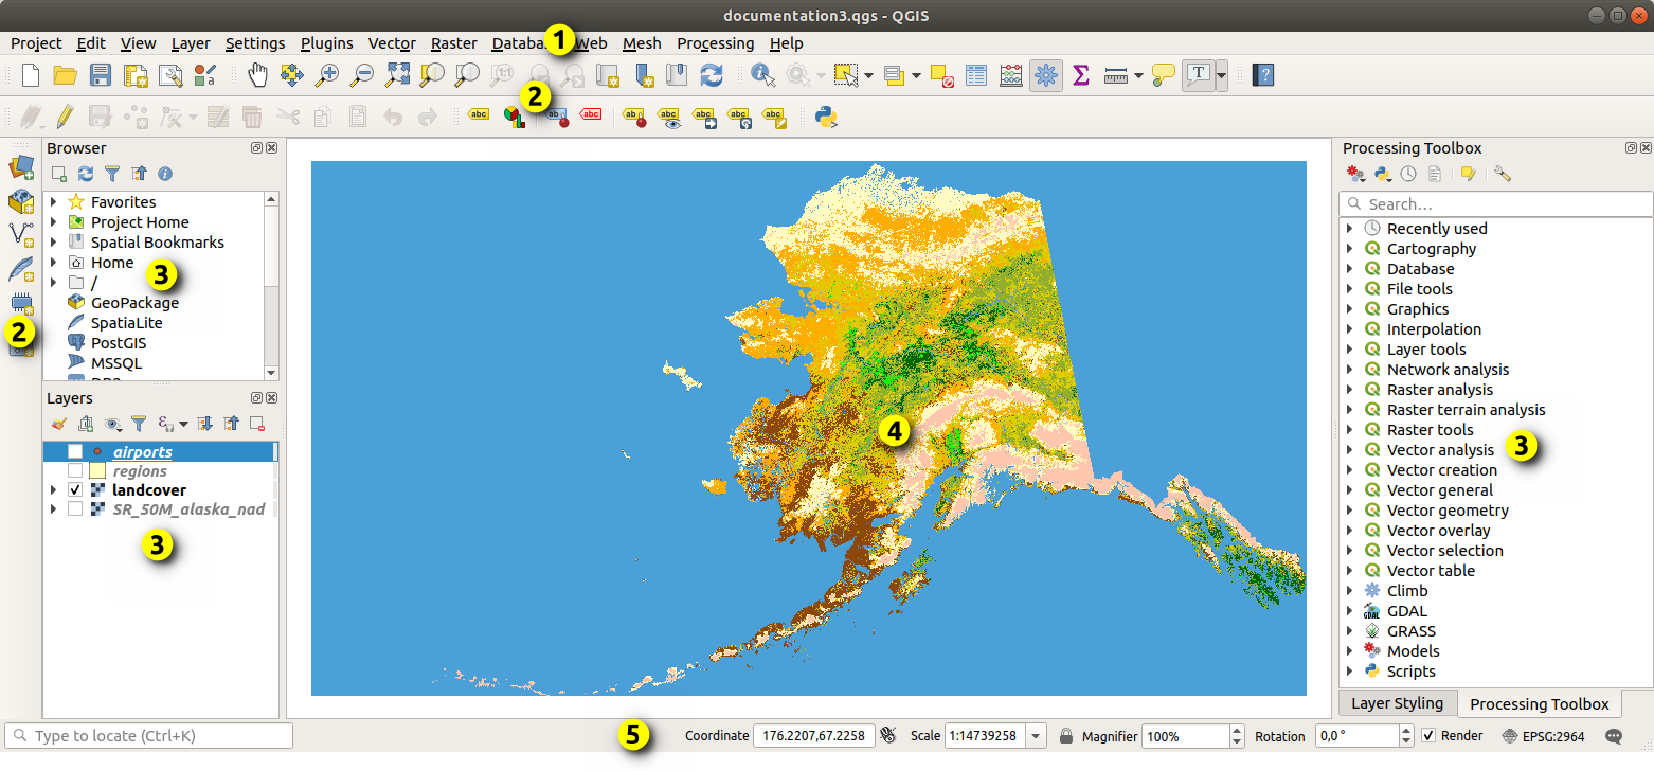
Рис. 11.1 QGIS GUI
11.1.1. Exploring the map view
When you add a layer (see e.g. Opening Data), QGIS automatically looks for its CRS. If a different CRS is set by default for the project (see Project Coordinate Reference Systems) then the layer extent is «on-the-fly» translated to that CRS, and the map view is zoomed to that extent if you start with a blank QGIS project. If there are already layers in the project, no map canvas resize is performed, so only features falling within the current map canvas extent will be visible.
Click on the map view and you should be able to interact with it, panning or zooming to different areas of the map. Dedicated tools are provided in the Navigation Toolbar and in the menu, with handful shortcuts from the keyboard or the mouse buttons.
Инструмент |
Использование |
|---|---|
|
|
|
|
|
|
|
Pan the map to the selected features of all the selected layers in the Layers panel. |
|
Zoom to the selected features of all the selected layers in the Layers panel. Also available in the layer contextual menu |
|
Zoom to the extent of all the selected layers in the Layers panel. Also available in the layer contextual menu |
|
Zoom to the extent of all the layers in the project or to the project full extent. |
|
Zoom the map to the previous extent in history. |
|
Zoom the map to the next extent in history. |
|
Zoom the map to a level where one pixel of the active raster layer covers one screen pixel. Also available in the layer contextual menu |
Mouse wheel |
|
Keyboard |
|


Right-click over the map and you should be able to  Copy coordinates of the clicked point in the map CRS, in WGS84
or in a custom CRS. The copied information can then be pasted in an expression,
a script, text editor or spreadsheet…
Copy coordinates of the clicked point in the map CRS, in WGS84
or in a custom CRS. The copied information can then be pasted in an expression,
a script, text editor or spreadsheet…
11.1.2. Controlling map rendering
By default, QGIS renders all visible layers whenever the map canvas is refreshed. The events that trigger a refresh of the map canvas include:
changing the visibility of a layer
modifying symbology of a visible layer
adding a layer
panning or zooming
resizing the QGIS window
QGIS allows you to control the rendering process in a number of ways.
at the global level
per layer, using e.g. the scale dependent rendering
or with dedicated tools in the GUI.
To stop the map drawing, press the Esc key. This will halt the refresh of the map canvas and leave the map partially drawn. It may however take a bit of time after pressing Esc for the map drawing to halt.
To suspend rendering, click the  Render checkbox in the
bottom-right corner of the status bar. When Render
is unchecked, QGIS does not redraw the canvas in response to any of
the usual triggers mentioned earlier. Examples of when you
might want to suspend rendering include:
Render checkbox in the
bottom-right corner of the status bar. When Render
is unchecked, QGIS does not redraw the canvas in response to any of
the usual triggers mentioned earlier. Examples of when you
might want to suspend rendering include:
adding many layers and symbolizing them prior to drawing
adding one or more large layers and setting scale dependency before drawing
adding one or more large layers and zooming to a specific view before drawing
any combination of the above
Включение флажка Отрисовка активирует отрисовку и немедленно обновляет содержимое карты.
11.1.3. Time-based control on the map canvas
QGIS can handle temporal control on loaded layers, i.e. modify the map canvas rendering based on a time variation. To achieve this, you need:
Layers that have dynamic temporal properties set. QGIS supports temporal control for different data providers, with custom settings. It’s mainly about setting the time range in which the layer would display:
raster layers: controls whether to display or not the layer.
WMTS layers: controls whether the data should be rendered based on a static time range or following a dynamic temporal range
vector layers: features are filtered based on time values associated to their attributes
mesh layers: displays dynamically the active dataset groups values
When dynamic temporal options are enabled for a layer, an
 icon is displayed next to the layer in the Layers panel to remind
you that the layer is temporally controlled.
Click the icon to update the temporal settings.
icon is displayed next to the layer in the Layers panel to remind
you that the layer is temporally controlled.
Click the icon to update the temporal settings.Enable the temporal navigation of the map canvas using the Temporal controller panel. The panel is activated:
using the
 Temporal controller panel icon located in the
Map Navigation toolbar
Temporal controller panel icon located in the
Map Navigation toolbaror from the menu
11.1.3.1. The temporal controller panel
The Temporal controller panel has the following modes:
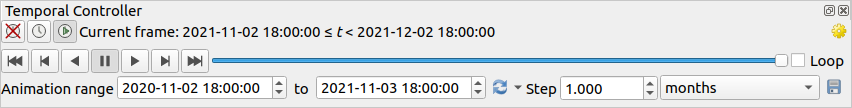
Рис. 11.2 Temporal Controller Panel in navigation mode
 Turn off temporal navigation: all the
temporal settings are disabled and visible layers are rendered as usual
Turn off temporal navigation: all the
temporal settings are disabled and visible layers are rendered as usual Fixed range temporal navigation:
a time range is set and only layers (or features) whose temporal range
overlaps with this range are displayed on the map.
Fixed range temporal navigation:
a time range is set and only layers (or features) whose temporal range
overlaps with this range are displayed on the map. Animated temporal navigation:
a time range is set, split into steps, and only layers (or features)
whose temporal range overlaps with each frame are displayed on the map
Animated temporal navigation:
a time range is set, split into steps, and only layers (or features)
whose temporal range overlaps with each frame are displayed on the map Settings for general control of the animation
Frames rate: number of steps that are shown per second
 Cumulative range: all animation frames will
have the same start date-time but different end dates and times.
This is useful if you wish to accumulate data in your temporal
visualization instead of showing a ‘moving time window’ across your data.
Cumulative range: all animation frames will
have the same start date-time but different end dates and times.
This is useful if you wish to accumulate data in your temporal
visualization instead of showing a ‘moving time window’ across your data.
11.1.3.2. Animating a temporal navigation
An animation is based on a varying set of visible layers at particular times within a time range. To create a temporal animation:
Toggle on the
Animated temporal
navigation, displaying the animation player widgetEnter the Time range to consider. Using the
 button, this can be defined as:
Set to full range of all the time enabled layers
Set to preset project range as defined in the project properties
Set to single layer’s range taken from a time-enabled layer
Fill in the time Step to split the time range. Different units are supported, from
secondstocenturies. Asource timestampsoption is also available as step: when selected, this causes the temporal navigation to step between all available time ranges from layers in the project. It’s useful when a project contains layers with non-contiguous available times, such as a WMS-T service which provides images that are available at irregular dates. This option will allow you to only step between time ranges where the next available image is shown.Click the
 button to preview the animation.
QGIS will generate scenes using the layers rendering at the set times.
Layers display depends on whether they overlap any individual time frame.
button to preview the animation.
QGIS will generate scenes using the layers rendering at the set times.
Layers display depends on whether they overlap any individual time frame.
Рис. 11.3 Temporal navigation through a layer
The animation can also be previewed by moving the time slider. Checking the
Loop checkbox will repeatedly run the
animation while clicking stops a running animation.
A full set of video player buttons is available.Horizontal scrolling using the mouse wheel (where supported) with the cursor on the map canvas will also allow you to navigate, or “scrub”, the temporal navigation slider backwards and forwards.
Click the
 Export animation button if you want to generate
a series of images representing the scene. They can be later combined in a
video editor software:
Export animation button if you want to generate
a series of images representing the scene. They can be later combined in a
video editor software: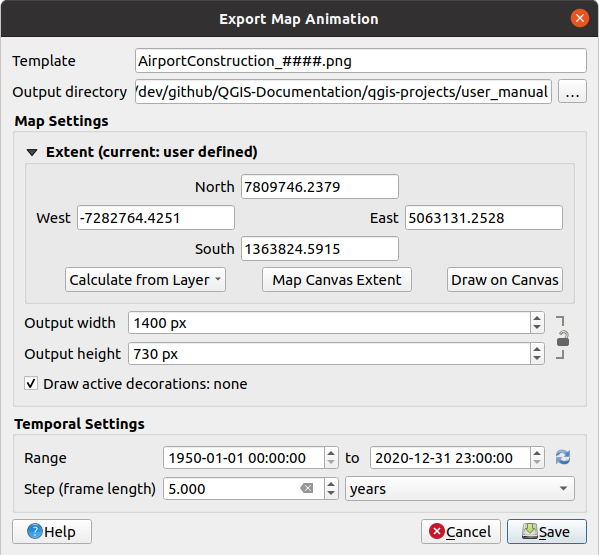
Рис. 11.4 Exporting map canvas animation scenes to images
The filename Template: the
####are replaced with frame sequence numberThe Output directory
Under Map settings, you can:
redefine the spatial extent to use
control the Resolution of the image (Output width and Output height)
Draw active decorations: whether active decorations should be kept in the output
Under Temporal settings, you can redefine:
the time Range for the animation
the Step (frame length) in the unit of your choice
11.1.4. Bookmarking extents on the map
Spatial Bookmarks allow you to «bookmark» a geographic location and return to it later. By default, bookmarks are saved in the user’s profile (as User Bookmarks), meaning that they are available from any project the user opens. They can also be saved for a single project (named Project Bookmarks) and stored within the project file, which can be helpful if the project is to be shared with other users.
11.1.4.1. Создание закладки
Для создания закладки:
Zoom and pan to the area of interest.
Select the menu option
 ,
press Ctrl+B or right-click the
,
press Ctrl+B or right-click the  Spatial
Bookmarks entry in
the Browser panel and select New Spatial Bookmark.
The Bookmark Editor dialog opens.
Spatial
Bookmarks entry in
the Browser panel and select New Spatial Bookmark.
The Bookmark Editor dialog opens.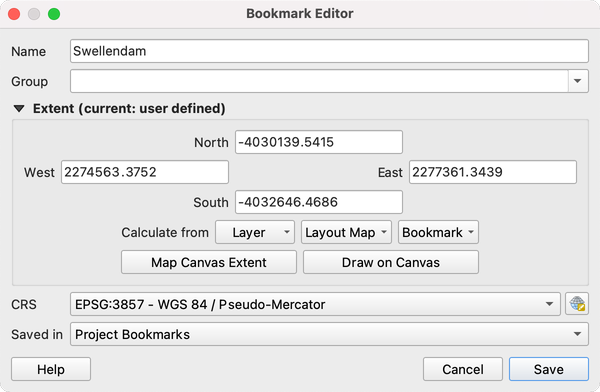
Рис. 11.5 The Bookmark Editor Dialog
Enter a descriptive name for the bookmark
Enter or select a group name in which to store related bookmarks
Select the extent of the area you wish to save, using the extent selector widget
Indicate the CRS to use for the extent
Select whether the bookmark will be Saved in User Bookmarks or Project Bookmarks (by default, this drop-down list is set to User Bookmarks)
Press Save to add the bookmark to the list
Помните, что можно иметь множество закладок с одинаковыми названиями.
11.1.4.2. Работа с закладками
To use and manage bookmarks, you can either use the Spatial Bookmarks panel or Browser.
Select or press Ctrl+7
to open the Spatial Bookmarks Manager panel.
Select
or Ctrl+Shift+B to show
the Spatial Bookmarks entry in the
Browser panel.
You can perform the following tasks:
Task |
Spatial Bookmark Manager |
Browser |
|---|---|---|
Zoom to a Bookmark |
Double-click on it, or select the bookmark and press the
|
Double-click on it, drag and drop it to the map canvas, or right-click the bookmark and select Zoom to Bookmark. |
Delete a bookmark |
Select the bookmark and click the |
Right-click the bookmark and select Delete Spatial Bookmark. Confirm your choice. |
Export bookmarks to XML |
Click the |
Select one or more folders (user or project) or subfolders (groups),
then right-click and select |
Import bookmarks from XML |
Click the |
Right-click the Spatial Bookmarks entry or one of its folders (user or
project) or subfolders (groups) to determine where to import the
bookmarks, then select |
Edit bookmark |
You can change a bookmark by changing the values in the table. You can edit the name, the group, the extent and if it is stored in the project or not. |
Right-click the desired bookmark and select Edit Spatial Bookmark…. The Bookmark Editor will open, allowing you to redefine every aspect of the bookmark as if you were creating it for the first time. You can also drag and drop the bookmark between folders (user and project) and subfolders (groups). |


You can also zoom to bookmarks by typing the bookmark name in the locator.
11.1.5. Decorating the map
Decorations include Grid, Title Label, Copyright Label, Image, North Arrow, Scale Bar and Layout Extents. They are used to „decorate“ the map by adding cartographic elements.
11.1.5.1. Сетка
 Grid allows you to add a coordinate grid and coordinate
annotations to the map canvas.
Grid allows you to add a coordinate grid and coordinate
annotations to the map canvas.
Select menu option to open the dialog.
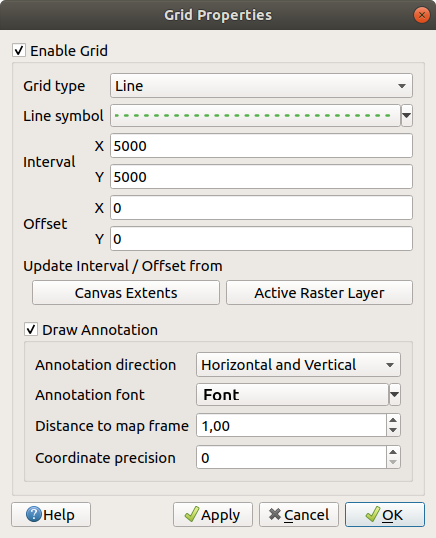
Рис. 11.6 The Grid Dialog
Tick
Enable grid and set grid
definitions according to the layers loaded in the map canvas:The Grid type: it can be Line or Marker
The associated Line symbol or marker symbol used to represent the grid marks
The Interval X and Interval Y between the grid marks, in map units
An Offset X and Offset Y distance of the grid marks from the bottom left corner of the map canvas, in map units
The interval and offset parameters can be set based on the:
Canvas Extents: generates a grid with an interval that is approximatively 1/5 of the canvas width
Active Raster Layer resolution
Tick
Draw annotations to display the coordinates of
the grid marks and set:The Annotation direction, ie how the labels would be placed relative to their grid line. It can be:
Horizontal or Vertical for all the labels
Horizontal and Vertical, ie each label is parallel to the grid mark it refers to
Boundary direction, ie each label follows the canvas boundary, and is perpendicular to the grid mark it refers to
The Annotation font (text formatting, buffer, shadow…) using the font selector widget
The Distance to map frame, margin between annotations and map canvas limits. Convenient when exporting the map canvas eg to an image format or PDF, and avoid annotations to be on the «paper» limits.
The Coordinate precision
Click Apply to verify that it looks as expected or OK if you’re satisfied.
11.1.5.2. Title Label
 Title Label allows you to decorate your map with a Title.
To add a Title Label decoration:
Select menu option to open the dialog.
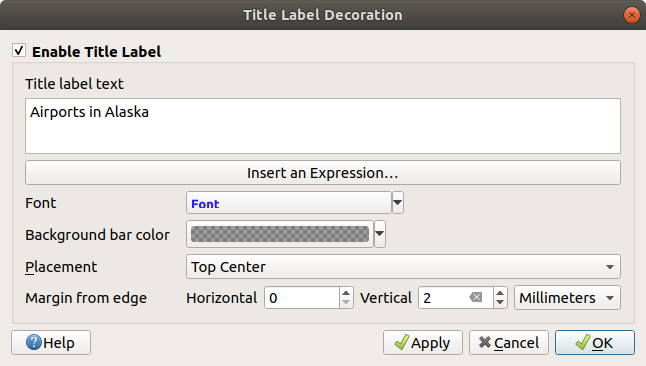
Рис. 11.7 The Title Decoration Dialog
Make sure
Enable Title Label is checkedEnter the title text you want to place on the map. You can make it dynamic using the Insert or Edit an Expression… button.
Choose the Font for the label using the font selector widget with full access to QGIS text formatting options. Quickly set the font color and opacity by clicking the black arrow to the right of the font combo box.
Select the color to apply to the title’s Background bar color.
Choose the Placement of the label in the canvas: options are Top left, Top Center (default), Top Right, Bottom left, Bottom Center and Bottom Right.
Refine the placement of the item by setting a horizontal and/or vertical Margin from Edge. These values can be in Millimeters or Pixels or set as a Percentage of the width or height of the map canvas.
Click Apply to verify that it looks as expected or OK if you’re satisfied.
11.1.5.3. Copyright Label
 Copyright Label can be used to decorate your
map with a Copyright label.
Copyright Label can be used to decorate your
map with a Copyright label.
To add this decoration:
Select menu option to open the dialog.
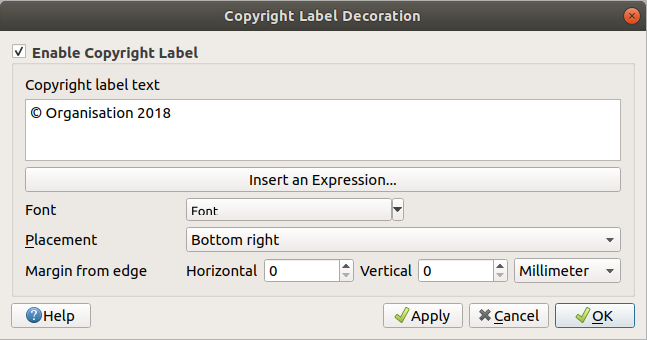
Рис. 11.8 The Copyright Decoration Dialog
Make sure
Enable Copyright Label is checkedEnter the copyright text you want to place on the map. You can make it dynamic using the Insert or Edit an Expression… button.
Choose the Font for the label using the font selector widget with full access to QGIS text formatting options. Quickly set the font color and opacity by clicking the black arrow to the right of the font combo box.
Choose the Placement of the label in the canvas: options are Top left, Top Center, Top Right, Bottom left, Bottom Center, and Bottom Right (default for Copyright decoration)
Refine the placement of the item by setting a horizontal and/or vertical Margin from Edge. These values can be in Millimeters or Pixels or set as a Percentage of the width or height of the map canvas.
Click Apply to verify that it looks as expected or OK if you’re satisfied.
11.1.5.4. Image Decoration
 Image allows you to add an image (logo, legend, ..) on the map canvas.
To add an image:
Select menu option to open the dialog.
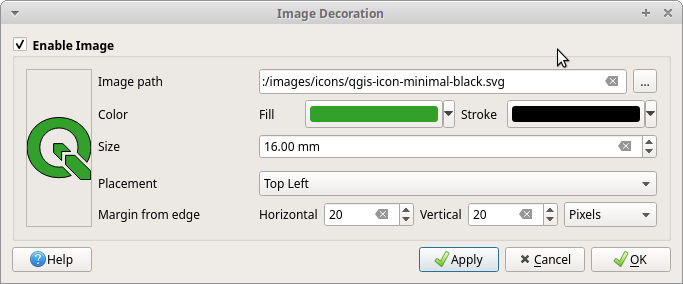
Рис. 11.9 The Image Decoration Dialog
Make sure
Enable Image is checkedSelect a bitmap (e.g. png or jpg) or SVG image using the … Browse button
If you have chosen a parameter enabled SVG then you can also set a Fill or Stroke (outline) color. For bitmap images, the color settings are disabled.
Set a Size of the image in mm. The width of selected image is used to resize it to given Size.
Choose where you want to place the image on the map canvas with the Placement combo box. The default position is Top Left.
Set the Horizontal and Vertical Margin from (Canvas) Edge. These values can be set in Millimeters, Pixels or as a Percentage of the width or height of the map canvas.
Click Apply to verify that it looks as expected and OK if you’re satisfied.
11.1.5.5. Указатель «север-юг»
![]() North Arrow allows you to add a north arrow on the map canvas.
North Arrow allows you to add a north arrow on the map canvas.
To add a north arrow:
Select menu option to open the dialog.
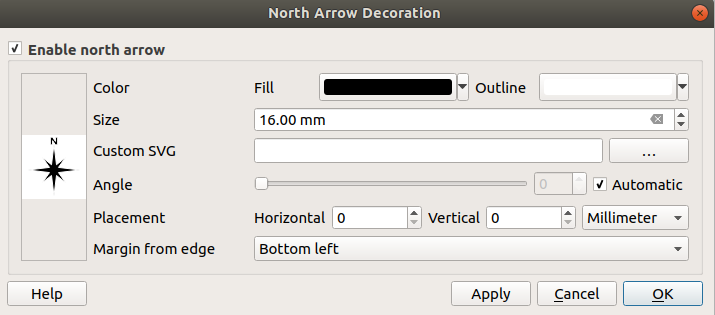
Рис. 11.10 The North Arrow Dialog
Make sure
Enable north arrow is checkedOptionally change the color and size, or choose a custom SVG
Optionally change the angle or choose Automatic to let QGIS determine the direction
Optionally choose the placement from the Placement combo box
Optionally refine the placement of the arrow by setting a horizontal and/or vertical Margin from (Canvas) Edge. These values can be in Millimeters or Pixels or set as a Percentage of the width or height of the map canvas.
Click Apply to verify that it looks as expected and OK if you’re satisfied.
11.1.5.6. Масштабная линейка
 Scale Bar adds a simple scale bar to the map canvas.
You can control the style and placement, as well as the labelling of the bar.
Scale Bar adds a simple scale bar to the map canvas.
You can control the style and placement, as well as the labelling of the bar.
QGIS only supports displaying the scale in the same units as your map frame. So, if the units of your project’s CRS are meters, you can’t create a scale bar in feet. Likewise, if you are using decimal degrees, you can’t create a scale bar to display distance in meters.
Для добавления масштабной линейки:
Select menu option to open the dialog
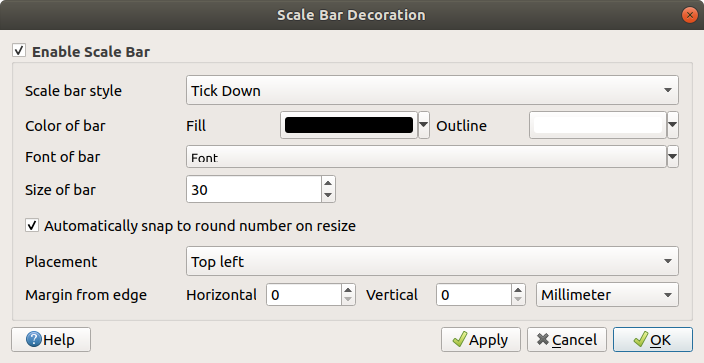
Рис. 11.11 The Scale Bar Dialog
Make sure
Enable scale bar is checkedChoose a style from the Scale bar style
 combo box
Select the Color of bar
 by choosing
a fill color (default: black) and an outline color (default: white). The scale
bar fill and outline can be made opaque by clicking on the down arrow to the right
of the color input.
by choosing
a fill color (default: black) and an outline color (default: white). The scale
bar fill and outline can be made opaque by clicking on the down arrow to the right
of the color input.Select the font for the scale bar from the Font of bar
combo boxSet the Size of bar

Optionally check
Automatically snap to round number
on resize to display easy-to-read valuesChoose the placement from the Placement
combo boxYou can refine the placement of the item by setting a horizontal and/or vertical Margin from (Canvas) Edge. These values can be in Millimeters or Pixels or set as a Percentage of the width or height of the map canvas.
Click Apply to verify that it looks as expected or OK if you’re satisfied.
11.1.5.7. Layout Extents
 Layout Extents adds the extents of map item(s) in print
layout(s) to the canvas. When enabled, the extents of all map items within all print layouts are
shown using a lightly dotted border labeled with the name of the print layout and map item.
You can control the style and labeling of the displayed layout extents.
This decoration is useful when you are tweaking the positioning of map elements such as labels,
and need to know the actual visible region of print layouts.
Layout Extents adds the extents of map item(s) in print
layout(s) to the canvas. When enabled, the extents of all map items within all print layouts are
shown using a lightly dotted border labeled with the name of the print layout and map item.
You can control the style and labeling of the displayed layout extents.
This decoration is useful when you are tweaking the positioning of map elements such as labels,
and need to know the actual visible region of print layouts.
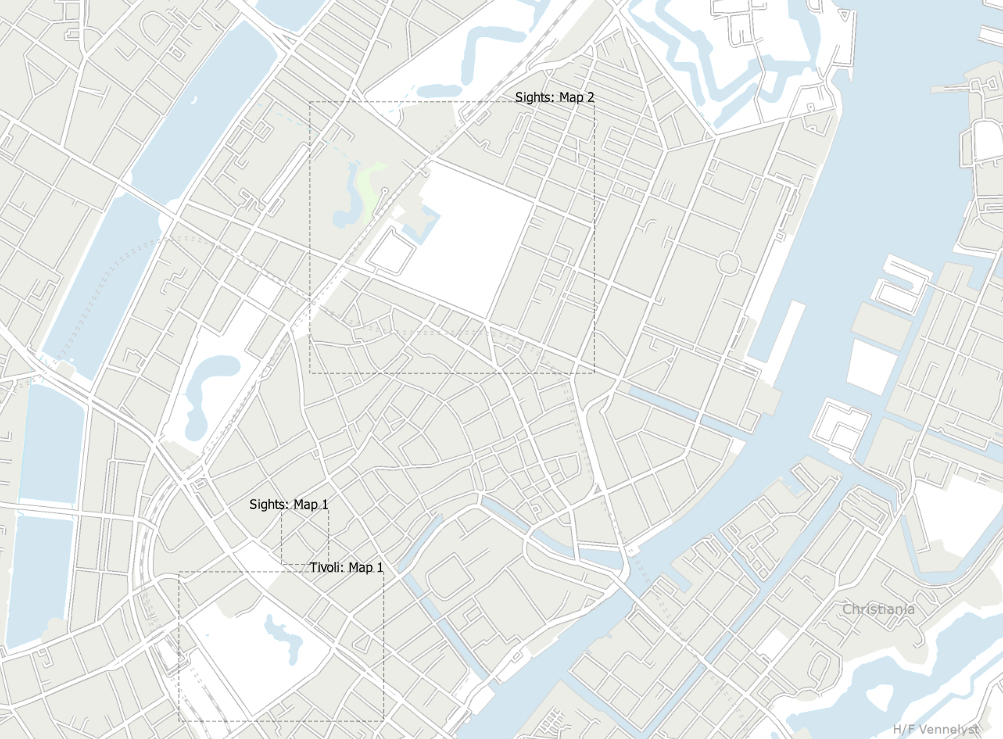
Рис. 11.12 Example of layout extents displayed in a QGIS project with two print layouts. The print layout named „Sights“ contains two map items, while the other print layout contains one map item.
To add layout extent(s):
Select to open the dialog
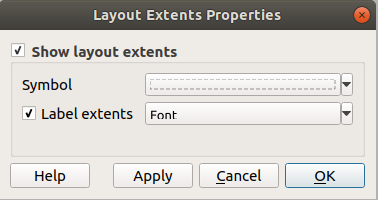
Рис. 11.13 The Layout Extents Dialog
Make sure
Show layout extents is checked.Optionally change the symbol and labeling of the extents.
Click Apply to verify that it looks as expected and OK if you’re satisfied.
Совет
Decorations Settings
When you save a QGIS project file, any changes you have made to Grid, North Arrow, Scale Bar, Copyright and Layout Extents will be saved in the project and restored the next time you load the project.
11.1.6. Инструменты аннотации
Annotations are another type of elements added onto the map canvas to provide additional information that can not be depicted by the rendered layers. Unlike labels that rely on attribute values stored in vector layers, annotations are independent details, stored within the project file itself.
Two families of annotations are available in QGIS:
Feature annotations: they are actual georeferenced features of text, marker, line or polygon type stored within a special layer type called «annotation layer». They are tied to a particular geographic location, meaning that moving your map, changing the scale or changing projection won’t cause your annotations to jump around the map. Rather, they’ll be locked in place to the location you’ve drawn them.
Balloon annotations: these are individuals annotations of text, form or image type placed inside a bubble. They can be associated to any layer for their visibility, are drawn on top of the map canvas. The size is dependent from the map canvas scale, and its position can be anchored.
Совет
Layout the map with annotations
You can print or export annotations with your map to various formats using:
map canvas export tools available in the menu
print layout, in which case you need to check Draw map canvas items in the corresponding map item properties
The Annotations Toolbar provides a set of tools to create and interact with both families of annotations.
Инструмент |
Использование |
Scope |
|
Create a new layer to store annotations |
Feature annotations |
Main Annotation Layer Properties |
Control settings of the Main Annotation Layer |
|
|
Select, move, resize and modify symbology properties of annotations |
|
|
Create an annotation as a polygon feature |
|
|
Create an annotation as a polyline feature |
|
|
Create an annotation as a point feature |
|
|
Create an annotation as a text label |
|
|
Select and create a text formatted annotation |
Balloon annotations |
|
Select and create annotation with an |
|
|
Select and create annotation showing an |
|
|
Select and create annotation showing attributes of a vector layer in a custom form file |
|
|
Adjust size and position of annotation element |
11.1.6.1. Feature Annotations
Feature annotations are stored in annotation layers. Unlike conventional layers, an annotation layer is available only in the current project and can contain features of different types (text, marker, line, polygon). The layer has no attributes and no symbology associated, but instead each feature can be symbolized on an item-by-item basis, through Layer Styling panel.
Two types of annotation layer are available in QGIS:
A common Annotation Layer: you can create one using the
 New Annotation Layer tool. It is listed
in the Layers panel, allowing you to control its features“
visibility, move it to show above or below particular layers in your map,
like any common layer.
Double-click the layer and you can access its properties.
New Annotation Layer tool. It is listed
in the Layers panel, allowing you to control its features“
visibility, move it to show above or below particular layers in your map,
like any common layer.
Double-click the layer and you can access its properties.The Main Annotation Layer: By default, this is where annotations are stored when no annotation layer is available in the project or is selected at creation time. This layer is always drawn on the very top of your map and you won’t see it listed in the Layers panel alongside the other layers in your project, meaning that its features are always visible. The Main Annotation Layer Properties entry on the Annotations toolbar helps you open its properties dialog.
Interaction
The Feature annotations have dedicated tools for creation depending on their type:
 Create Polygon Annotation
 Create Line Annotation
 Create Marker Annotation
 Create Text Annotation at Point
All the usual QGIS shortcuts for creating features apply when creating annotation items. A line or polygon annotation is drawn by left-clicking once for each vertex, with a final right mouse click to complete the shape. Snapping can be enabled while you draw, you can use the Advanced Digitizing Tools to precisely place vertices, and even switch the drawing tools to the streaming mode for completely free-form shapes.
Unlike common layers, an annotation layer does not need to be active before you
select its features. Simply grab the  Modify Annotations tool and
you will be able to interact with any feature annotation:
Modify Annotations tool and
you will be able to interact with any feature annotation:
Selection: simply left-click on the annotation
Moving: Left click on a selected annotation item to start moving it. A right-click or pressing Esc key cancels the move, while a second left click will confirm the move. The displacement can also be controlled pressing the cursor keys:
Shift+key for big movement
Alt+key for
1 pxmovement
Geometry modification: for line or polygon annotations, left-click on a vertex of the geometry, move and click again. Double-click a segment to add a new vertex.
Delete: Pressing the Del or Backspace key while an annotation is selected will delete that annotation
Feature symbology
A selected annotation will display its Symbology properties in the Layer styling panel. You can:
modify the appearance using full capabilities of the symbol or the text format (including the text itself), depending on the type.
configure a Reference scale
set a Z index
modify some of the Layer rendering settings
Layer Properties
The properties dialog of an annotation layer provides the following tabs:
Information: a read-only dialog representing an interesting place to quickly grab summarized information and metadata on the current layer.
Source: defines general settings for the annotation layer. You can:
Set a Layer name that will be used to identify the layer in the project (in the Layers Panel, with expressions, …)
Display the layer’s Assigned Coordinate Reference System (CRS): you can change the layer’s CRS, selecting a recently used one in the drop-down list or clicking on
 Select CRS button
(see Coordinate Reference System Selector). Use this process only if the CRS applied to the
layer is a wrong one or if none was applied.
Select CRS button
(see Coordinate Reference System Selector). Use this process only if the CRS applied to the
layer is a wrong one or if none was applied.
Rendering:
You can set the Maximum (inclusive) and Minimum (exclusive) scale, defining a range of scale in which features will be visible. Out of this range, they are hidden. The
 Set to current canvas scale button helps you use the current map
canvas scale as boundary of the range visibility.
See Visibility Scale Selector for more information.
Set to current canvas scale button helps you use the current map
canvas scale as boundary of the range visibility.
See Visibility Scale Selector for more information.Opacity: You can make the underlying layer in the map canvas visible with this tool. Use the slider to adapt the visibility of your vector layer to your needs. You can also make a precise definition of the percentage of visibility in the menu beside the slider.
Blending mode at the Layer level: You can achieve special rendering effects with these tools that you may previously only know from graphics programs. The pixels of your overlaying and underlying layers are mixed through the settings described in Blending Modes.
Apply paint effects on all the layer features with the Draw Effects button.
Some of these options are accessible from the feature annotation Symbology properties.
11.1.6.2. Balloon annotations
You can add balloon annotations through menu or from the Annotations Toolbar:
 Text Annotation for custom formatted text
 HTML Annotation to place the content of an
 htmlfile SVG Annotation to add an
 SVGsymbol Form Annotation: useful to display attributes
of a vector layer in a customized
Form Annotation: useful to display attributes
of a vector layer in a customized uifile (see Рис. 11.14). This is similar to the custom attribute forms, but displayed in an annotation item. Also see this video https://www.youtube.com/watch?v=0pDBuSbQ02o&feature=youtu.be&t=2m25s from Tim Sutton for more information.
 Move Annotation to adjust annotation element size or position
(using click and drag)
Move Annotation to adjust annotation element size or position
(using click and drag)
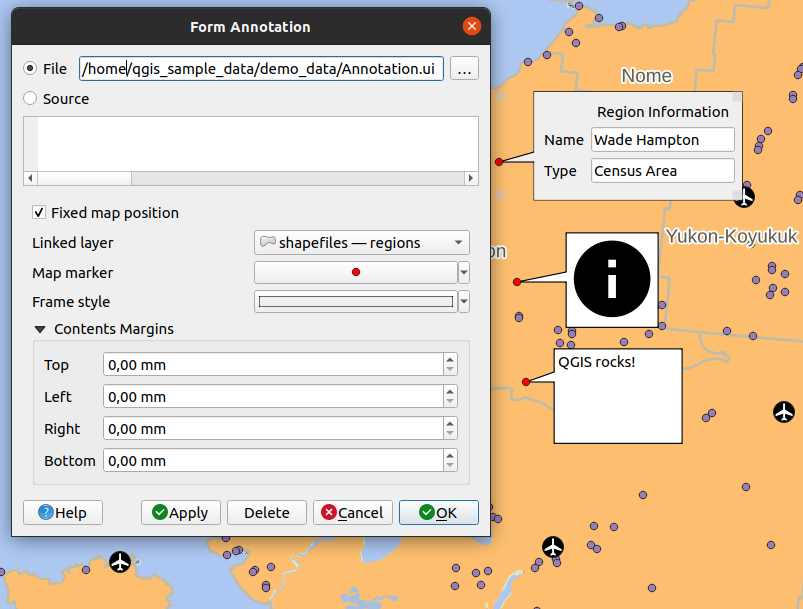
Рис. 11.14 Examples of balloon annotations
To add a balloon annotation, select the corresponding tool and click on the map canvas. An empty balloon is added. Double-click on it and a dialog opens with various options. This dialog is almost the same for all the annotation types:
At the top, a file selector to fill with the path to an
html,svgoruifile depending on the type of annotation. For text annotation, you can enter your message in a text box and set its rendering with the normal font tools.- Fixed map position: when unchecked, the balloon placement
is based on a screen position (instead of the map), meaning that it’s always shown
regardless the map canvas extent.
Linked layer: associates the annotation with a map layer, making it visible only when that layer is visible.
Map marker: using QGIS symbols, sets the symbol to display at the balloon anchor position (shown only when Fixed map position is checked).
Frame style: sets the frame background color, transparency, stroke color or width of the balloon using QGIS symbols.
Contents margins: sets interior margins of the annotation frame.
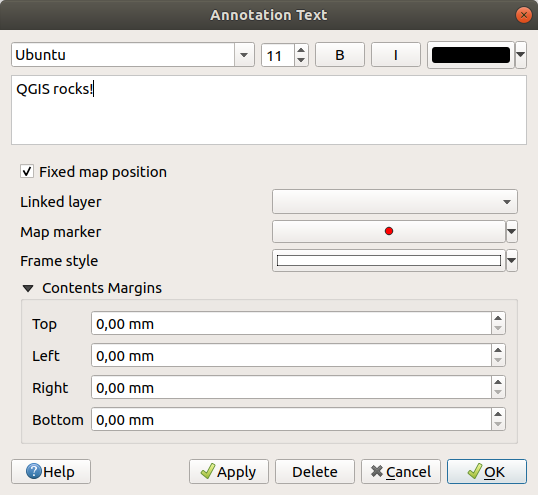
Рис. 11.15 A ballon annotation text dialog
Annotations can be selected when an annotation tool is enabled. They can then be
moved by map position (by dragging the map marker) or by moving only the balloon.
The Move Annotation tool also allows you to move the
balloon on the map canvas.
To delete an annotation, select it and either press the Del or Backspace button, or double-click it and press the Delete button in the properties dialog.
Примечание
If you press Ctrl+T while a balloon Annotation tool (move annotation, text annotation, form annotation) is active, the visibility states of the items are inverted.
11.1.7. Измерения
11.1.7.1. Применение
QGIS provides four means of measuring geometries:
interactive measurement tools

measuring in the
 Field Calculator
derived measurements in the Identifying Features tool
the vector analysis tool:
Measuring works within projected coordinate systems (e.g., UTM) and unprojected data. The first three measuring tools behave equally to global project settings:
Unlike most other GIS, the default measurement metric is ellipsoidal, using the ellipsoid defined in . This is true both when geographic and projected coordinate systems are defined for the project.
If you want to calculate the projected/planimetric area or distance using cartesian maths, the measurement ellipsoid has to be set to «None/Planimetric» (). However, with a geographic (ie unprojected) CRS defined for the data and project, area and distance measurement will be ellipsoidal.
However, neither the identify tool nor the field calculator will transform your data to the project CRS before measuring. If you want to achieve this, you have to use the vector analysis tool: . Here, measurement is planimetric, unless you choose the ellipsoidal measurement.
11.1.7.2. Measure length, areas, bearings and angles interactively
Click the icon in the Attribute toolbar to begin measurements.
The down arrow near the icon switches between
length,  area,
area,  bearing or
  angle.
The default unit used in the dialog is the one set in menu.
angle.
The default unit used in the dialog is the one set in menu.
For the Measure Line and the Measure Area the
measurements can be done in  Cartesian or
Ellipsoidal measure.
Cartesian or
Ellipsoidal measure.
Примечание
Configuring the measure tool
While measuring length or area, clicking the Configuration button at the bottom of the widget opens the menu, where you can select the rubberband color, the precision of the measurements and the unit behavior. You can also choose your preferred measurement or angle units, but keep in mind that those values are overridden in the current project by the selection made in the menu, and by the selection made in the measurement widget.
All measuring modules use the snapping settings from the digitizing module (see section Setting the snapping tolerance and search radius). So, if you want to measure exactly along a line feature, or around a polygon feature, first set its layer snapping tolerance. Now, when using the measuring tools, each mouse click (within the tolerance setting) will snap to that layer.
The Measure Line measures distances between given points.
The tool then allows you to click points on the map. Each segment length,
as well as the total, shows up in the measure window.
To stop measuring, click the right mouse button. Now it is possible
to copy all your line measurements at once to the clipboard using the
Copy All button.
Note that you can use the drop-down list near the total to change the measurement units interactively while working with the measure tool („Meters“, „Kilometers“, „Feet“, „Yards“, „Miles“, „Nautical miles“, „Centimeters“, „Millimeters“, „Degrees“, „Map units“). This unit is retained for the widget until a new project is created or another project is opened.
The Info section in the dialog explains how calculations are made according to the CRS settings available.
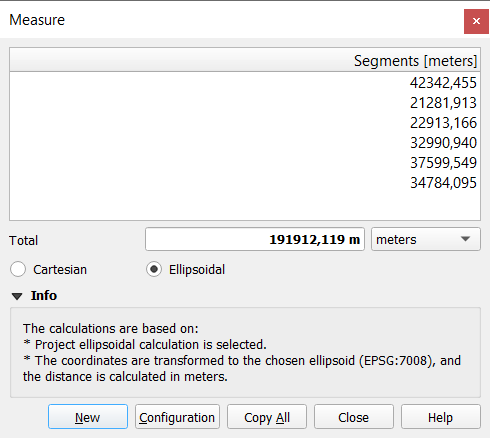
Рис. 11.16 Measure Distance
Measure Area: Areas can also be measured. In the
measure window, the accumulated area size appears. Right-click to stop drawing.
The Info section is also available as well as the ability to switch between
different area units („Square meters“, „Square kilometers“, „Square feet“, „Square yards“,
„Square miles“, „Hectares“, „Acres“, „Square centimeters“,
„Square millimeters“, „Square nautical miles“, „Square degrees“, „Map units“).
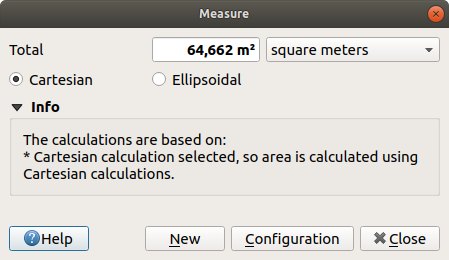
Рис. 11.17 Measure Area
Measure Bearing: You can also measure bearings. The
cursor becomes cross-shaped. Click to draw the first point of the bearing,
then move the cursor to draw the second point. The measurement
is displayed in a pop-up dialog.
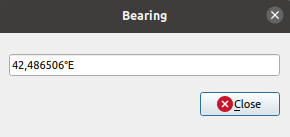
Рис. 11.18 Measure Bearing
Measure Angle: You can also measure angles. The
cursor becomes cross-shaped. Click to draw the first segment of the angle you
wish to measure, then move the cursor to draw the desired angle. The measurement
is displayed in a pop-up dialog.
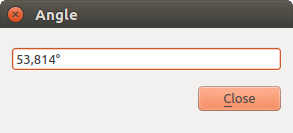
Рис. 11.19 Measure Angle
11.1.8. Setting additional map views
It is also possible to open additional map views whose content could diverge
from the Layers panel current state.
To add a new map view, go to  . A new floating widget, mimicking the main map
view’s rendering, is added to QGIS. You can add as many map views as you need.
They can be kept floating, placed side by side or stacked on top of each
other.
. A new floating widget, mimicking the main map
view’s rendering, is added to QGIS. You can add as many map views as you need.
They can be kept floating, placed side by side or stacked on top of each
other.
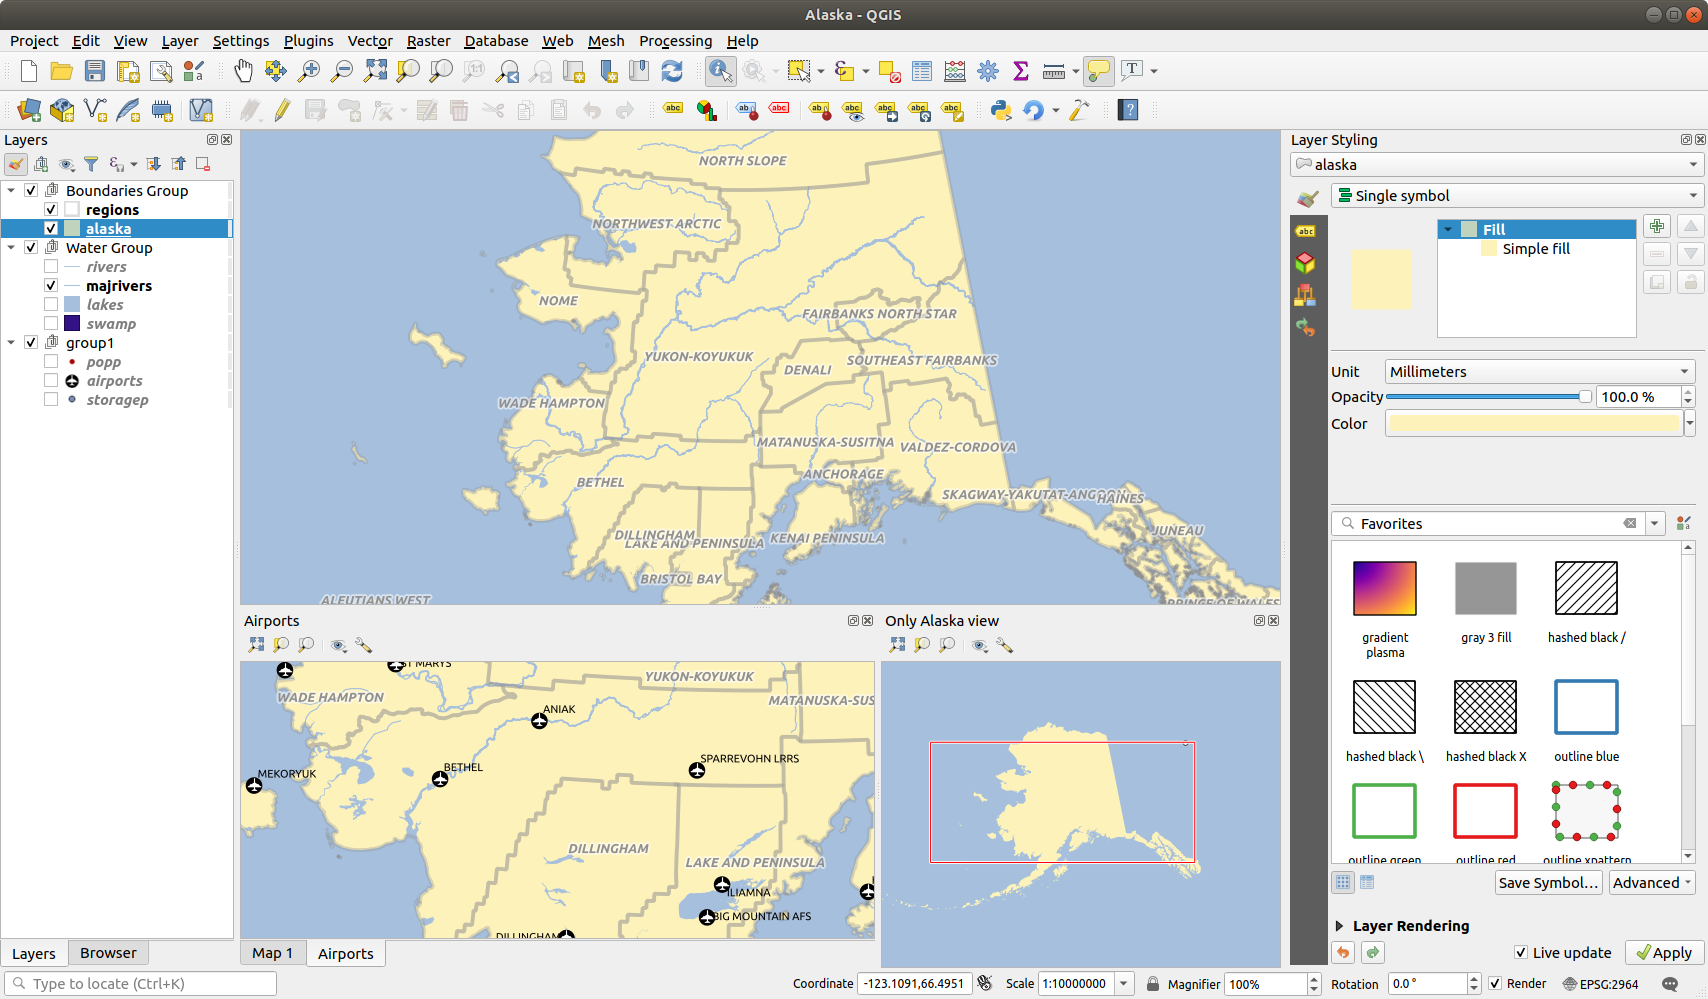
Рис. 11.20 Multiple map views with different settings
At the top of an additional map canvas, there’s a toolbar with the following capabilities:
 Zoom Full,
  Zoom to Selection
and
Zoom to Selection
and  Zoom to Layer(s) to navigate within the view
 Set View Theme to select the map theme
to display in the map view. If set to
Set View Theme to select the map theme
to display in the map view. If set to (none), the view will follow the Layers panel changes. View settings to configure the map view:
- Synchronize view center with main map:
syncs the center of the map views without changing the scale.
This allows you to have an overview style or magnified map which follows
the main canvas center.
 Synchronize view to selection: same as
zoom to selection
Synchronize view to selection: same as
zoom to selectionScale
Rotation
Magnification
- Synchronize scale with the main map scale.
A Scale factor can then be applied, allowing you to have
a view which is e.g. always 2x the scale of the main canvas.
- Show annotations
- Show cursor position
- Show main canvas extent
- Show labels: allows to hide labels regardless
they are set in the displayed layers“ properties
Change map CRS…
Rename view…
11.1.9. Exporting the map view
Maps you make can be layout and exported to various formats using the advanced capabilities of the print layout or report. It’s also possible to directly export the current rendering, without a layout. This quick «screenshot» of the map view has some convenient features.
To export the map canvas with the current rendering:
Go to
Depending on your output format, select either
 Export Map to Image…
or
 Export Map to PDF…
The two tools provide you with a common set of options. In the dialog that opens:
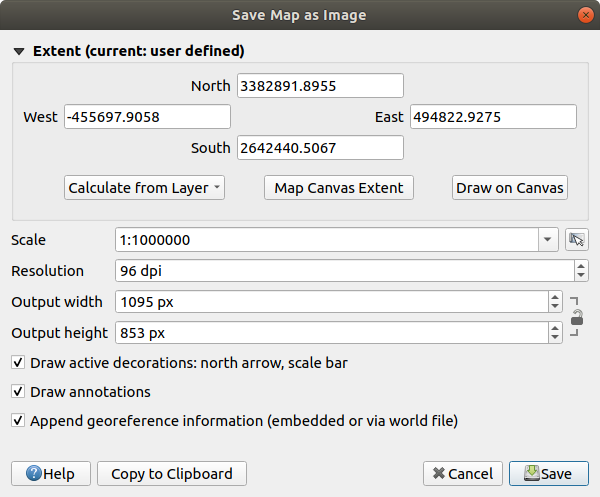
Рис. 11.21 The Save Map as Image dialog
Choose the Extent to export: it can be the current view extent (the default), the extent of a layer or a custom extent drawn over the map canvas. Coordinates of the selected area are displayed and manually editable.
Enter the Scale of the map or select it from the predefined scales: changing the scale will resize the extent to export (from the center).
Set the Resolution of the output
Control the Output width and Output height in pixels of the image: based by default on the current resolution and extent, they can be customized and will resize the map extent (from the center). The size ratio can be locked, which may be particularly convenient when drawing the extent on the canvas.
- Draw active decorations: in use
decorations (scale bar, title, grid, north
arrow…) are exported with the map
- Draw annotations to export any annotation
- Append georeference information (embedded or
via world file): depending on the output format, a world file of
the same name (with extension
PNGWforPNGimages,JPGWforJPG, …) is saved in the same folder as your image. ThePDFformat embeds the information in the PDF file. When exporting to PDF, more options are available in the Save map as PDF… dialog:
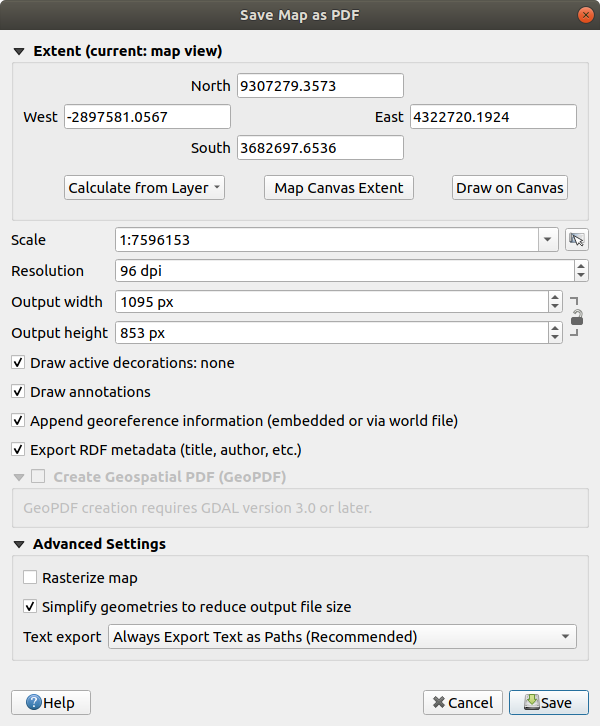
Рис. 11.22 The Save Map as PDF dialog
- Export RDF metadata of the document such
as the title, author, date, description…
- Create Geospatial PDF (GeoPDF): Generate a
georeferenced PDF file.
You can:
Choose the GeoPDF Format
- Include vector feature information in the
GeoPDF file: will include all the geometry and attribute
information from features visible within the map in the output
GeoPDF file.
Примечание
A GeoPDF file can also be used as a data source. For more on GeoPDF support in QGIS, see https://north-road.com/2019/09/03/qgis-3-10-loves-geopdf/.
Rasterize map
- Simplify geometries to reduce output file
size:
Geometries will be simplified while exporting the map by removing
vertices that are not discernibly different at the export
resolution (e.g. if the export resolution is
300 dpi, vertices that are less than1/600 inchapart will be removed). This can reduce the size and complexity of the export file (very large files can fail to load in other applications). Set the Text export: controls whether text labels are exported as proper text objects (Always export texts as text objects) or as paths only (Always export texts as paths). If they are exported as text objects then they can be edited in external applications (e.g. Inkscape) as normal text. BUT the side effect is that the rendering quality is decreased, AND there are issues with rendering when certain text settings like buffers are in place. That’s why exporting as paths is recommended.
Click Save to select file location, name and format.
When exporting to image, it’s also possible to Copy to clipboard the expected result of the above settings and paste the map in another application such as LibreOffice, GIMP…