21.4. Criando um Relatório
Esta seção irá ajudá-lo a configurar um relatório no QGIS.
21.4.1. O que é?
Por definição, um relatório SIG é um documento contendo informações organizadas de forma narrativa, contendo mapas, textos, gráficos, tabelas, etc. Um relatório pode ser preparado ad hoc, periódico, recorrente, regular, ou conforme necessário. Os relatórios podem se referir a períodos, eventos, ocorrências, assuntos ou locais específicos.
No QGIS, um Relatório é uma extensão de um Layouts.
Os relatórios permitem que os usuários gerem seus projetos GIS de maneira simples, rápida e estruturada.
A report can be created with or inside the .
Nota
Os mapas nos relatórios QGIS comportam-se da mesma forma que os mapas nos layouts e atlas impressos. Vamos nos concentrar nas especificidades dos relatórios QGIS. Para detalhes sobre manuseio de mapas, veja as seções sobre :ref:` layouts de impressão <overview_layout>` e atlases.
21.4.2. Iniciando
In the Layout Manager dialog a report can be created through New from template by selecting the dropdown option Empty Report and hitting the Create… button.
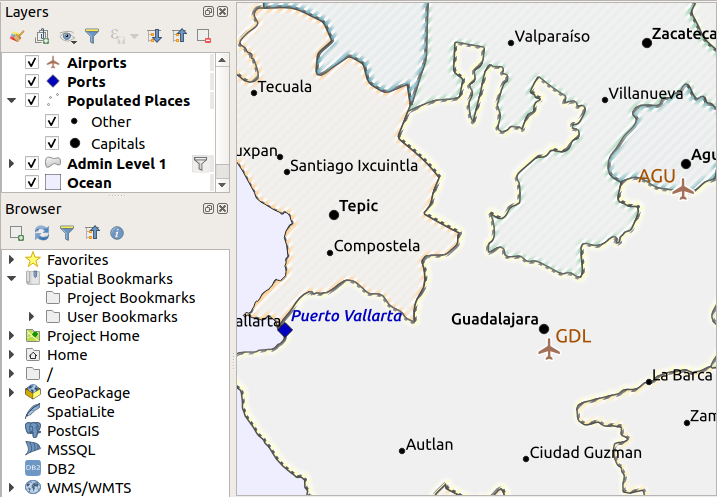
Para este exemplo, usamos alguns limites administrativos, locais com população, portos e aeroportos do Natural Earth dataset (1: 10M).
Usando o comando :menuselection:`Projeto –> Novo Relatório’, criamos um relatório em branco. Inicialmente, não há muito para ver - o diálogo que é exibido se parece muito com o designer do layout de impressão, exceto pelo painel :guilabel:`Organizador de relatório’ à esquerda:
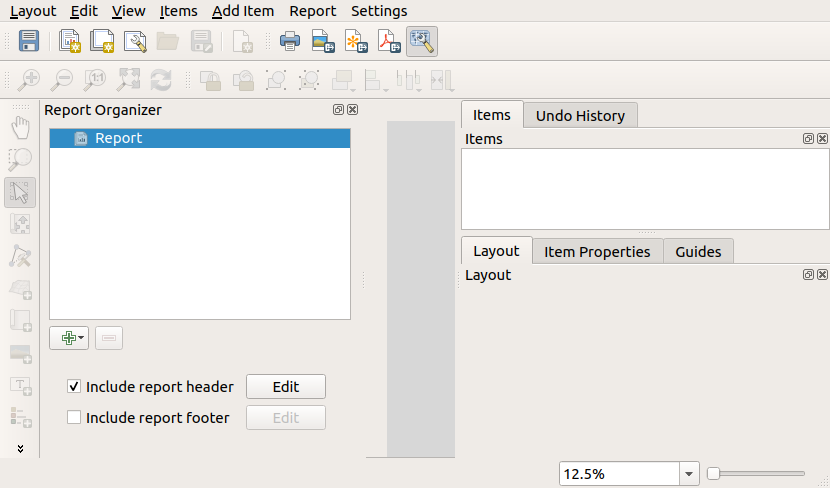
21.4.3. Espaço de Trabalho do Compositor de Relatório
QGIS reports can consist of multiple, nested sections. In our new blank report we initially only have the main report section. The only options for this report section is Include report header and Include report footer. If we enable these options, a header will be included as the first page(s) (individual parts of reports can be multi-page if desired) in the report, and a footer will constitute the last page(s). Enable the header (Include report header), and hit the Edit button next to it:
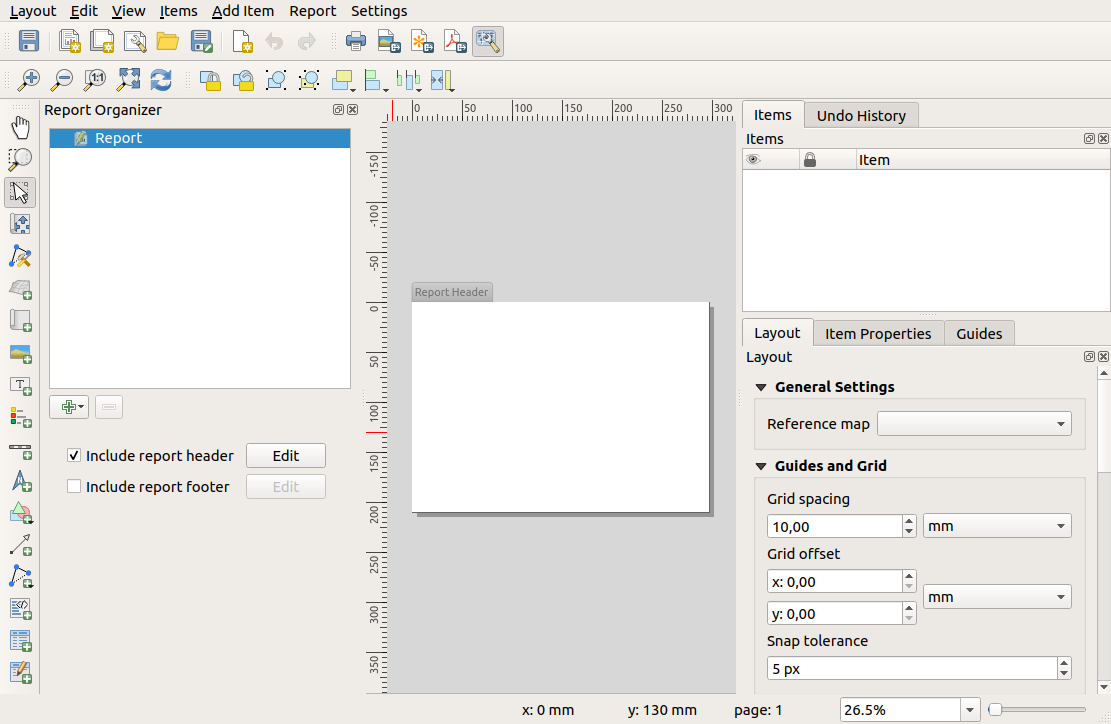
A few things happen as a result. Firstly, an edit pencil is shown next to Report in the Report Organizer, indicating that the report section is currently being edited in the designer. We also see a new page with a small Report Header title. The page has landscape orientation by default, but this (and other properties of the page) can be changed by right-clicking on the page and choosing . This will bring up the Item properties tab for the page, and page Size, Width, Height, and more can be specified.
Nos relatórios QGIS, todos os componentes do relatório são compostos por layouts individuais. Eles podem ser criados e modificados usando as mesmas ferramentas dos layouts de impressão padrão - para que você possa usar qualquer combinação desejada de rótulos, figuras, mapas, tabelas etc. Vamos adicionar alguns itens ao cabeçalho do nosso relatório para demonstrar:

Também criaremos um rodapé simples para o relatório, verificando a opção :guilabel:`incluir rodapé do relatório’ e selecionando :guilabel:`Editar’.

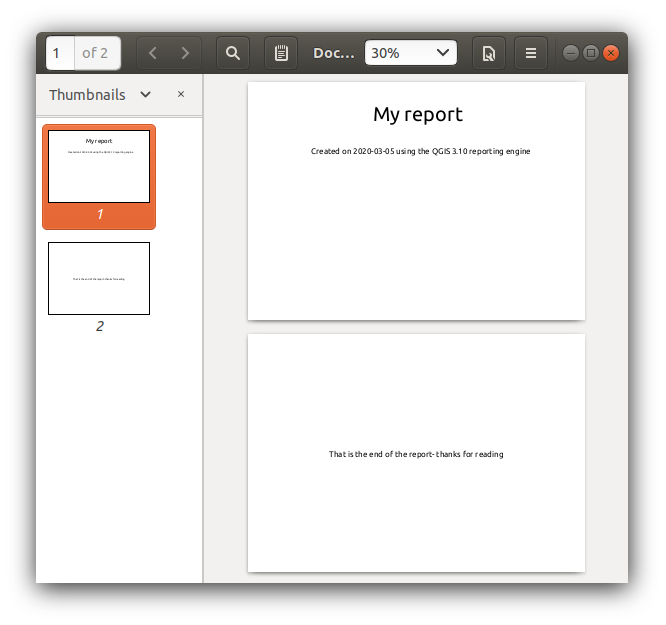
Antes de continuarmos, vamos exportar este relatório e ver o que conseguimos. A exportação é feita a partir do menu para renderizar o relatório inteiro em um arquivo PDF. Aqui está o resultado não muito impressionante - um PDF de duas páginas que consiste de nosso cabeçalho e rodapé:
Let us make things more interesting.
By hitting the  Add Section button in the
Report Organizer, we are given a choice of new sections to
add to our report.
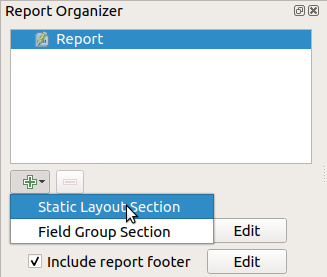
There are two options: Static Layout Section and Field Group Section.
The Add Static Layout Section is a single, static body layout. This can be used to embed static layouts mid-way through a report.
The Field Group Section repeats its body layout for every feature of a layer. The features are sorted by the selected grouping feature (with an option for ascending/descending sort). If a field group section has child sections (e.g. another field group section with a different field), then only features with unique values for the group feature are iterated over. This allows nested reports.
For now we will add a Field Group Section to our report. At its most basic level, you can think of a Field Group Section as the equivalent of a print atlas: you select a layer to iterate over, and the report will insert a section for each feature found. Selecting the new Field Group Section reveals a number of new related settings:
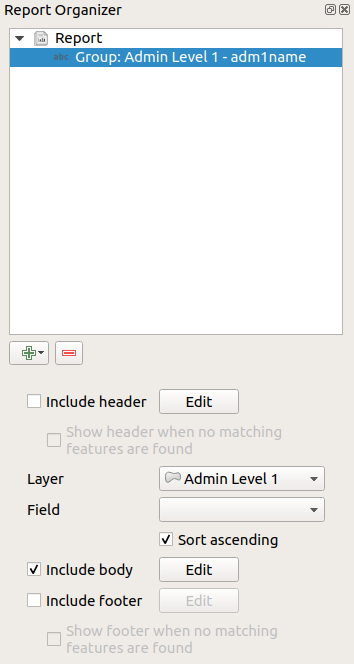
In this case we’ve setup our Field Group so that we iterate over all the states from the Admin Level 1 layer, using the values from the adm1name field. The same options to include header and footer are present, together with a new option to include a body for this section. We’ll do that, and edit the body:
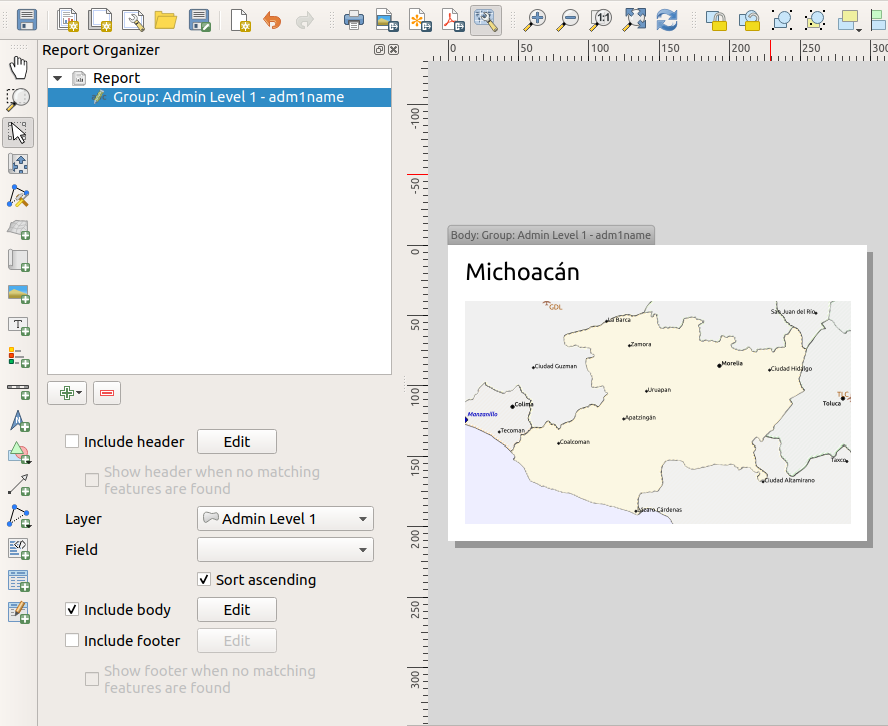
Our body now consists of a map and a label showing the name of the state. To include the name of the state, we selected and data defined the text under Main Properties with the help of Insert or Edit an Expression….
The result was the following expression (name is the name of the attribute in the Admin Level 1 layer that contains the name of the state):
[% "name" %]
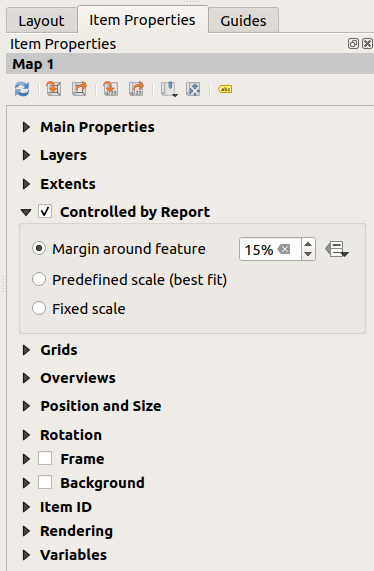
The map is set to follow the current report feature (enabled by checking Controlled by Report – just like a map item in an atlas will follow the current atlas feature when Controlled by Atlas is checked):
Se fôssemos adiante e exportássemos nosso relatório agora, conseguiríamos algo assim:
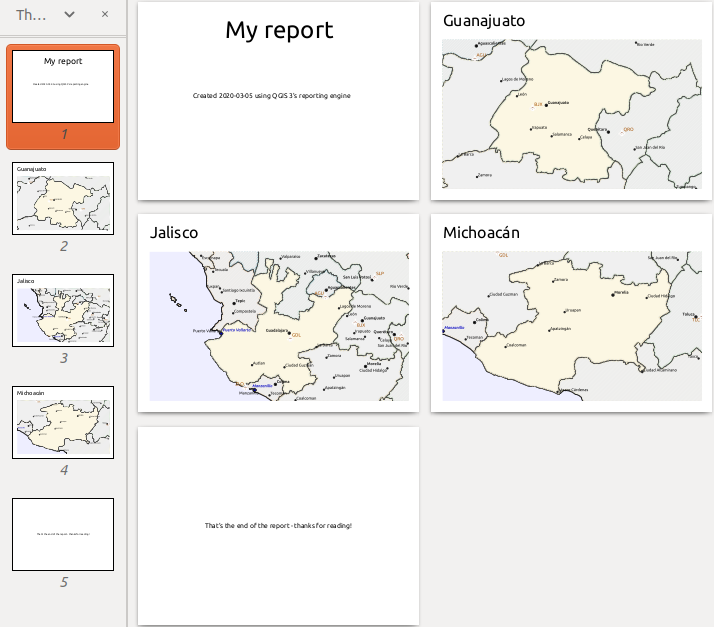
Fig. 21.68 O cabeçalho do relatório, uma página para cada estado, e o rodapé do relatório.
Portanto, mais ou menos um atlas, mas com uma página de cabeçalho e rodapé.
Vamos tornar as coisas mais interessantes, acrescentando uma subseção ao nosso grupo estadual. Fazemos isto primeiro selecionando o grupo de campo Admin Número 1 no organizador, depois pressionando o botão  Adicionar campo e adicionando uma nova Seção de grupos de campo:
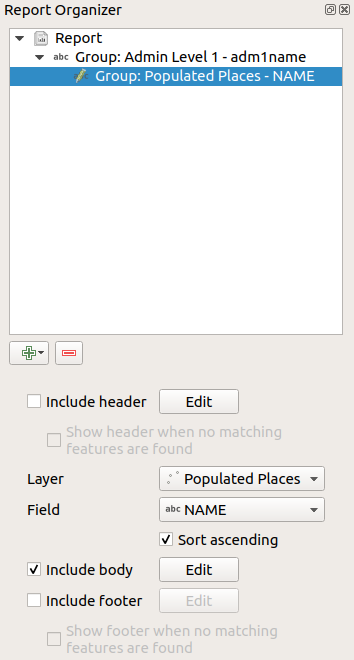
When iterating over the features of a Field Group Section,
the features will be filtered to match the defining field of its parent
group (adm1name in this case).
Here, the subsection we added will iterate over a
Populated Places layer, including a body section for each
place encountered.
The magic here is that the Populated Places layer has an
attribute with the same name as the defining field in the parent layer,
adm1name, tagging each place with the state it is contained
within (if you’re lucky your data will already be structured like this
– if not, run the
Join Attributes by Location
Processing algorithm and create your own field).
When we export this report, QGIS will grab the first state from the
Admin Level 1 layer, and then iterate over all the
Populated Places with a matching adm1name value.
Here’s what we get:
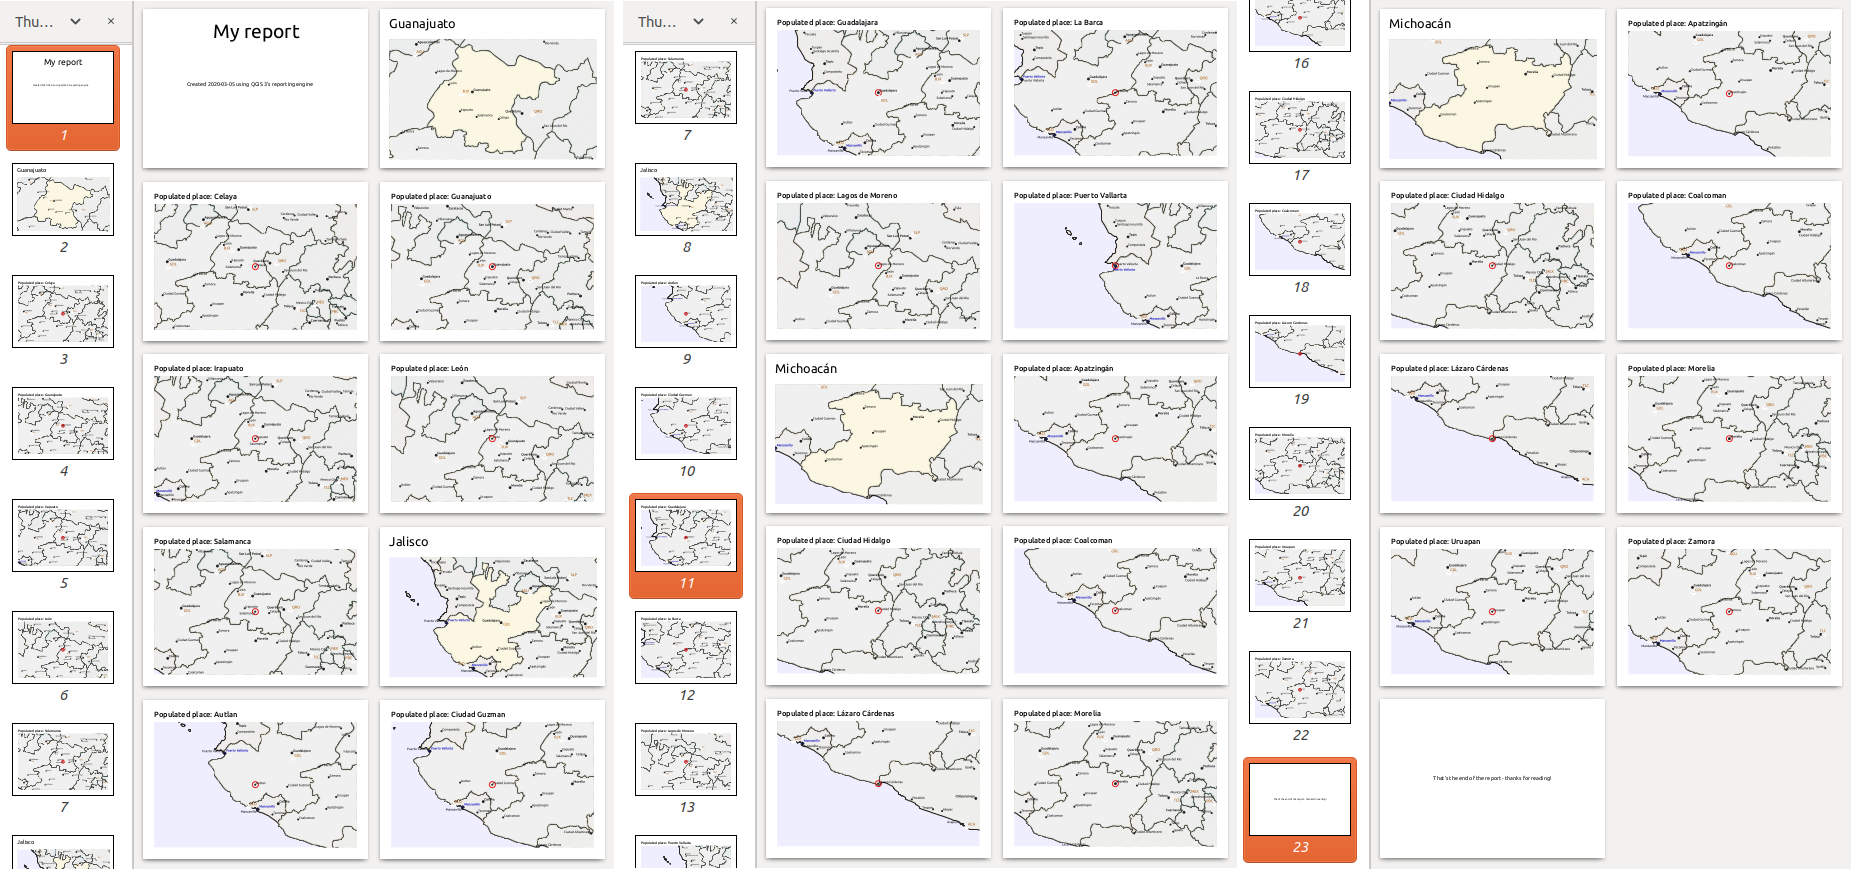
Here we created a basic body for the Populated Places group, including a map of the place and a table of some place attributes. So our report is now a report header, a page for the first state, followed by a page for every populated place within that state, then the rest of the states with their populated places, and finally the report footer. If we were to add a header for the Populated Places group, it would be included just before listing the populated places for each state, as shown in the illustration below.
Da mesma forma, um rodapé para o grupo de Lugares Populados seria inserido após o local final para cada estado ser incluído.
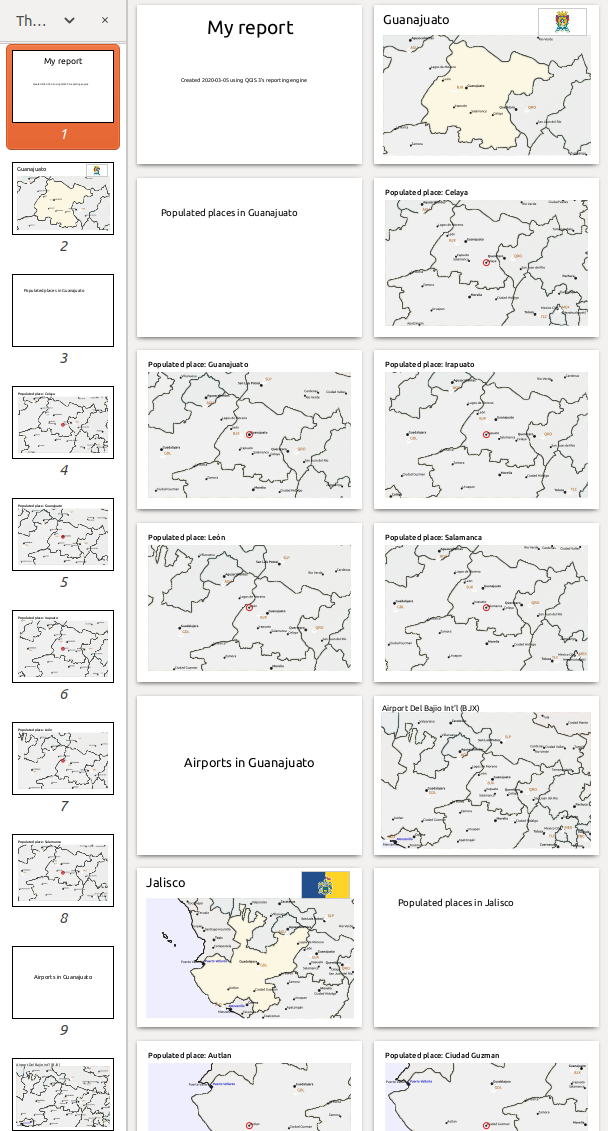
In addition to nested subsections, subsections in a report can also be included consecutively. If we add a second subsection to the Admin Level 1 group for Airports, then (if the Airports layer has an attribute adm1name that can link it to the parent group) our report will first list ALL the populated places for each state, followed by all the airports within that state, before proceeding to the next state.
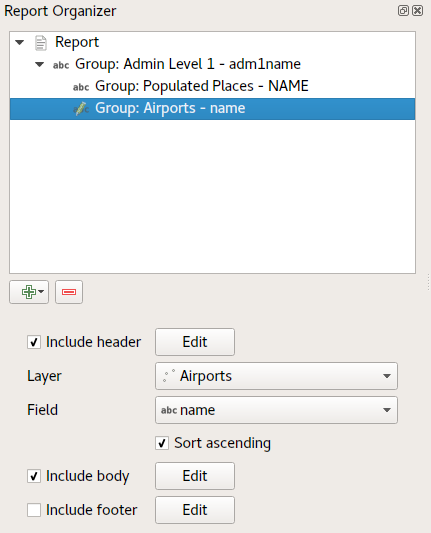
The key point here is that our Airports group is a subsection of the Admin Level 1 group – not the Populated Places group.
In this case our report would be structured like this (note that state flags have also been included - the procedure for adding feature specific pictures in this way is described below):
21.4.3.1. Incluindo imagens em um relatório
Pictures can be quite useful in reports, and QGIS allows pictures in both the static and dynamic parts of a report. Pictures are added in the same way as for standard print layouts, and for the static report parts (and static pictures in dynamic parts) there is not more to it.
Mas se você quiser ilustrações que sejam adaptadas às características do relatório, sua camada deve ter um atributo que possa ser usado para definir a imagem a incluir.
O QGIS depende dos nomes absolutos dos arquivos de imagens nos relatórios.
Para imagens dinâmicas, você primeiro adiciona uma imagem à parte do corpo do grupo, como de costume. No Propriedades do Item da imagem, você define Fonte da Imagem usando o botão ![]() Substituição definida dos dados e selecione um atributo que contenha o caminho absoluto das imagens ou :guilabel:`Editar … `(para inserir uma expressão que gere o caminho absoluto da imagem).
Substituição definida dos dados e selecione um atributo que contenha o caminho absoluto das imagens ou :guilabel:`Editar … `(para inserir uma expressão que gere o caminho absoluto da imagem).
Below is an example expression that uses string concatenation to
specify the absolute path to the pictures, using the directory
where the project file is located @project_path) and an
attribute (adm1name) from which the file name is generated
(in this case by transforming the string in the adm1name
attribute to uppercase, and appending ‘_flag.png’):
concat(@project_folder, '/naturalearth/pictures/' ,
       upper("adm1name"), '_flag.png')
This means that the pictures are located in the
naturalearth/pictures subdirectory of the project file directory.

21.4.3.2. Destacando a característica do relatório atual em um mapa
In the above report, the report features are emphasized in the
maps using highlighting (state) and circles (populated places).
To emphasize the report features in the maps (apart from placing
them at the centre of the maps), you must data define the style using
a comparison between its @id and the @atlas_featureid, as
for atlases.
For instance, if you would like to use a thicker line / border for the report feature than the other features you can data define the line width:
if($id=@atlas_featureid, 2.0, 0.1)
The report feature will get a 2 units wide polygon outline, while all other features will get a 0.1 units wide line. It is also possible to data define the colour (non-transparent dark magenta for the report feature and semi-transparent light gray for the other features):
if($id=@atlas_featureid, '#FF880088', '#88CCCCCC')
21.4.3.3. Mais grupos de nível 1
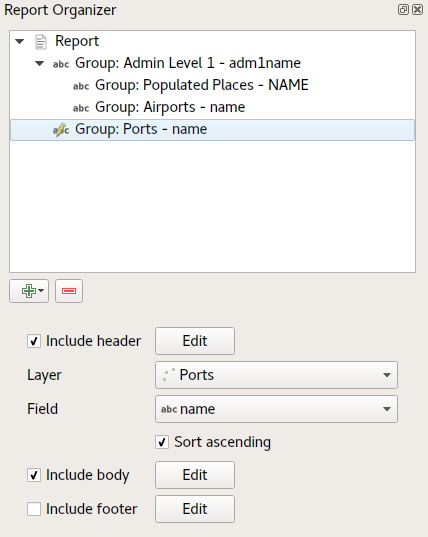
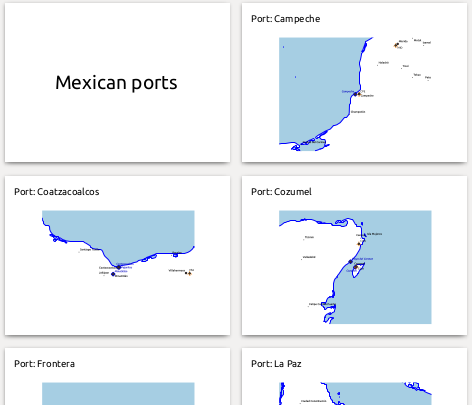
Combining nested and consecutive sections, together with section headers and footers allows for tons of flexibility. For instance, in the below report we add another field group as a child of the main report for the :guilabel`Ports` layer. Now, after listing the states together with their populated places and airports, we’ll get a summary list of all the ports in the region:
Isto resulta na última parte de nosso relatório exportando como:
21.4.4. Definições para exportação
Quando você exporta um relatório (:menuselection:` Relatório –> Exportar Relatório como Imagens… / SVG… / PDF…`), será solicitado um nome de arquivo, e então você terá a oportunidade de ajustar as configurações de exportação para obter a saída mais apropriada.
Como você vê, os relatórios no QGIS são extremamente poderosos e flexíveis!
Nota
The current information was adapted from a North Road blog, Exploring Reports in QGIS 3.0 - the Ultimate Guide!