14.5. Lesson:: 체계적인 표본 설계
여러분은 이미 삼림의 수종경계를 나타내는 폴리곤 셋을 디지타이징했지만 아직 삼림에 대한 정보를 갖고 있지는 못합니다. 이를 위해 여러분은 전체 삼림 지역을 목록화하기 위한 조사 방법을 설계한 다음 그 파라미터를 산정할 수 있습니다. 이번 강의에서 여러분은 체계적인 표본 조사구 셋을 만들 것입니다.
삼림의 목록화를 시작했을 때 그 목적, 사용될 표본 조사구의 유형 그리고 목적을 달성하기 위해 수집될 데이터를 명확히 정의하는 것이 중요합니다. 이러한 것들은 각각의 사례에서 삼림의 유형과 관리 목적에 따라 달라지며, 삼림 관리의 지식을 가진 전문가가 신중히 계획해야 합니다. 이번 강의에서 여러분은 체계적인 표본 조사구 설계에 기초한 이론적인 목록화를 시행하게 될 것입니다.
이 강의의 목표: 삼림 지역을 조사하기 위한 체계적인 표본 조사구 설계하기.
14.5.1. 삼림의 목록화
삼림을 목록화하기 위한 여러 방법들이 있습니다. 각각 다른 목적과 상태에 적합한 방법들입니다. 예를 들어, (수종만을 고려할 경우) 삼림을 목록화하는 아주 정확한 방법 가운데 하나는 삼림에 직접 들어가서 모든 나무의 수종과 그 특성을 목록화하는 것입니다. 이것은 면적이 작은 지역이나 특별한 상황을 제외하면 일반적으로 적용할 수 있는 방법이 아니라는 것을 쉽게 알 수 있겠죠.
삼림의 정보를 알아내는 가장 일반적인 방법은 삼림 곳곳에서 측정한 표본을 만들어 전체 삼림으로 정보를 일반화하는 것입니다. 대부분의 경우 이러한 측정은 손쉽게 측정할 수 있는 작은 삼림 지역인 표본 조사구 에서 이뤄집니다. 표본 조사구는 어떤 크기(예를 들어 50 제곱미터, 0.5 헥타르 등)도 될 수 있고 어떤 형태(다양한 크기의 원형, 사각형 등)도 될 수 있으며, 그 위치도 다양한 방법(임의적, 체계적, 선형 등)으로 선정할 수 있습니다. 표본 조사구의 크기, 형태 그리고 위치는 일반적으로 통계적, 경제적 그리고 실질적인 사항을 고려하여 결정됩니다. 만약 여러분들이 삼림관리에 대한 지식이 없다면 이 위키피디아 내용 을 읽어보시기 바랍니다.
14.5.2.  Follow Along: 체계적인 표본 조사구 설계 시행
여러분이 작업할 삼림에서, 관리자가 이 삼림에 체계적인 표본 설계가 가장 적절하다고 결정했고, 직선을 따라 80m 간격으로 표본을 선정하는 방법이 신뢰할 수 있는 결과(이 경우 68%의 신뢰도에서 표준오차 ±5%)를 얻을 수 있다고 생각합니다. 이 수목의 생장 및 성숙 수종경계 목록화 작업에 가장 효율적인 방법은 다양한 크기의 조사구를 선정하는 것이지만, 묘목 수종경계에 대해서는 4m 반경의 조사구를 이용할 것입니다.
실습 시 여러분은 표본 조사구를 단순히 포인트로 표현하면 되는데, 나중에 현장 조사팀이 이 포인트들을 사용할 것입니다.
Open your
digitizing_2012.qgsproject from the previous lesson.Remove all the layers except for forest_stands_2012.
Save your project now as
forest_inventory.qgs
지금부터 포인트 사이의 간격이 80m인 정사각형 포인트 그리드를 만들어야 합니다.
Press the drop-down button next to the Input extent field and from the Calculate from Layer menu, select forest_stands_2012.
In the Point spacing/count settings, enter
80meters.Check the Use point spacing box to indicate that the value represents the distance between the points.
Under Regular points, save the output as
systematic_plots.shpin theforestry\sampling\folder.Check Open output file after running algorithm.
Press Run.
참고
The suggested Regular points creates the systematic points starting in the upper-left corner of the extent of the selected polygon layer. If you want to add some randomness to this regular points, you could use a randomly calculated number between 0 and 80 (80 is the distance between our points), and then write it as the Initial inset from corner (LH side) parameter in the tool’s dialog.
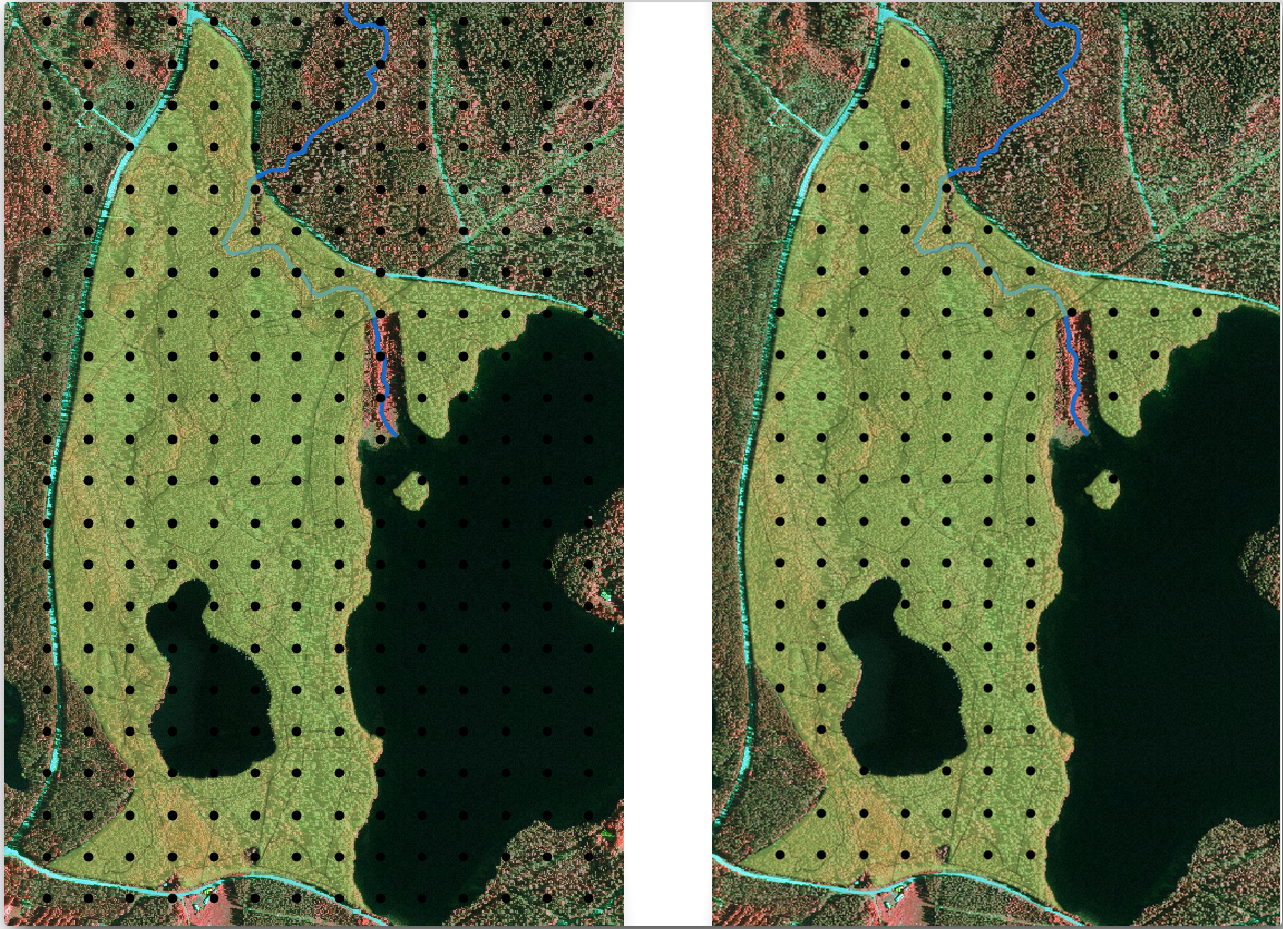
이 도구가 수종경계 레이어의 전체 범위에 정사각형 포인트 그리드를 생성했다는 것을 알 수 있습니다. 하지만 실제로는 삼림 지역 내부에 있는 포인트만 사용해야 합니다. (다음 이미지들을 참조하십시오)

Select systematic_plots as the Input layer.
Set forest_stands_2012 as the Mask layer.
Save the Clipped (mask) result as
systematic_plots_clip.shpin theforestry\sampling\folder.Check Open output file after running algorithm.
Press Run.
이제 현장 조사팀이 지정된 표본 조사구의 위치를 찾아가는데 사용할 수 있는 포인트들을 생성했습니다. 그런데 현장 조사에 더욱 유용하도록 이 포인트들을 손볼 수 있습니다. 최소한, 포인트에 의미있는 이름을 부여해서 현장 조사팀의 GPS 기기에서 사용할 수 있는 형식으로 내보낼 수 있을 것입니다.
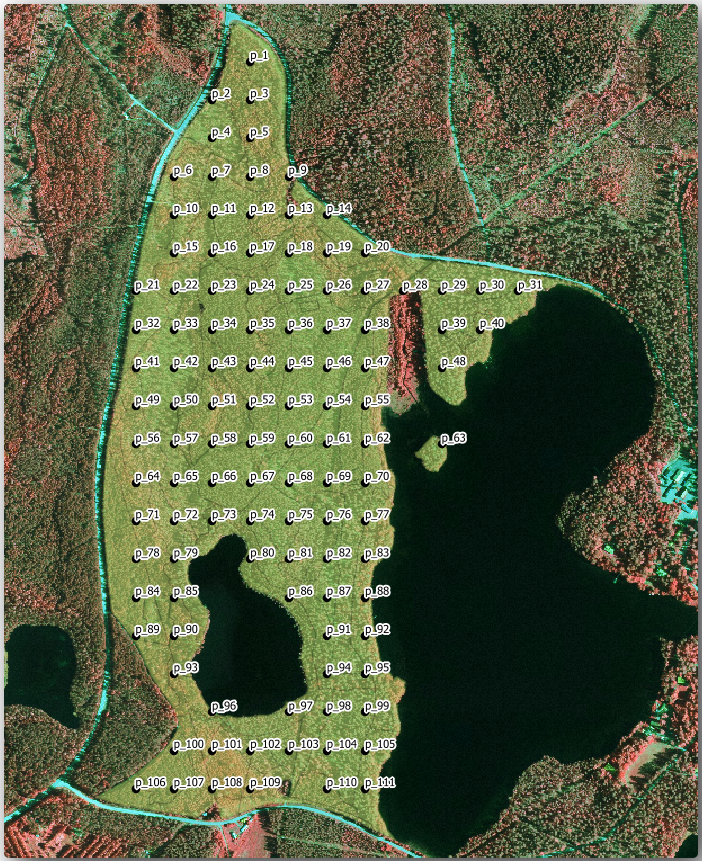
Let’s start with the naming of the sample plots. If you check the Attribute table for the plots inside the forest area, you can see that you have the default id field automatically generated by the Regular points tool. Label the points to see them in the map and consider if you could use those numbers as part of your sample plot naming:
For the Value entry, select the field
id.Go to the
 Buffer tab, check the
Draw text buffer and set the buffer Size to
 1.OK 를 클릭하십시오.
이제 지도의 라벨을 확인해보십시오. 먼저 서쪽에서 동쪽으로 그리고 북쪽에서 남쪽으로 포인트들이 생성되고 번호가 부여된 것을 볼 수 있습니다. 다시 속성 테이블을 살펴보면, 테이블 안의 포인트 순서도 이 패턴을 따른다는 사실을 알 수 있을 것입니다. 표본 조사구에 다른 방식으로 명칭을 부여할 이유가 없다면, 논리적 순서를 따라 서-동/북-남 방향으로 명명하는 것은 훌륭한 옵션이 되겠습니다.
Nevertheless, the number values in the id field are not so good.
It would be better if the naming would be something like p_1, p_2....
You can create a new column for the systematic_plots_clip layer:
Go to the Attribute table for
systematic_plots_clip.-
Check Create a new field
Enter
Plot_idas Output field nameSet the Output field type to Text (string).
In the Expression field, write, copy or construct this formula
concat('P_', @rownum ). Remember that you can also double click on the elements inside the Function list. Theconcatfunction can be found under String and@rownumis under the Variables and values group.
OK 를 클릭하십시오.
편집 모드를 해제하고 변경 사항을 저장하십시오.
Now you have a new column with plot names that are meaningful to you. For the
systematic_plots_clip layer, change the field used for labeling to your
new Plot_id field.

14.5.3.  Follow Along: 표본 조사구를 GPX 형식으로 내보내기
The field teams will be probably using a GPS device to locate the sample plots you planned. The next step is to export the points you created to a format that your GPS can read. QGIS allows you to save your point and line vector data in GPS eXchange Format (GPX), which is an standard GPS data format that can be read by most of the specialized software. You need to be careful with selecting the CRS when you save your data:
Right-click
systematic_plots_cliplayer and select .
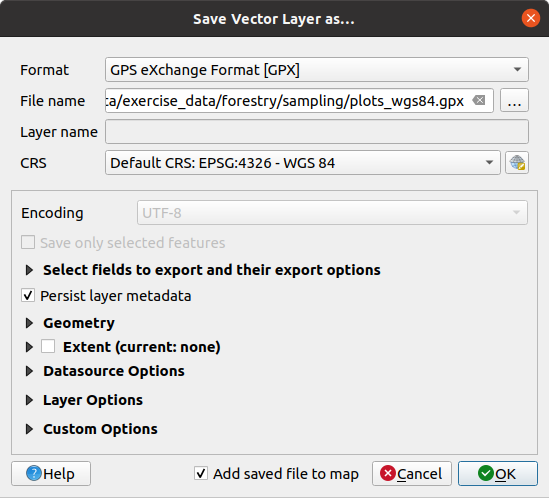
Format 에서 GPS eXchange Format [GPX] 를 선택합니다.
Save the output File name as
plots_wgs84.gpxin theforestry\sampling\folder.CRS 에서 Selected CRS 를 선택합니다.
Browse for EPSG:4326 - WGS 84.
참고
The GPX format accepts only this CRS, if you select a different one, QGIS will give no error but you will get an empty file.
OK 를 클릭하십시오.
In the dialog that opens, select only the
waypointslayer (the rest of the layers are empty).
The inventory sample plots are now in a standard format that can be managed by
most of the GPS software. The field teams can now upload the locations of the
sample plots to their devices. That would be done by using the specific devices
own software and the plots_wgs84.gpx file you just saved. Other option
would be to use the GPS Tools plugin but it would most likely
involve setting the tool to work with your specific GPS device. If you are
working with your own data and want to see how the tool works you can find out
information about it in the section GPS 데이터 작업 in the QGIS User Manual.
이제 QGiS 프로젝트를 저장하십시오.
14.5.4. In Conclusion
삼림 목록화에서 사용되는 체계적인 표본 설계를 얼마나 쉽게 생성할 수 있는지 확인했습니다. 다른 표본 설계 형식을 생성하려면, QGIS의 다른 도구들을 사용하거나, 스프레드시트를 이용하거나, 표본 조사구의 좌표를 계산하기 위한 스크립트를 사용해야 하지만, 기본적인 발상은 똑같습니다.
14.5.5. What’s Next?
다음 강의에서는 현장 조사팀이 표본 조사구를 찾는 데 사용할 상세 지도를 자동적으로 생성하기 위해 QGIS의 아틀라스 기능(Atlas capabilities)을 어떻게 사용하는지 배울 것입니다.


