5.1. Lesson: Crearea unui Nou Set de Date Vectoriale
Datele pe care le utlizați trebuie să vină de undeva. Pentru aplicațiile uzuale, datele există deja; dar cu cât proiectul este mai aparte și mai specializat, cu atât scad șansele ca datele să fie disponibile. În asemenea cazuri va fi nevoie să va creați propriile date.
Scopul acestei lecții: De a crea un nou set de date vectoriale.
5.1.1.  Follow Along: Dialogul de Creare a unui Strat
Înainte de a adăuga date vectoriale noi veți avea nevoie de un set de date la care să le adăugați. În cazul nostru veți începe prin a creea date complet noi, mai degrabă decât să editați un set de date existent. În concluzie, va trebui să începeți prin a crea propriul set de date.
Open QGIS and create a new blank project.
Navigate to and click on the menu entry . You’ll be presented with the New Shapefile Layer dialog, which will allow you to define a new layer.
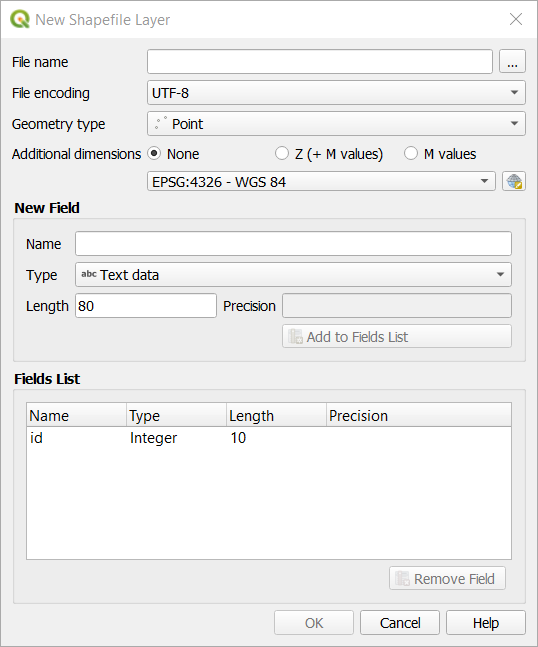
Click … for the File name field. A save dialog will appear.
Navigate to the
exercise_datadirectory.Save your new layer as
school_property.shp.Este important să decideți ce fel de set de date doriți. Fiecare tip de strat vectorial este „construit diferit” în fundal, deci odată ce ați creat un strat, nu îi puteți schimba tipul.
For the next exercise, we’re going to create new features which describe areas. For such features, you’ll need to create a polygon dataset.
For Geometry Type, select Polygon from the drop down menu:

Aceasta nu are nici un impact asupra restului dialogului, dar va determina folosirea tipului corect de geometrie care să fie utilizat la crearea setului de date vectorial.
The next field allows you to specify the Coordinate Reference System, or CRS. CRS is a method of associating numerical coordinates with a position on the surface of the Earth. See the User Manual on Working with Projections to learn more.
For this example we will use the default CRS associated with this project, which is WGS84.

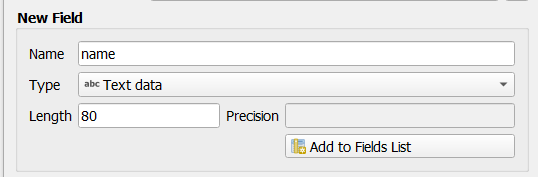
Next there is a collection of fields grouped under New Field. By default, a new layer has only one attribute, the
idfield (which you should see in the Fields list) below. However, in order for the data you create to be useful, you actually need to say something about the features you’ll be creating in this new layer. For our current purposes, it will be enough to add one field callednamethat will holdText dataand will be limited to text length of80characters.Replicate the setup below, then click the Add to Fields List button:
Verificați dacă dialogul dvs. arată acum astfel:
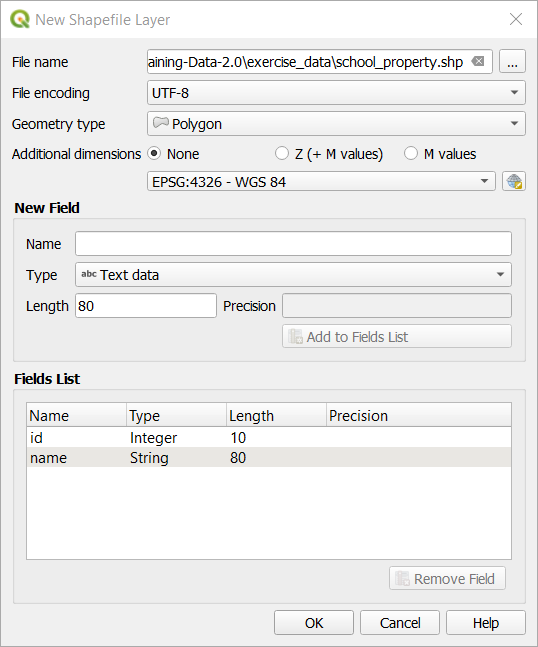
Clic pe OK
The new layer should appear in your Layers panel.
5.1.2. Follow Along: Sursele de Date
Când creați date noi, este evident necesar să se refere la obiecte care există întradevăr pe teren. De aceea, va fi nevoie să obțineți informația de undeva.
Există multe moduri de a obține date despre obiecte. De exemplu, ați putea folosi un GPS pentru a caputra puncte din lumea reală, după care să importați datele in QGIS. Sau ați putea să identificați punctele folosind un teodolit, după care să introduceți manual coordonatele pentru a crea noi entități.
Pentru exemplul nostru, veți folosi digitizarea. Eșantioanele seturilor de date raster vă sunt puse la dispoziție, așa că va trebui să le importați după nevoie.
Click on
 Data Source Manager button.
Select
 Raster on the left side.
In the Source panel, click on the … button:
Navigate to
exercise_data/raster/.Select the file
3420C_2010_327_RGB_LATLNG.tif.Click Open to close the dialogue window.
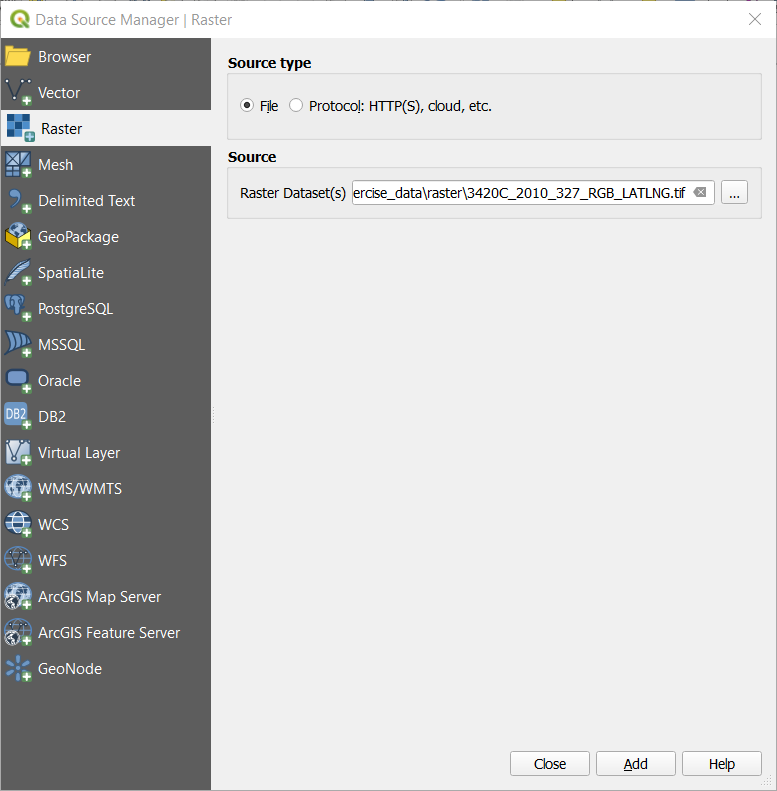
Click Add and Close. An image will load into your map.
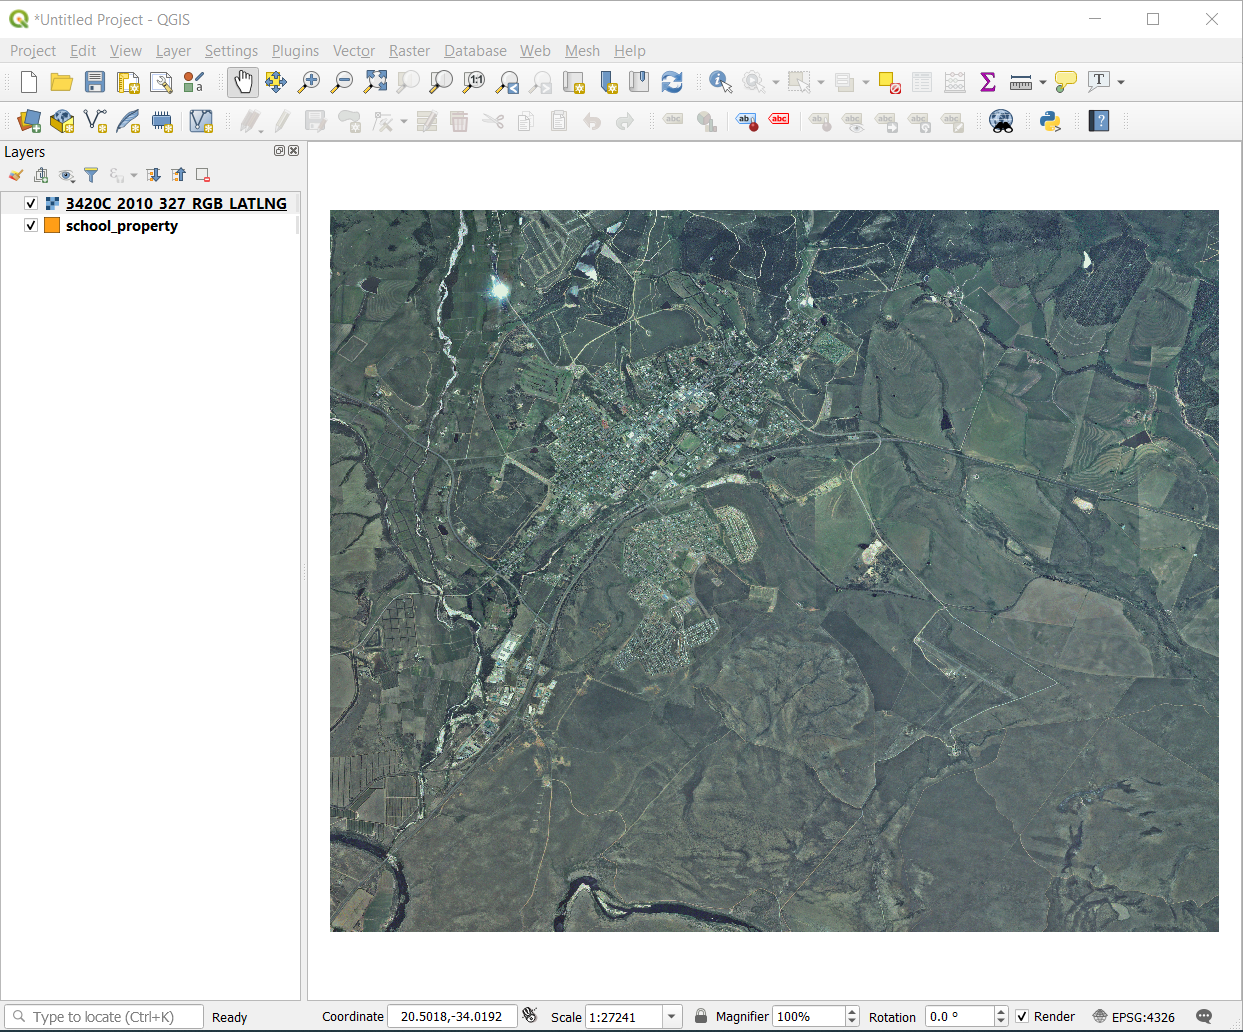
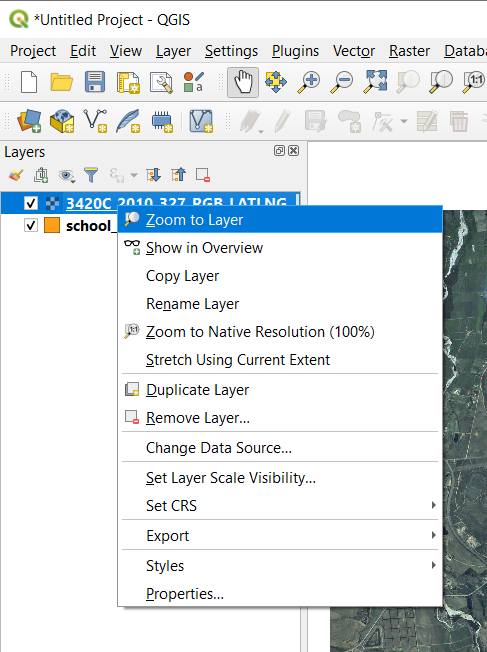
If you don’t see an aerial image appear, select the new layer, right click, and choose Zoom to Layer in the context menu.
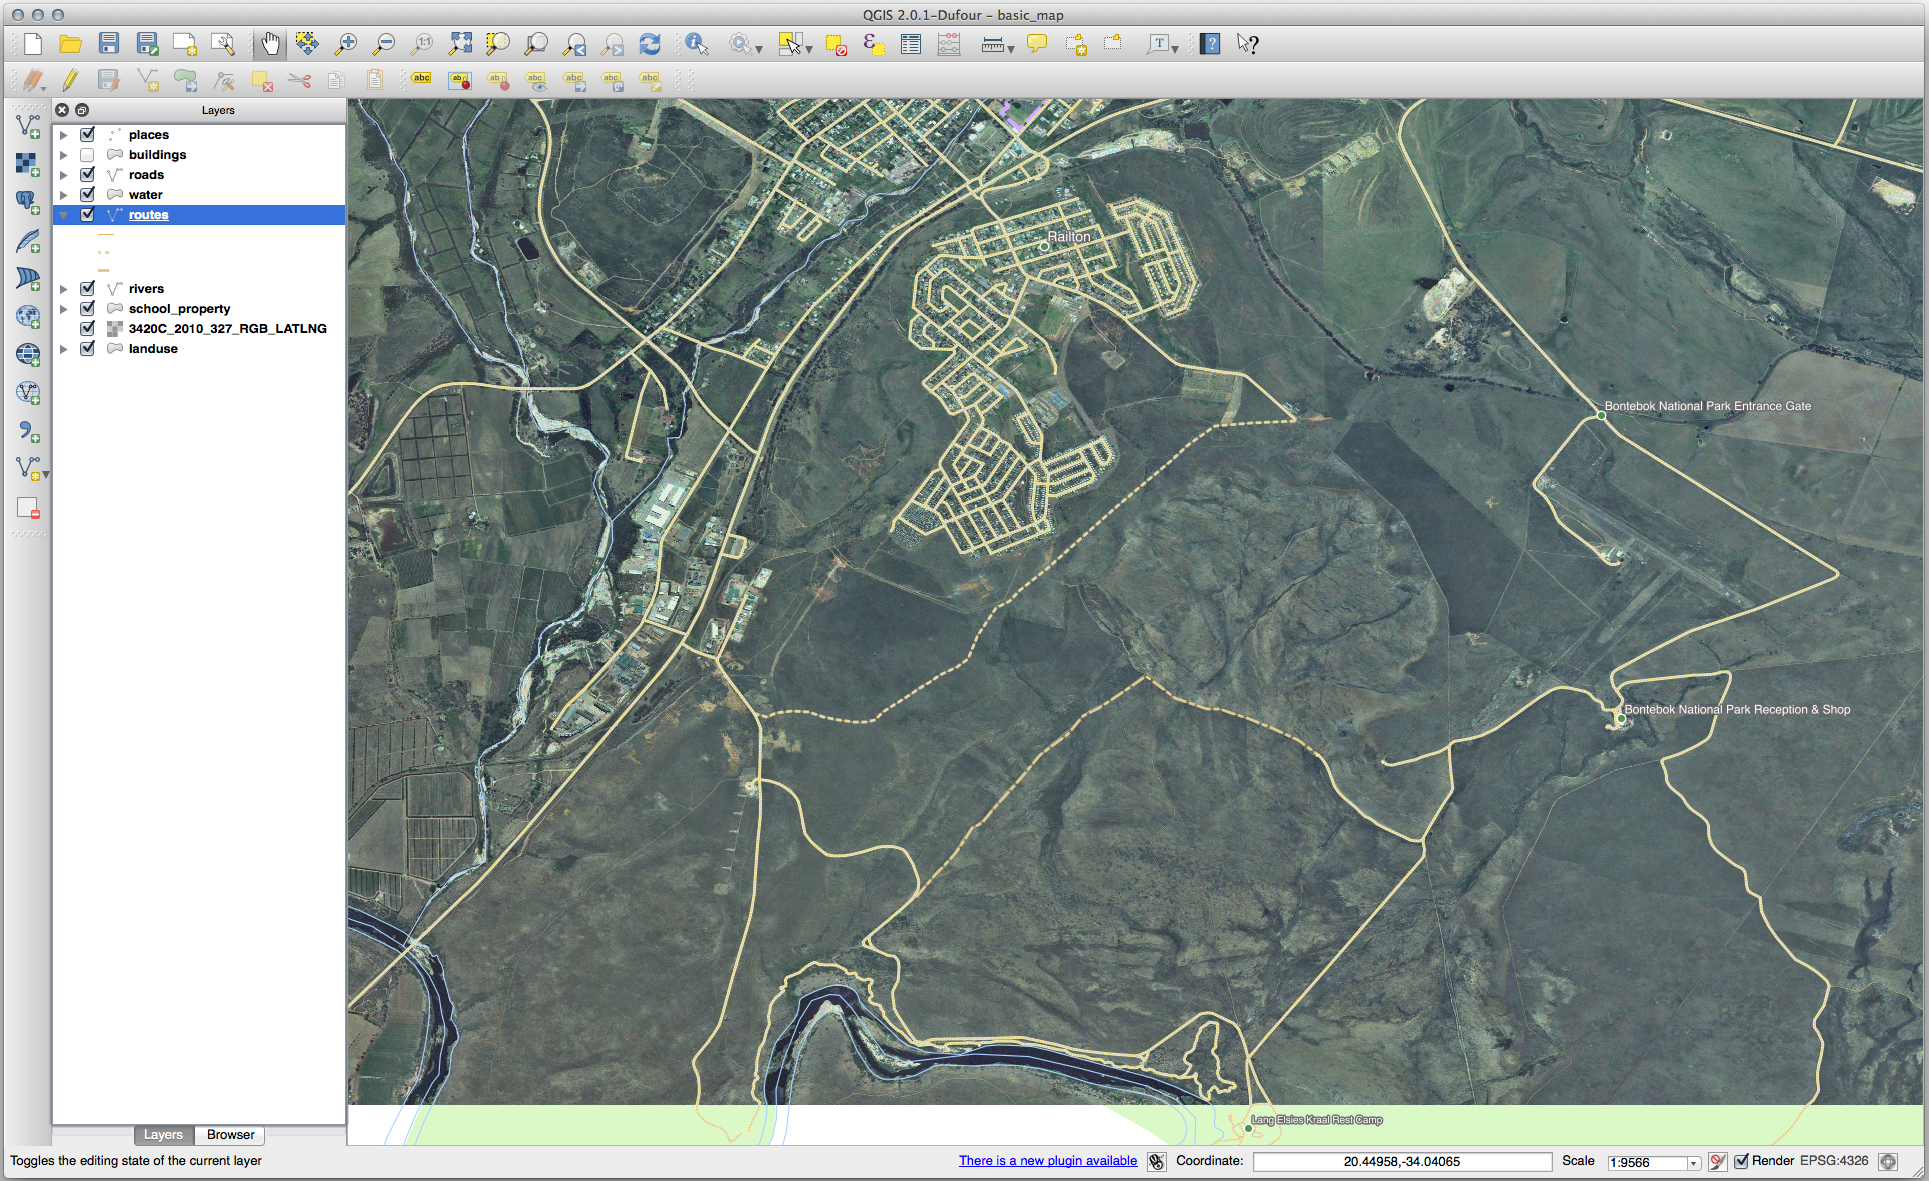
Click on the
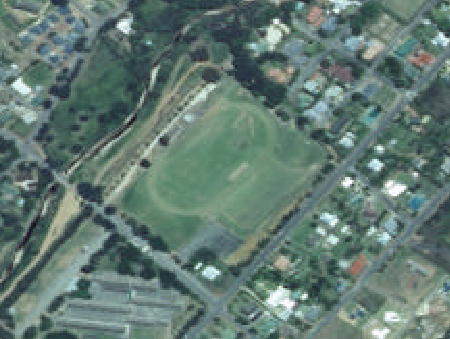
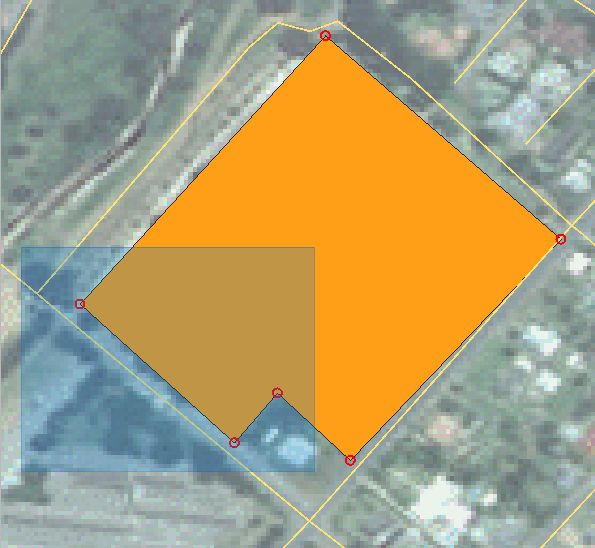
 Zoom In button, and zoom to the area highlighted in blue below:
Now you are ready to digitize these three fields:
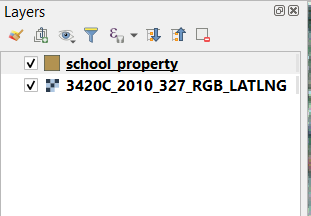
Before starting to digitize, let’s move the school_property layer above the aerial image.
Select
school_propertylayer in the Layers pane and drag it to the top.
Pentru a începe digitizarea trebuie să intrați în modul editare. Aplicațiile GIS cer asta în mod curent pentru a preveni modificarea sau ștergerea accidentală a datelor importante. Modul editare este activat sau dezactivat independent pentru fiecare strat.
To enter edit mode for the school_property layer:
Click on the
school_propertylayer in the Layers panel to select it.Click on the
 Toggle Editing button.
Dacă nu puteți găsi acest buton, verificați dacă bara de instrumente Digitizing este activată. Ar trebui să existe un semn de selectare lângă elementul de meniu .
As soon as you are in edit mode, you’ll see that some digitizing tools have become active:
 Capture Polygon
 Vertex Tool
Other relevant buttons are still inactive, but will become active when we start interacting with our new data.
Notice that the layer
school_propertyin the Layers panel now has the pencil icon, indicating that it is in edit mode.Click on the
Capture Polygon button to begin digitizing
our school fields.You’ll notice that your mouse cursor has become a crosshair. This allows you to more accurately place the points you’ll be digitizing. Remember that even when you’re using the digitizing tool, you can zoom in and out on your map by rolling the mouse wheel, and you can pan around by holding down the mouse wheel and dragging around in the map.
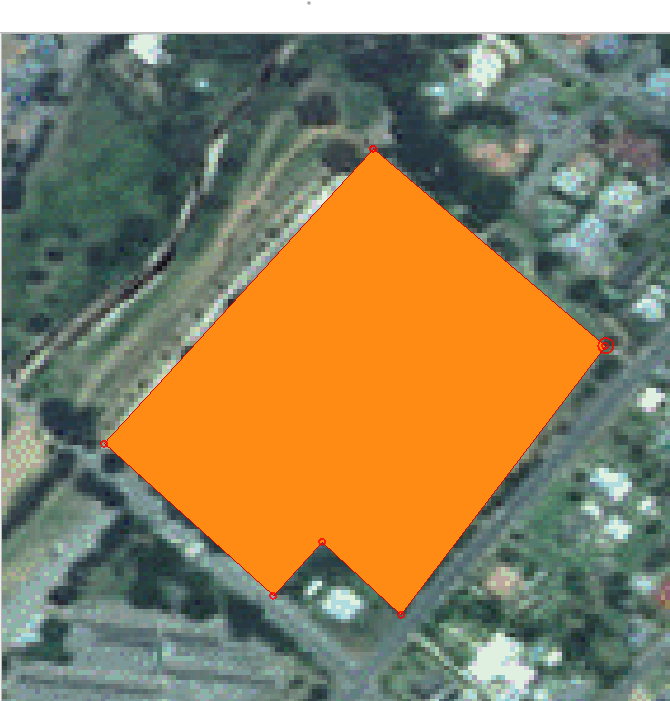
Prima entitate pe care o veți digitaliza este athletics field:
Începeți digitizarea făcând clic pe un punct, de-a lungul marginii câmpului.
Plasați mai multe puncte, făcând clic în continuare de-a lungul marginii, până când forma desenată acoperă complet câmpul.
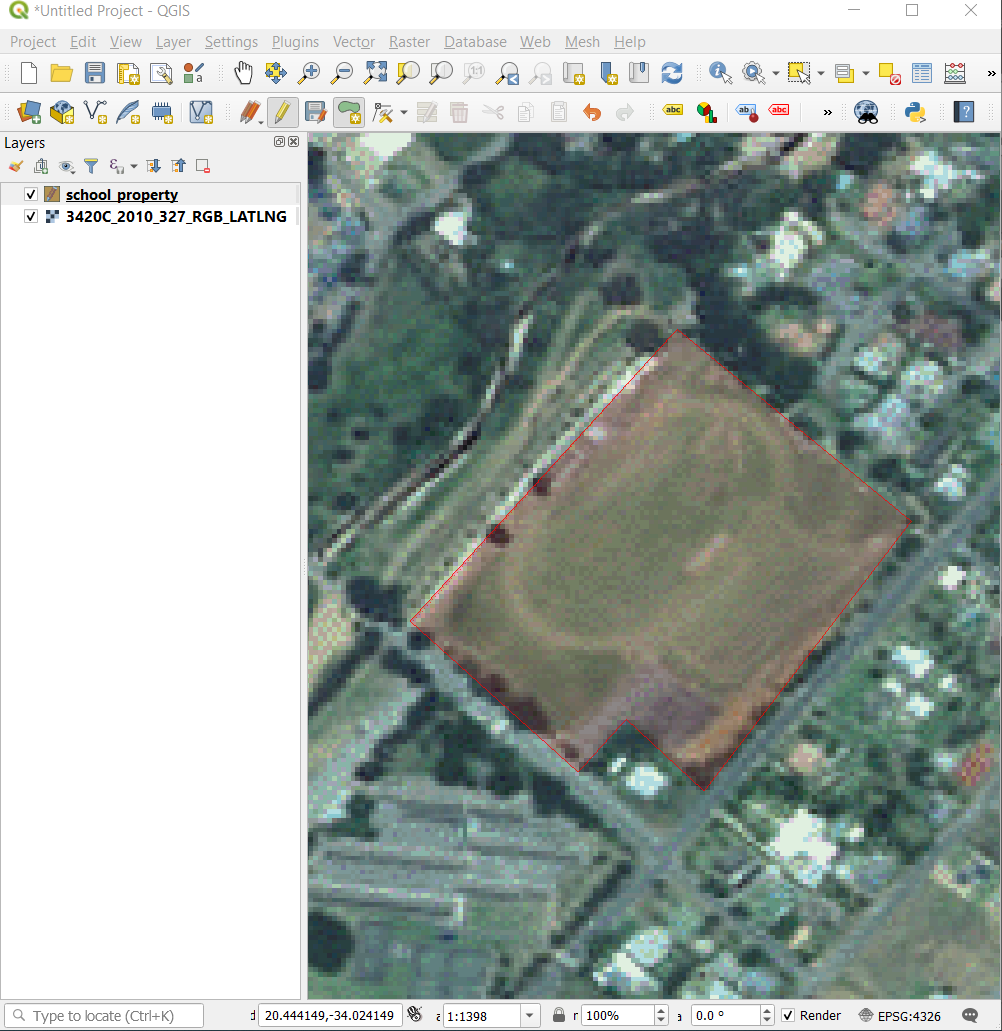
After placing your last point, right click to finish drawing the polygon. This will finalize the feature and show you the Attributes dialog.
Completați valorile, așa cum se arată mai jos:
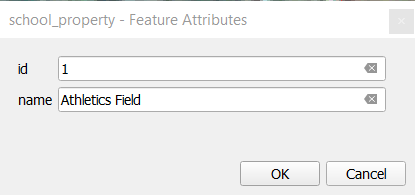
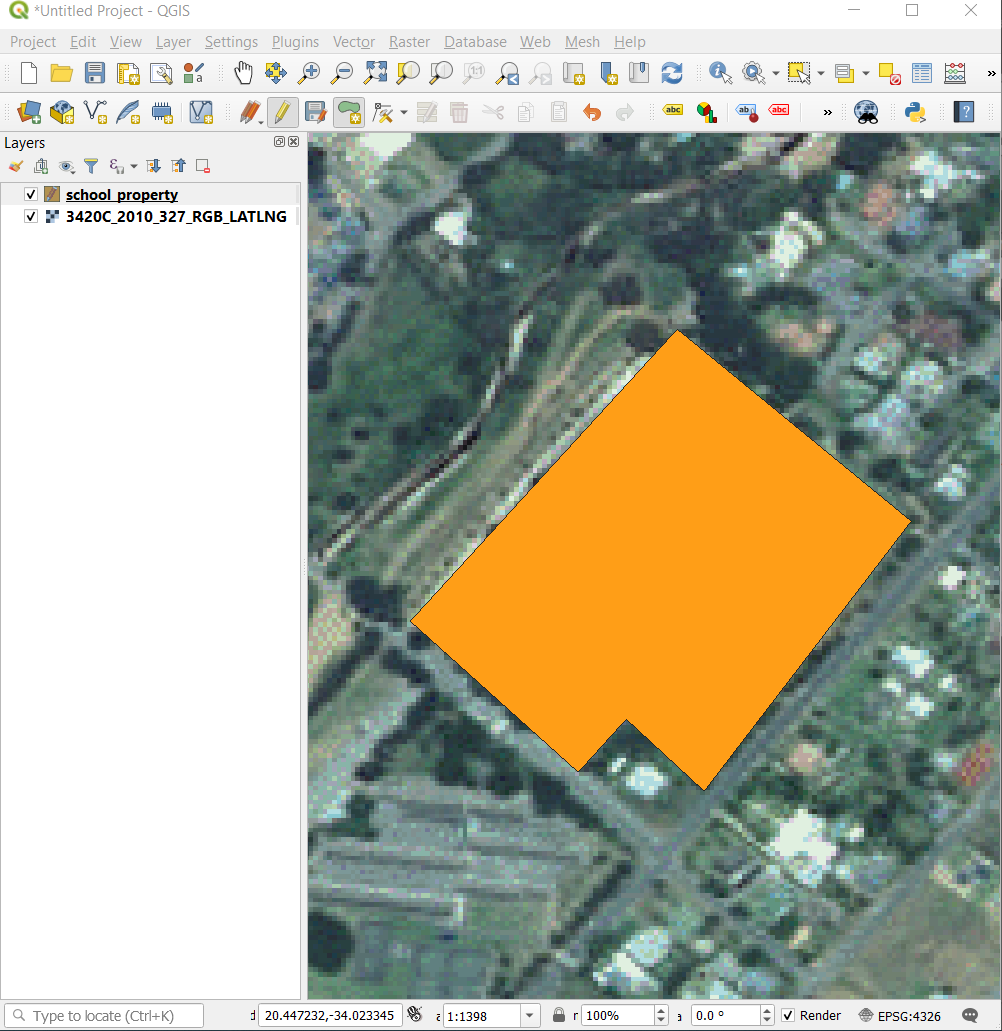
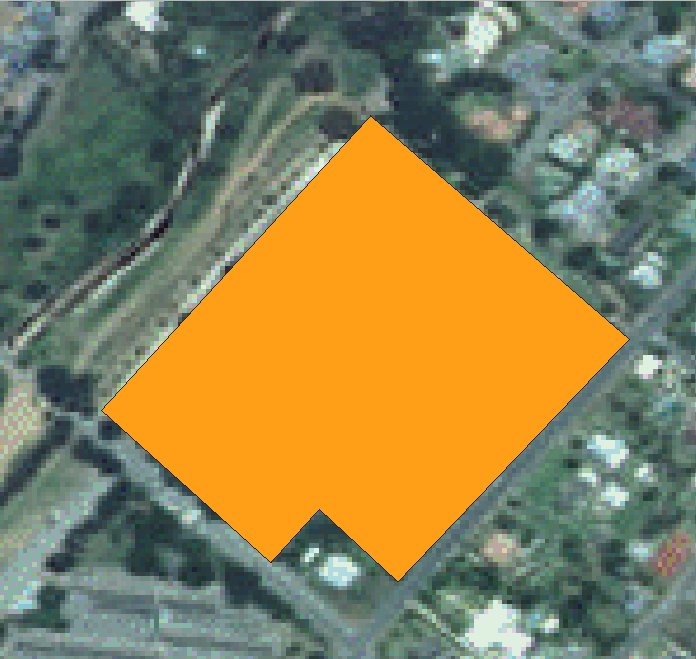
Click OK, and you have created a new feature!
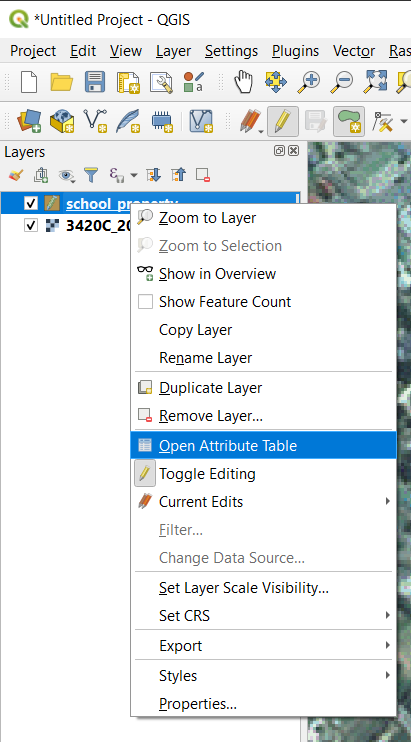
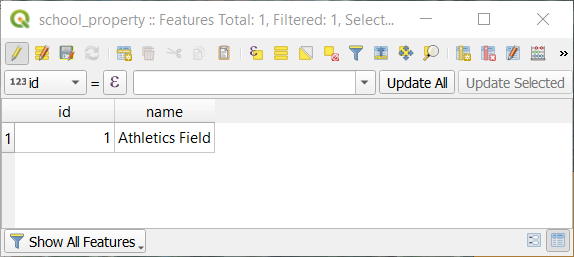
In the Layers panel select the
school_propertylayer.Right click and choose Open Attribute Table in the context menu.
In the table you will see the feature you just added. While in edit mode you can update the attributes data by double click on the cell you want to update.
Închideți tabelul de atribute.
To save the new feature we just created, click on
 Save Edits button.
Amintiți-vă că dacă ați făcut o greșeală în timp ce digitizați o entitate, o puteți edita oricând după ce ați definitivat crearea ei. Dacă ați făcut o greșeală, continuați digitizarea până ați terminat crearea entității de mai sus. Apoi:
Click on
Vertex Tool button.Hover the mouse over a vertex you want to move and left click on the vertex.
Move the mouse to the correct location of the vertex, and left click. This will move the vertex to the new location.
The same procedure can be used to move a line segment, but you will need to hover over the midpoint of the line segment.
If you want to undo a change, you can press the
 Undo button or Ctrl+Z.
Remember to save your changes by clicking the
Save Edits button.When done editing, click the
Toggle Editing button
to get out of edit mode.
5.1.3. Try Yourself Digitizing Polygons
Digitizarea școlii propriu-zise și a câmpului de sus. Utilizați această imagine pentru a vă ajuta:
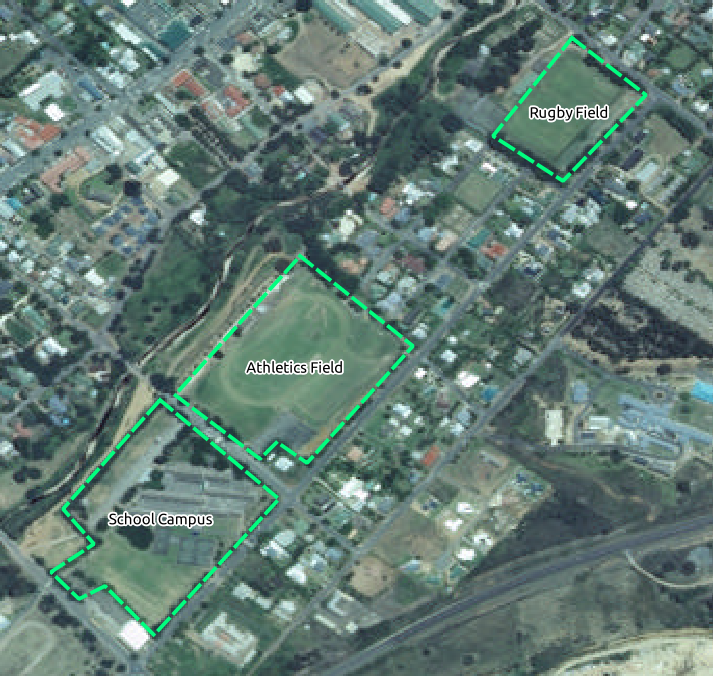
Remember that each new feature needs to have a unique id value!
Notă
După ce ați terminat de adăugat entitățile într-un strat, nu uitați să salvați modificările și să ieșiți din modul de editare.
Notă
You can style the fill, outline and label placement and formatting
of the school_property using techniques learnt in earlier
lessons.
5.1.4.  Follow Along: Using Vertex Editor Table
Another way to edit a feature is to manually enter the actual coordinate values for each vertex using the Vertex Editor table.
Make sure you are in edit mode on layer
school_property.If not already activated, click on
Vertex Tool button.Move the mouse over one of the polygon features you created in the
school_propertylayer and right click on it. This will select the feature and a Vertex Editor pane will appear.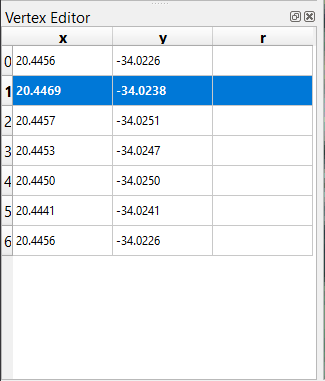
Notă
This table contains the coordinates for the vertices of the feature. Notice there are seven vertices for this feature, but only six are visually identified in the map area. Upon closer inspection, one will notice that row 0 and 6 have identical coordinates. These are the start and end vertices of the feature geometry, and are required in order to create a closed polygon feature.
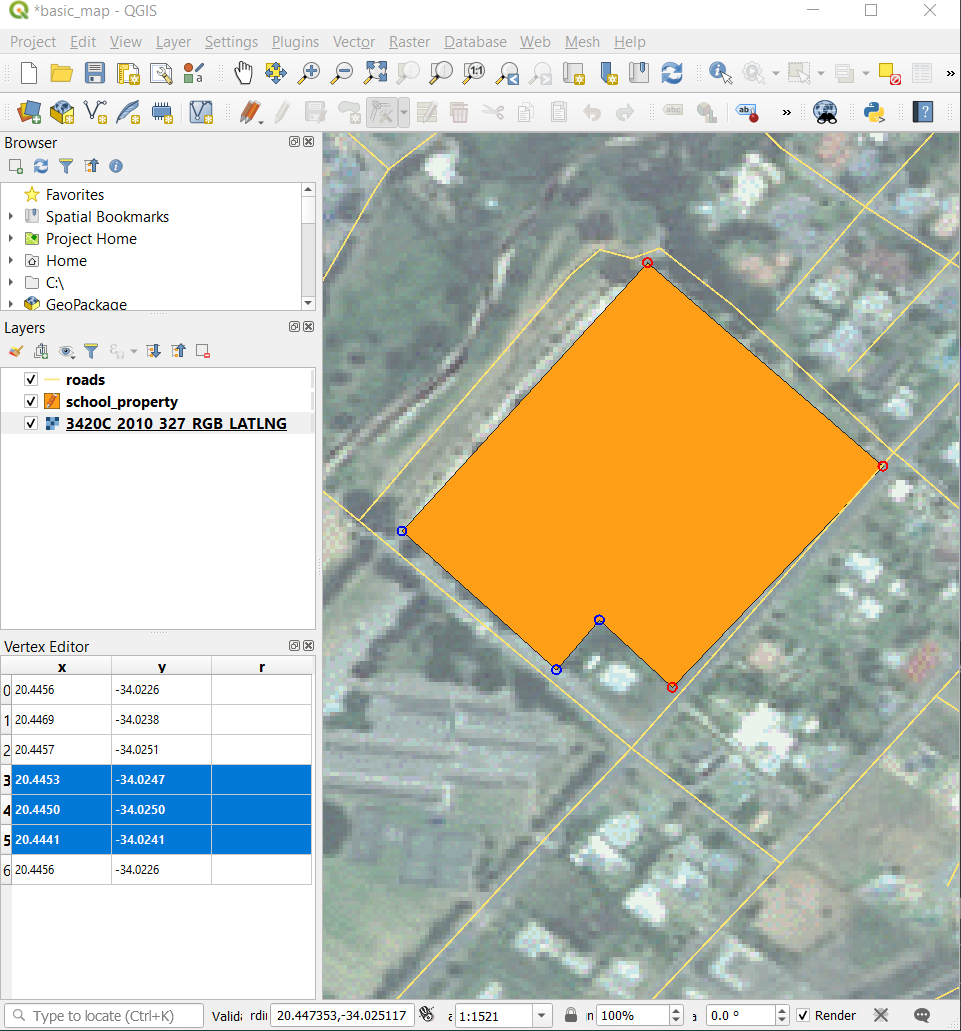
Click and drag a box over a vertex, or multiple vertices, of the selected feature.
The selected vertices will change to a color blue and the Vertex Editor table will have the corresponding rows highlighted, which contain the coordinates of the vertices.
To update a coordinate, double left click on the cell in the table that you want to edit and enter the updated value. In this example, the x coordinate of row
4is updated from20.4450to20.4444.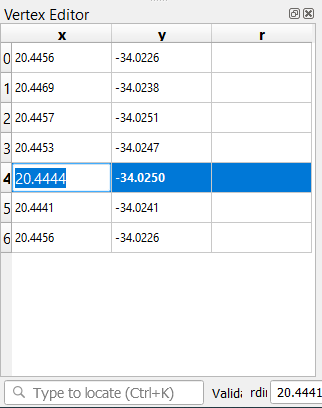
After entering the updated value, hit the enter key to apply the change. You will see the vertex move to the new location in the map window.
When done editing, click the
Toggle Editing
button to get out of edit mode, and save your edits.
5.1.5. Try Yourself Digitizing Lines
We are going to digitize two routes which are not already marked on the roads layer; one is a path, the other is a track. Our path runs along the southern edge of the suburb of Railton, starting and ending at marked roads:
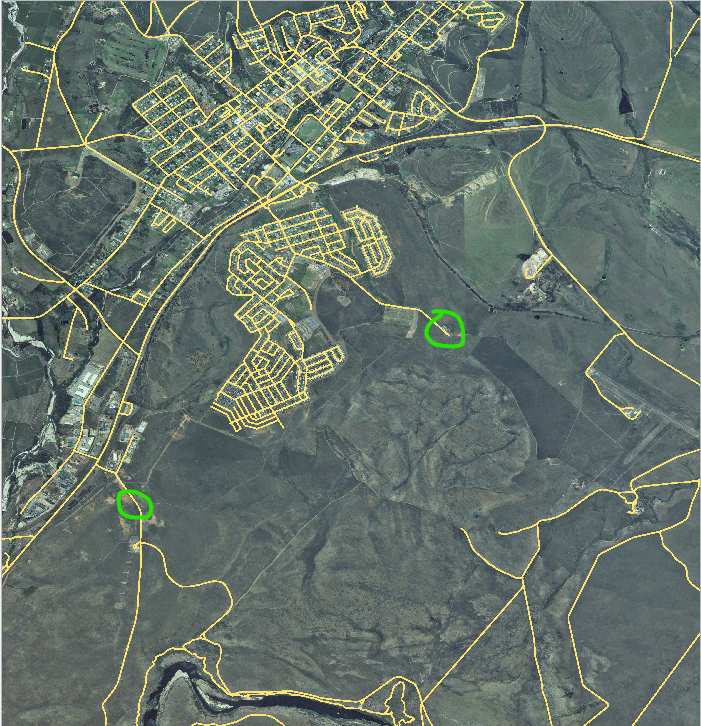
Piste este situată un pic mai departe de sud:
If the roads layer is not yet in your map, then add the
roadslayer from the GeoPackage filetraining-data.gpkgincluded in theexercise_datafolder of the training data you downloaded. You can read Follow Along: Loading vector data from a GeoPackage Database for a how-to.Create a new ESRI Shapefile line dataset called
routes.shpin theexercise_datadirectory, with attributesidandtype(use the approach above to guide you.)Activate edit mode on the routes layer.
Since you are working with a line feature, click on the
 Add Line button to initiate line
digitizing mode.
Add Line button to initiate line
digitizing mode.One at a time, digitize the path and the track on the
routeslayer. Try to follow the routes as accurately as possible, adding additional points along corners or turns.Set the
typeattribute value topathortrack.Use the Layer Properties dialog to add styling to your routes. Feel free to use different styles for paths and tracks.
Save your edits and toggle off editing mode by pressing the
Toggle Editing button.
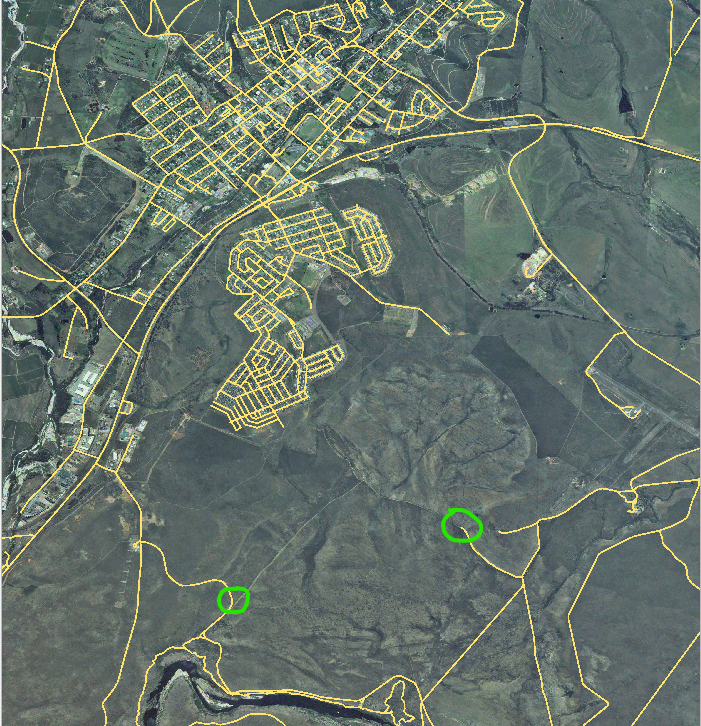
Answer
The symbology doesn’t matter, but the results should look more or less like this:
5.1.6. In Conclusion
Acum știți cum să creați entități! Acest curs nu acoperă adăugarea entităților de tip punct, deoarece nu este neapărat necesară după ce ați lucrat cu entități mai complexe (lini și poligoane). Funționează exact la fel, cu excepția faptului că dați clic doar o singură dată unde doriți să plasați punctul, îi completați atributele ca de obicei, după care entitatea este creată.
Cunoașterea digitizării este importantă deoarece reprezintă o activitate frecventă în aplicațiile GIS.
5.1.7. What’s Next?
Features in a GIS layer aren’t just pictures, but objects in space. For example, adjacent polygons know where they are in relation to one another. This is called topology. In the next lesson you’ll see an example of why this can be useful.