5.1. Lesson: 새 벡터 데이터셋 생성
여러분이 사용하는 데이터는 출처가 있어야 합니다. 가장 일반적인 응용 작업의 경우, 이미 존재하는 데이터를 사용합니다. 그러나 특별하고 전문적인 프로젝트일수록, 사용할 수 있는 데이터가 이미 존재할 가능성은 적어집니다. 이런 경우 여러분 자신의 새 데이터를 생성해야 합니다.
이 강의의 목표: 새 벡터 데이터셋 생성하기.
5.1.1.  Follow Along: 레이어 생성 대화 창
새 벡터 데이터를 추가하려면 먼저 데이터를 추가할 벡터 데이터셋이 필요합니다. 이 예제에서는 기존 데이터셋을 편집하기보다 완전히 새로운 데이터를 생성해보려 합니다. 따라서 사용자 자신의 새 데이터셋을 먼저 정의해야 합니다.
Open QGIS and create a new blank project.
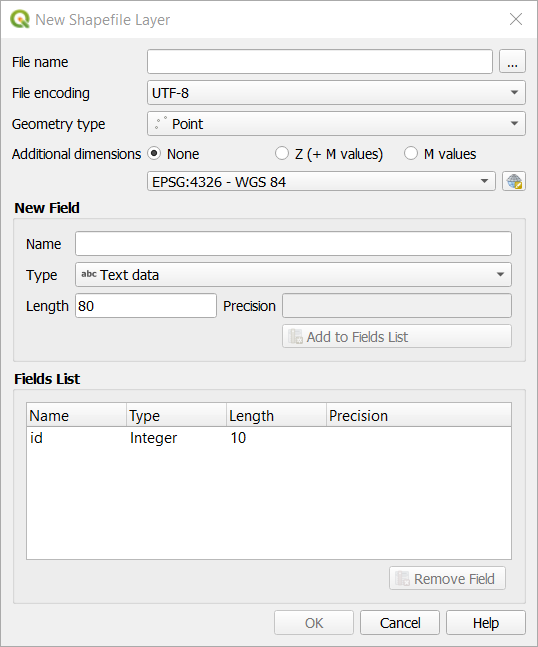
Navigate to and click on the menu entry . You’ll be presented with the New Shapefile Layer dialog, which will allow you to define a new layer.
Click … for the File name field. A save dialog will appear.
Navigate to the
exercise_datadirectory.Save your new layer as
school_property.shp.이 단계에서 어떤 유형의 데이터셋을 생성할지 결정하는 것이 중요합니다. 서로 다른 벡터 레이어 유형은 백그라운드에서 “서로 다르게” 구성되기 때문에 레이어를 생성한 후에는 유형을 변경할 수 없기 때문입니다.
For the next exercise, we’re going to create new features which describe areas. For such features, you’ll need to create a polygon dataset.
For Geometry Type, select Polygon from the drop down menu:

대화 창의 다른 항목에 아무런 영향도 미치지 않지만, 벡터 데이터셋을 생성했을 때 정확한 도형 유형을 사용하게 해줍니다.
The next field allows you to specify the Coordinate Reference System, or CRS. CRS is a method of associating numerical coordinates with a position on the surface of the Earth. See the User Manual on Working with Projections to learn more.
For this example we will use the default CRS associated with this project, which is WGS84.

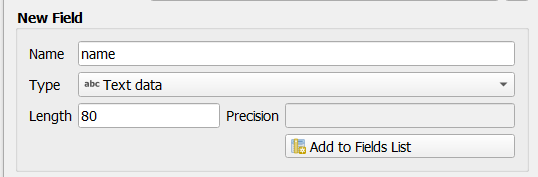
Next there is a collection of fields grouped under New Field. By default, a new layer has only one attribute, the
idfield (which you should see in the Fields list) below. However, in order for the data you create to be useful, you actually need to say something about the features you’ll be creating in this new layer. For our current purposes, it will be enough to add one field callednamethat will holdText dataand will be limited to text length of80characters.Replicate the setup below, then click the Add to Fields List button:
대화 창이 다음 그림처럼 보이는지 확인하십시오.
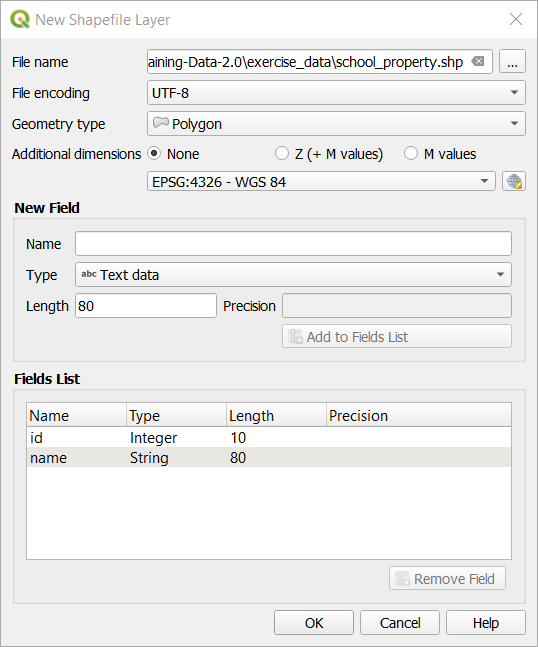
OK 를 클릭합니다.
The new layer should appear in your Layers panel.
5.1.2. Follow Along: 데이터소스
새 데이터를 생성하는 작업은 당연히 지표면에 실재하는 오브젝트에 관련된 것이어야 합니다. 따라서 어딘가에서 해당 정보를 구해야 합니다.
오브젝트 관련 데이터를 구할 수 있는 방법은 많습니다. 예를 들어 GPS를 이용해서 실재 세계에 있는 포인트들을 데이터화한 다음 QGIS로 불러들일 수 있습니다. 또는 경위의 측량계를 통해 포인트를 측정한 다음 좌표를 직접 입력해서 새 피처를 생성할 수도 있습니다. 아니면 위성영상이나 항공사진 같은 원격탐사 데이터로부터 오브젝트를 따오는 디지털라이즈 작업을 할 수도 있습니다.
이 예제에서는 디지털라이즈 작업을 이용합니다. 래스터 데이터셋 샘플을 갖추고 있으므로, 필요한 대로 불러들여야 합니다.
Click on
 Data Source Manager button.
Select
 Raster on the left side.
In the Source panel, click on the … button:
Navigate to
exercise_data/raster/.Select the file
3420C_2010_327_RGB_LATLNG.tif.Click Open to close the dialogue window.
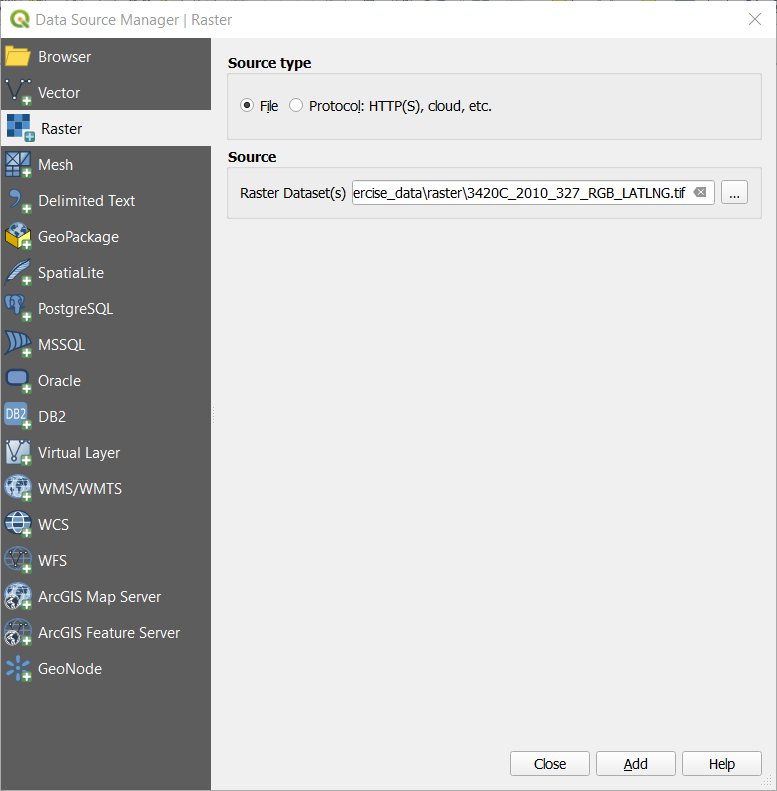
Click Add and Close. An image will load into your map.
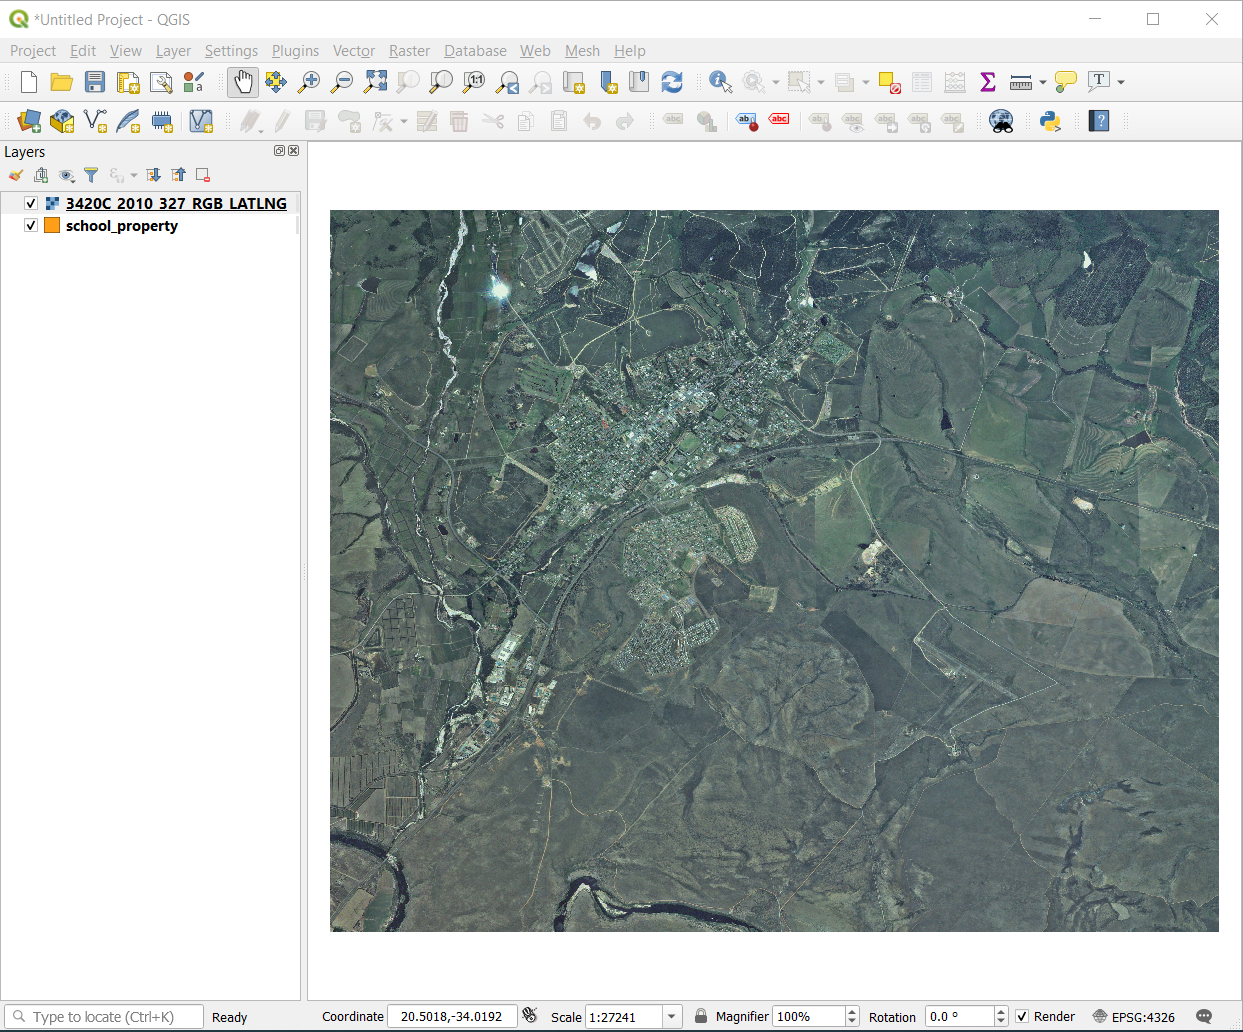
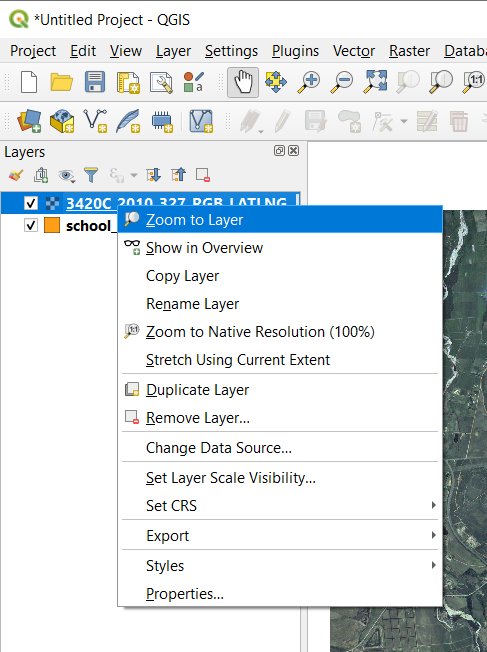
If you don’t see an aerial image appear, select the new layer, right click, and choose Zoom to Layer in the context menu.
Click on the
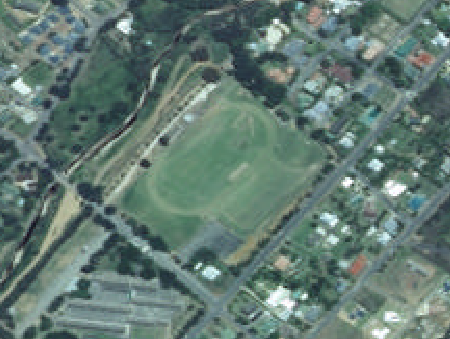
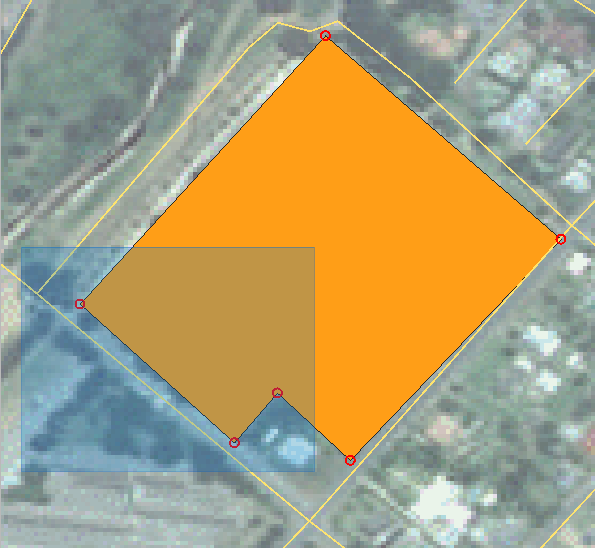
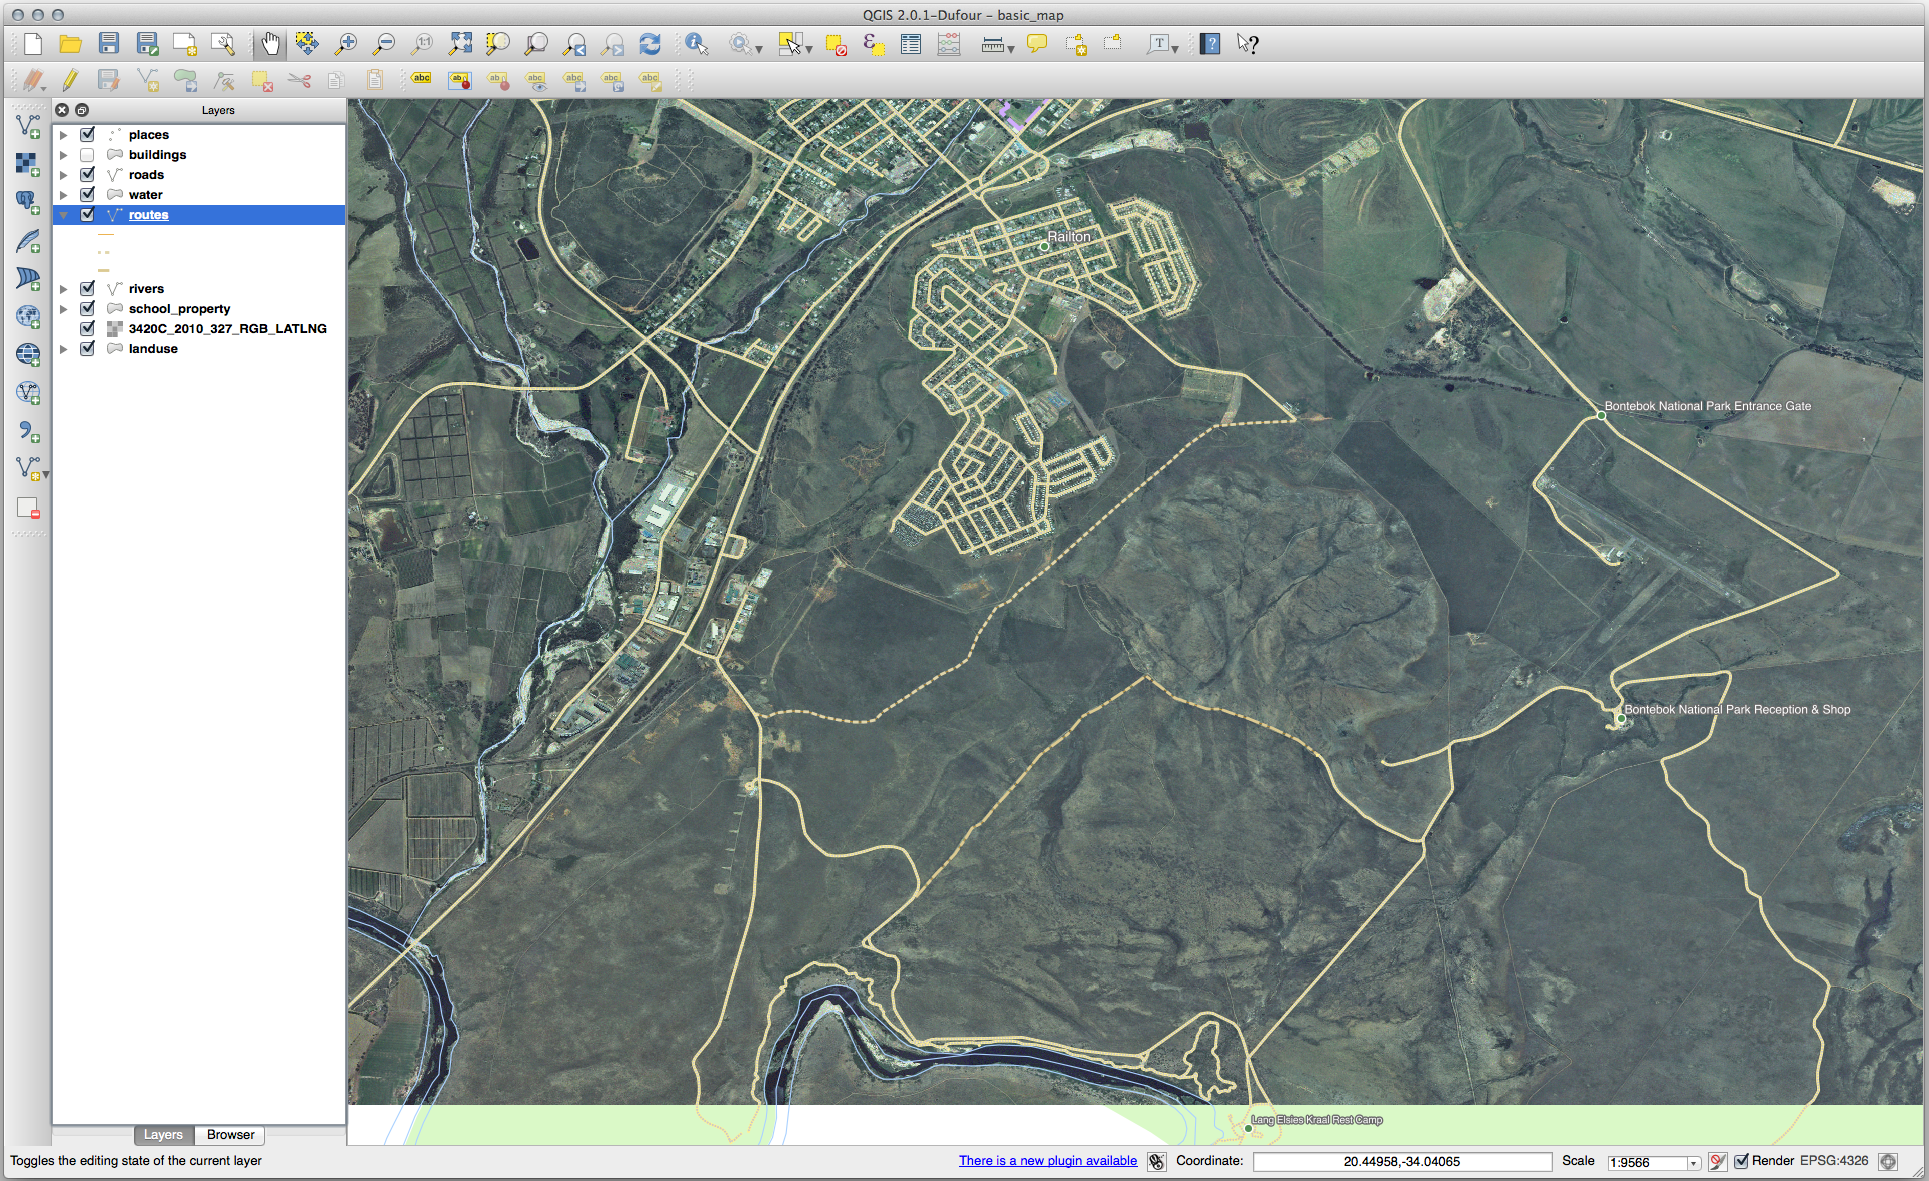
 Zoom In button, and zoom to the area highlighted in blue below:
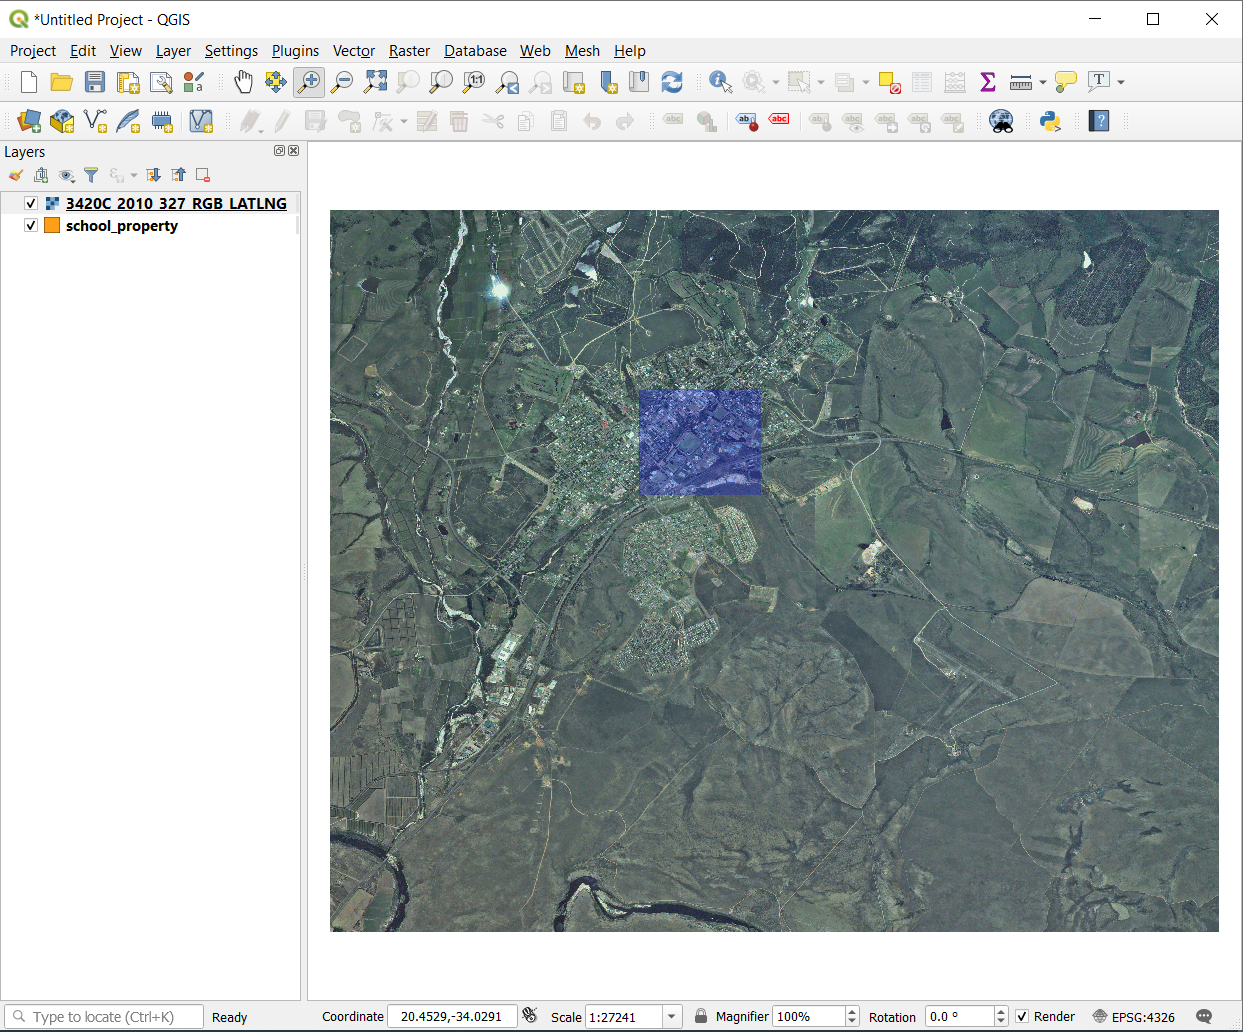
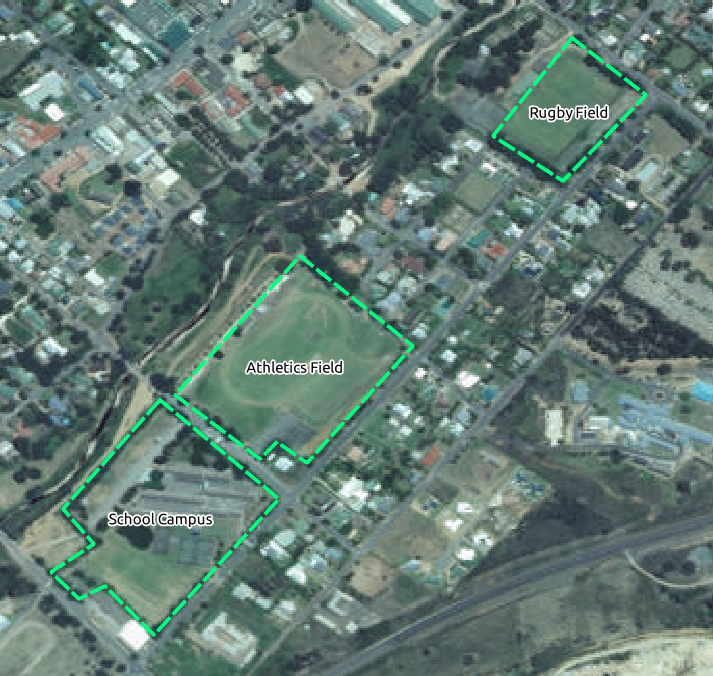
Now you are ready to digitize these three fields:
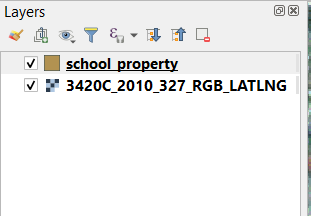
Before starting to digitize, let’s move the school_property layer above the aerial image.
Select
school_propertylayer in the Layers pane and drag it to the top.
디지타이즈를 시작하려면 편집 모드 로 들어가야 합니다. GIS 소프트웨어는 우연히 중요한 데이터를 편집하거나 삭제하는 일을 막기 위해 일반적으로 이런 단계를 거치게 합니다. 각 레이어에 대해 개별적으로 편집 모드를 켜거나 끌 수 있습니다.
To enter edit mode for the school_property layer:
Click on the
school_propertylayer in the Layers panel to select it.Click on the
 Toggle Editing button.
이 버튼을 찾을 수 없을 경우, Digitizing 툴바가 활성화돼 있는지 확인해보십시오. 메뉴 항목 옆에 체크 표시가 있어야 합니다.
As soon as you are in edit mode, you’ll see that some digitizing tools have become active:
 Capture Polygon
 Vertex Tool
Other relevant buttons are still inactive, but will become active when we start interacting with our new data.
Notice that the layer
school_propertyin the Layers panel now has the pencil icon, indicating that it is in edit mode.Click on the
Capture Polygon button to begin digitizing
our school fields.You’ll notice that your mouse cursor has become a crosshair. This allows you to more accurately place the points you’ll be digitizing. Remember that even when you’re using the digitizing tool, you can zoom in and out on your map by rolling the mouse wheel, and you can pan around by holding down the mouse wheel and dragging around in the map.
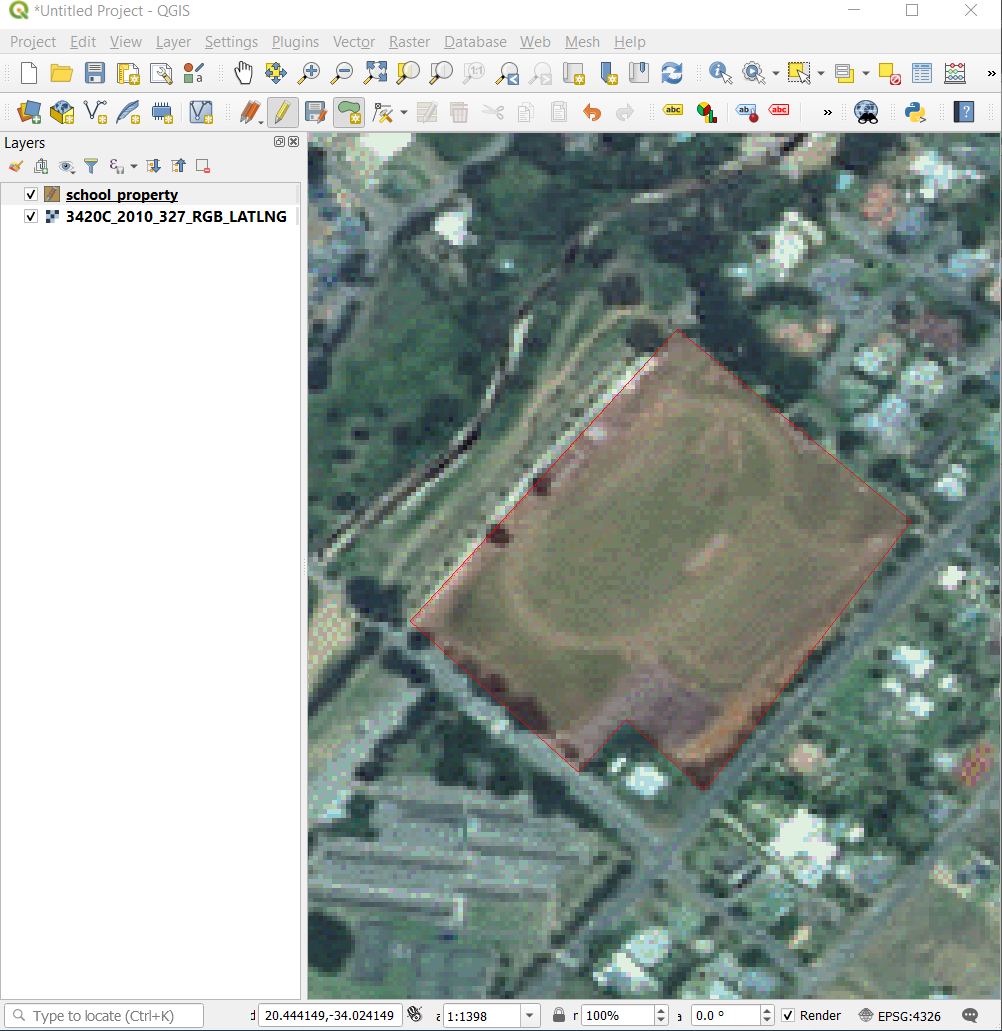
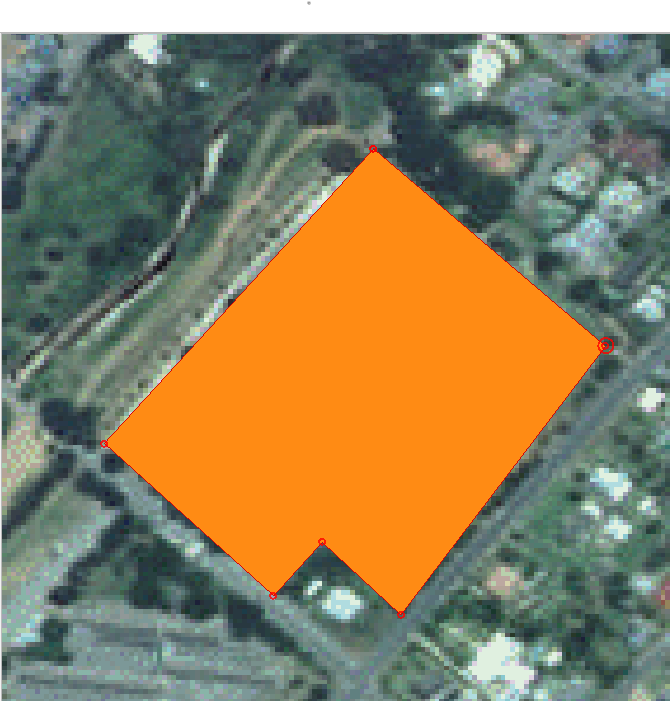
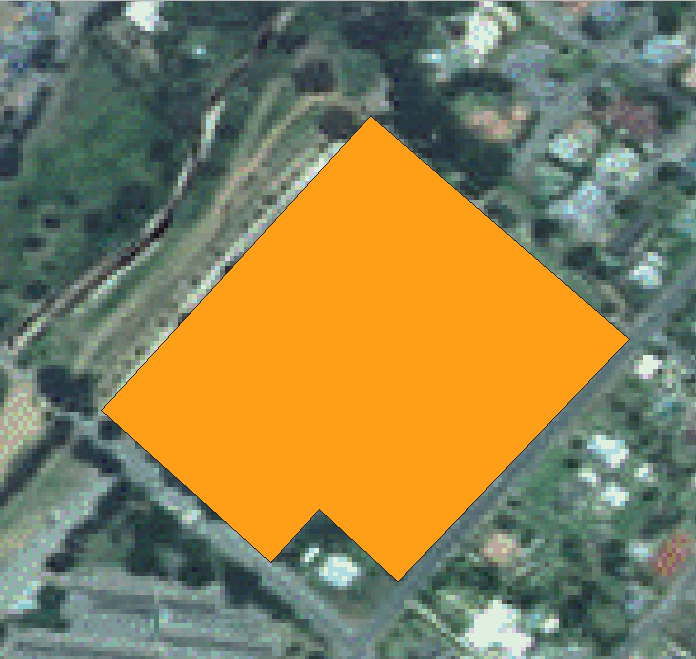
여러분이 디지타이즈할 첫 번째 피처는 다음 athletics field 입니다.
운동장의 경계 어딘가의 포인트를 클릭해서 디지타이즈 작업을 시작합니다.
여러분이 그리는 도형이 운동장을 완전히 가릴 때까지 경계를 따라 계속 포인트를 클릭합니다.
After placing your last point, right click to finish drawing the polygon. This will finalize the feature and show you the Attributes dialog.
다음과 같이 값을 입력하십시오.
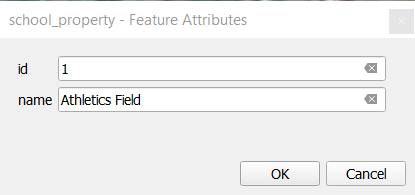
Click OK, and you have created a new feature!
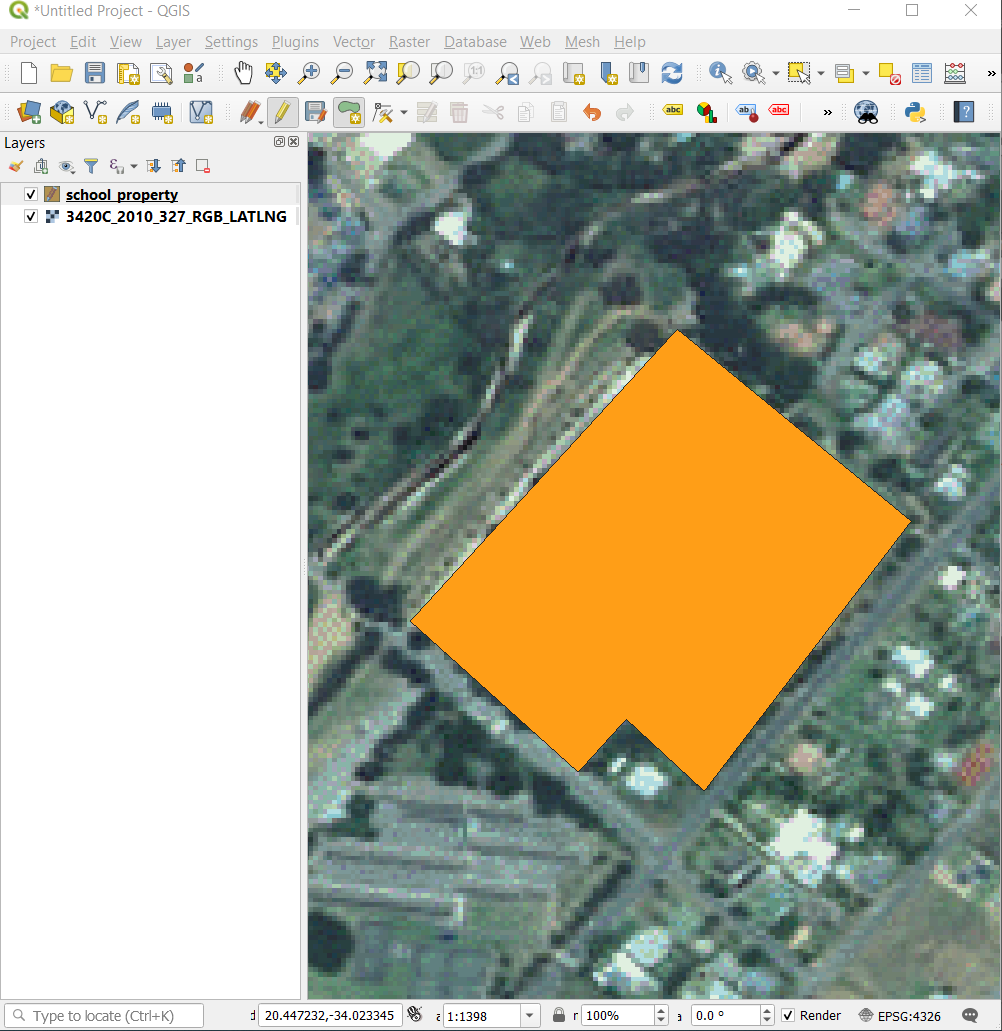
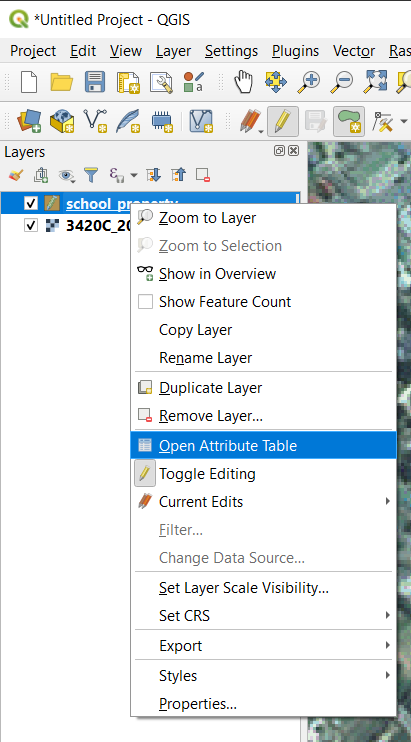
In the Layers panel select the
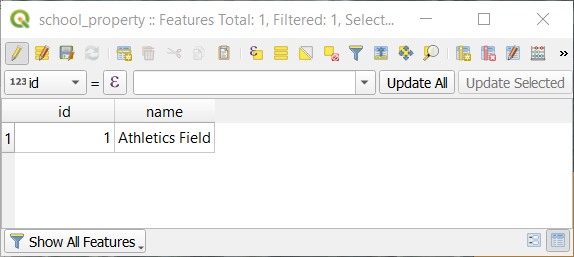
school_propertylayer.Right click and choose Open Attribute Table in the context menu.
In the table you will see the feature you just added. While in edit mode you can update the attributes data by double click on the cell you want to update.
속성 테이블을 닫습니다.
To save the new feature we just created, click on
 Save Edits button.
피처를 디지타이즈할 때 실수를 했을 경우, 피처 생성 후에 언제라도 편집/수정할 수 있다는 사실을 기억하십시오. 실수를 했다 하더라도 앞의 지침대로 피처를 완성할 때까지 디지타이즈 작업을 계속한 다음,
Click on
Vertex Tool button.Hover the mouse over a vertex you want to move and left click on the vertex.
Move the mouse to the correct location of the vertex, and left click. This will move the vertex to the new location.
The same procedure can be used to move a line segment, but you will need to hover over the midpoint of the line segment.
If you want to undo a change, you can press the
 Undo button or Ctrl+Z.
Remember to save your changes by clicking the
Save Edits button.When done editing, click the
Toggle Editing button
to get out of edit mode.
5.1.3. Try Yourself Digitizing Polygons
이제 학교와 그 위에 있는 운동장을 디지타이즈해보겠습니다. 다음 이미지를 참고하십시오.
Remember that each new feature needs to have a unique id value!
참고
레이어에 피처를 추가하는 작업이 끝나면, 편집한 내용을 저장하고 편집 모드에서 나와야 한다는 사실을 잊지 마십시오.
참고
You can style the fill, outline and label placement and formatting
of the school_property using techniques learnt in earlier
lessons.
5.1.4.  Follow Along: Using Vertex Editor Table
Another way to edit a feature is to manually enter the actual coordinate values for each vertex using the Vertex Editor table.
Make sure you are in edit mode on layer
school_property.If not already activated, click on
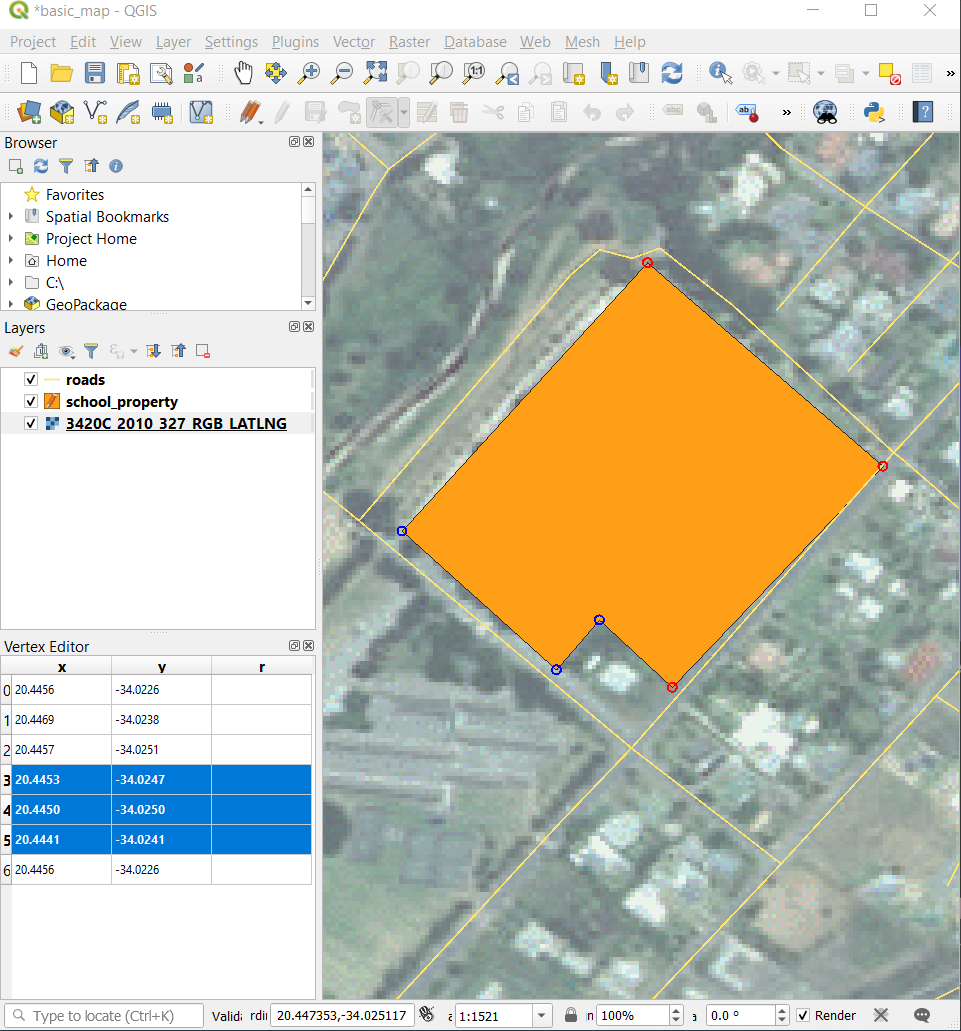
Vertex Tool button.Move the mouse over one of the polygon features you created in the
school_propertylayer and right click on it. This will select the feature and a Vertex Editor pane will appear.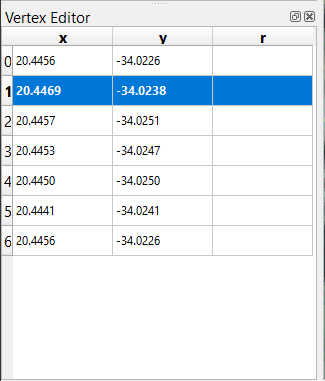
참고
This table contains the coordinates for the vertices of the feature. Notice there are seven vertices for this feature, but only six are visually identified in the map area. Upon closer inspection, one will notice that row 0 and 6 have identical coordinates. These are the start and end vertices of the feature geometry, and are required in order to create a closed polygon feature.
Click and drag a box over a vertex, or multiple vertices, of the selected feature.
The selected vertices will change to a color blue and the Vertex Editor table will have the corresponding rows highlighted, which contain the coordinates of the vertices.
To update a coordinate, double left click on the cell in the table that you want to edit and enter the updated value. In this example, the x coordinate of row
4is updated from20.4450to20.4444.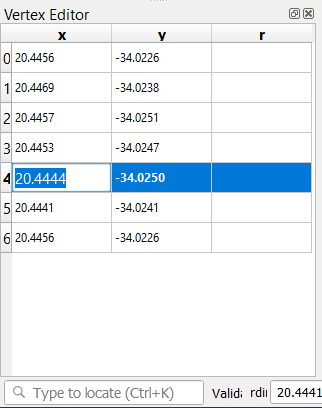
After entering the updated value, hit the enter key to apply the change. You will see the vertex move to the new location in the map window.
When done editing, click the
Toggle Editing
button to get out of edit mode, and save your edits.
5.1.5. Try Yourself Digitizing Lines
We are going to digitize two routes which are not already marked on the roads layer; one is a path, the other is a track. Our path runs along the southern edge of the suburb of Railton, starting and ending at marked roads:
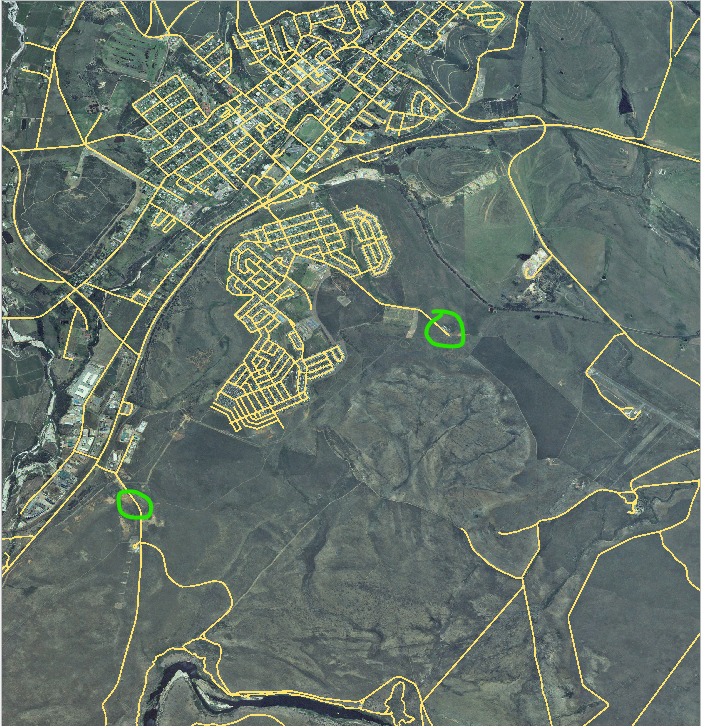
산길은 좀 더 남쪽에 있습니다.
If the roads layer is not yet in your map, then add the
roadslayer from the GeoPackage filetraining-data.gpkgincluded in theexercise_datafolder of the training data you downloaded. You can read Follow Along: GeoPackage 데이터베이스에서 벡터 데이터 불러오기 for a how-to.Create a new ESRI Shapefile line dataset called
routes.shpin theexercise_datadirectory, with attributesidandtype(use the approach above to guide you.)Activate edit mode on the routes layer.
Since you are working with a line feature, click on the
 Add Line button to initiate line
digitizing mode.
Add Line button to initiate line
digitizing mode.One at a time, digitize the path and the track on the
routeslayer. Try to follow the routes as accurately as possible, adding additional points along corners or turns.Set the
typeattribute value topathortrack.Use the Layer Properties dialog to add styling to your routes. Feel free to use different styles for paths and tracks.
Save your edits and toggle off editing mode by pressing the
Toggle Editing button.
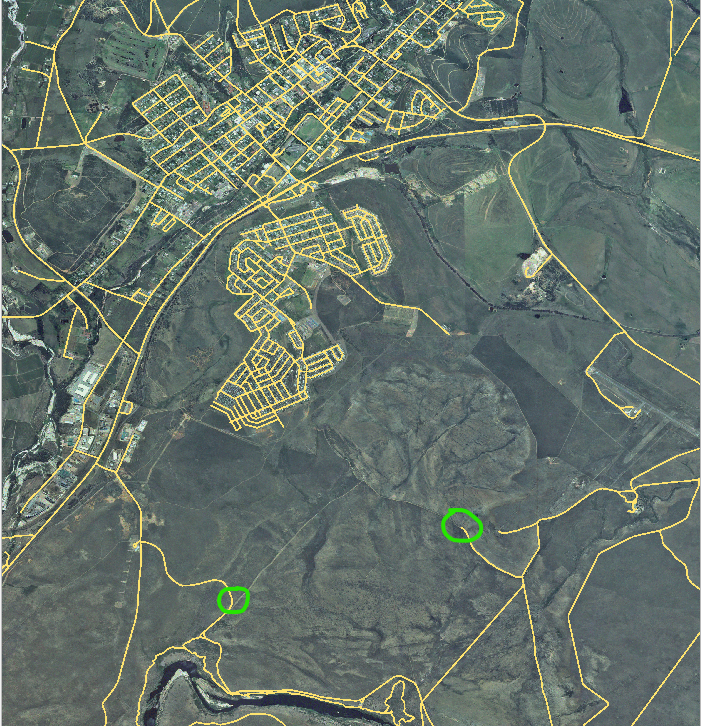
Answer
The symbology doesn’t matter, but the results should look more or less like this:
5.1.6. In Conclusion
이제 피처를 생성하는 법을 배웠습니다! 이 강의에서는 포인트 피처를 추가하는 법을 다루지 않았는데, 여러분이 (라인이나 폴리곤 같은) 좀 더 복잡한 피처를 다루는 법을 안다면 포인트 피처도 쉽게 생성할 수 있기 때문입니다. 포인트 위치를 딱 한 번 클릭하는 것만 제외하면, 속성을 부여하고 피처를 생성하는 방법은 똑같습니다.
디지타이즈는 GIS 프로그램을 사용하면서 매우 일상적인 작업이기 때문에 그 방법을 아는 것은 매우 중요합니다.
5.1.7. What’s Next?
Features in a GIS layer aren’t just pictures, but objects in space. For example, adjacent polygons know where they are in relation to one another. This is called topology. In the next lesson you’ll see an example of why this can be useful.