11. Spatial Analysis (Interpolation)
|
Цели: |
Understanding of interpolation as part of spatial analysis |
Ключови думи: |
Point data, interpolation method, Inverse Distance Weighted, Triangulated Irregular Network |
11.1. Преглед
Spatial analysis is the process of manipulating spatial information to extract new information and meaning from the original data. Usually spatial analysis is carried out with a Geographic Information System (GIS). A GIS usually provides spatial analysis tools for calculating feature statistics and carrying out geoprocessing activities as data interpolation. In hydrology, users will likely emphasize the importance of terrain analysis and hydrological modelling (modelling the movement of water over and in the earth). In wildlife management, users are interested in analytical functions dealing with wildlife point locations and their relationship to the environment. Each user will have different things they are interested in depending on the kind of work they do.
11.2. Spatial interpolation in detail
Spatial interpolation is the process of using points with known values to estimate values at other unknown points. For example, to make a precipitation (rainfall) map for your country, you will not find enough evenly spread weather stations to cover the entire region. Spatial interpolation can estimate the temperatures at locations without recorded data by using known temperature readings at nearby weather stations (see Fig. 11.40). This type of interpolated surface is often called a statistical surface. Elevation data, precipitation, snow accumulation, water table and population density are other types of data that can be computed using interpolation.
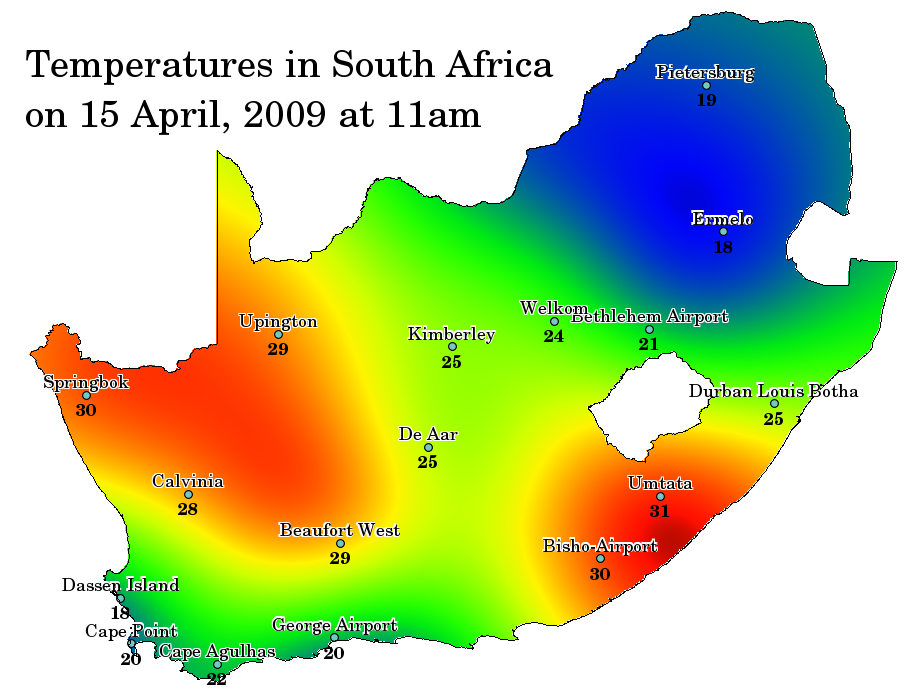
Fig. 11.40 Temperature map interpolated from South African Weather Stations.
Because of high cost and limited resources, data collection is usually conducted only in a limited number of selected point locations. In GIS, spatial interpolation of these points can be applied to create a raster surface with estimates made for all raster cells.
In order to generate a continuous map, for example, a digital elevation map from elevation points measured with a GPS device, a suitable interpolation method has to be used to optimally estimate the values at those locations where no samples or measurements were taken. The results of the interpolation analysis can then be used for analyses that cover the whole area and for modelling.
There are many interpolation methods. In this introduction we will present two widely used interpolation methods called Inverse Distance Weighting (IDW) and Triangulated Irregular Networks (TIN). If you are looking for additional interpolation methods, please refer to the ‚Further Reading‘ section at the end of this topic.
11.3. Inverse Distance Weighted (IDW)
In the IDW interpolation method, the sample points are weighted during interpolation such that the influence of one point relative to another declines with distance from the unknown point you want to create (see Fig. 11.41).
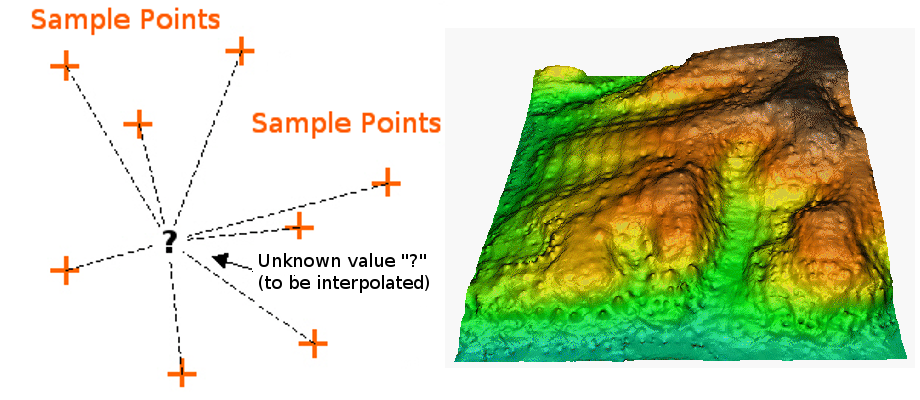
Fig. 11.41 Inverse Distance Weighted interpolation based on weighted sample point distance (left). Interpolated IDW surface from elevation vector points (right). Image Source: Mitas, L., Mitasova, H. (1999).
Weighting is assigned to sample points through the use of a weighting coefficient that controls how the weighting influence will drop off as the distance from new point increases. The greater the weighting coefficient, the less the effect points will have if they are far from the unknown point during the interpolation process. As the coefficient increases, the value of the unknown point approaches the value of the nearest observational point.
It is important to notice that the IDW interpolation method also has some disadvantages: the quality of the interpolation result can decrease, if the distribution of sample data points is uneven. Furthermore, maximum and minimum values in the interpolated surface can only occur at sample data points. This often results in small peaks and pits around the sample data points as shown in Fig. 11.41.
In GIS, interpolation results are usually shown as a 2 dimensional raster layer. In Fig. 11.42, you can see a typical IDW interpolation result, based on elevation sample points collected in the field with a GPS device.
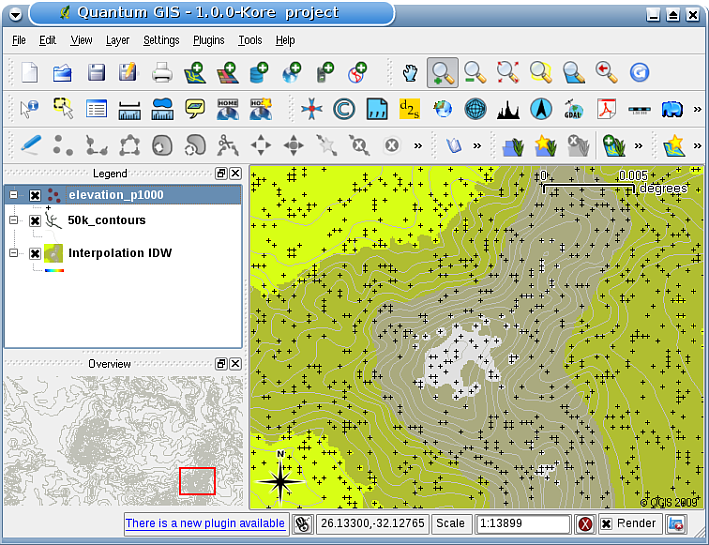
Fig. 11.42 IDW interpolation result from irregularly collected elevation sample points (shown as black crosses).
11.4. Triangulated Irregular Network (TIN)
TIN interpolation is another popular tool in GIS. A common TIN algorithm is called Delaunay triangulation. It tries to create a surface formed by triangles of nearest neighbour points. To do this, circumcircles around selected sample points are created and their intersections are connected to a network of non overlapping and as compact as possible triangles (see Fig. 11.43).
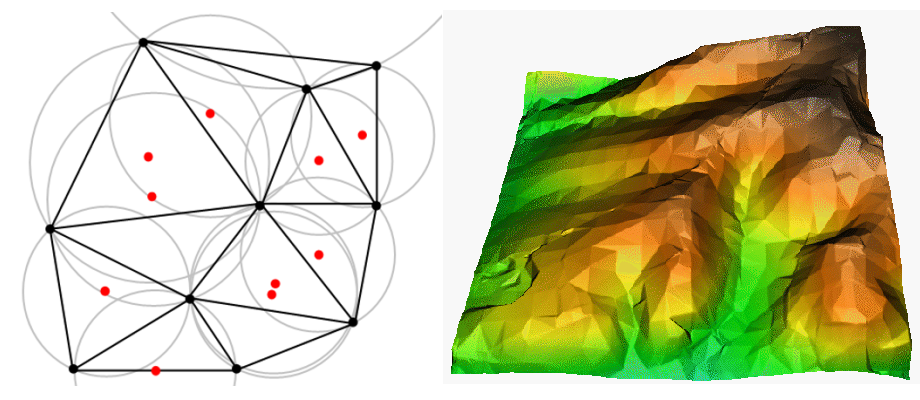
Fig. 11.43 Delaunay triangulation with circumcircles around the red sample data. The resulting interpolated TIN surface created from elevation vector points is shown on the right. Image Source: Mitas, L., Mitasova, H. (1999).
The main disadvantage of the TIN interpolation is that the surfaces are not smooth and may give a jagged appearance. This is caused by discontinuous slopes at the triangle edges and sample data points. In addition, triangulation is generally not suitable for extrapolation beyond the area with collected sample data points (see Fig. 11.44 ).
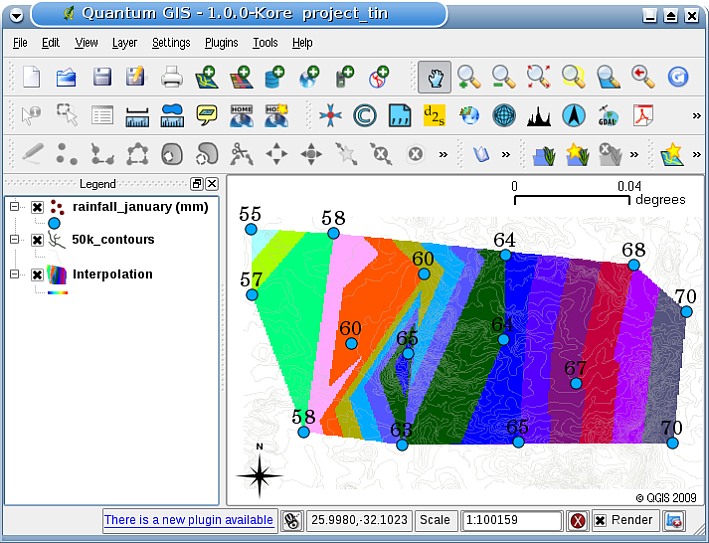
Fig. 11.44 Delaunay TIN interpolation result from irregularly collected rainfall sample points (blue circles)
11.5. Common problems / things to be aware of
It is important to remember that there is no single interpolation method that can be applied to all situations. Some are more exact and useful than others but take longer to calculate. They all have advantages and disadvantages. In practice, selection of a particular interpolation method should depend upon the sample data, the type of surfaces to be generated and tolerance of estimation errors. Generally, a three step procedure is recommended:
Evaluate the sample data. Do this to get an idea on how data are distributed in the area, as this may provide hints on which interpolation method to use.
Apply an interpolation method which is most suitable to both the sample data and the study objectives. When you are in doubt, try several methods, if available.
Compare the results and find the best result and the most suitable method. This may look like a time consuming process at the beginning. However, as you gain experience and knowledge of different interpolation methods, the time required for generating the most suitable surface will be greatly reduced.
11.6. Other interpolation methods
Although we concentrated on IDW and TIN interpolation methods in this worksheet, there are more spatial interpolation methods provided in GIS, such as Regularized Splines with Tension (RST), Kriging or Trend Surface interpolation. See the additional reading section below for a web link.
11.7. Какво научихме?
Да обобщим какво покрихме с този работен лист:
Interpolation uses vector points with known values to estimate values at unknown locations to create a raster surface covering an entire area.
The interpolation result is typically a raster layer.
It is important to find a suitable interpolation method to optimally estimate values for unknown locations.
IDW interpolation gives weights to sample points, such that the influence of one point on another declines with distance from the new point being estimated.
TIN interpolation uses sample points to create a surface formed by triangles based on nearest neighbour point information.
11.8. Сега вие опитайте!
Here are some ideas for you to try with your learners:
The Department of Agriculture plans to cultivate new land in your area but apart from the character of the soils, they want to know if the rainfall is sufficient for a good harvest. All the information they have available comes from a few weather stations around the area. Create an interpolated surface with your learners that shows which areas are likely to receive the highest rainfall.
The tourist office wants to publish information about the weather conditions in January and February. They have temperature, rainfall and wind strength data and ask you to interpolate their data to estimate places where tourists will probably have optimal weather conditions with mild temperatures, no rainfall and little wind strength. Can you identify the areas in your region that meet these criteria?
11.9. Something to think about
If you don’t have a computer available, you can use a toposheet and a ruler to estimate elevation values between contour lines or rainfall values between fictional weather stations. For example, if rainfall at weather station A is 50 mm per month and at weather station B it is 90 mm, you can estimate, that the rainfall at half the distance between weather station A and B is 70 mm.
11.10. За следващо четене
Книги:
Chang, Kang-Tsung (2006). Introduction to Geographic Information Systems. 3rd Edition. McGraw Hill. ISBN: 0070658986
DeMers, Michael N. (2005): Fundamentals of Geographic Information Systems. 3rd Edition. Wiley. ISBN: 9814126195
Mitas, L., Mitasova, H. (1999). Spatial Interpolation. In: P.Longley, M.F. Goodchild, D.J. Maguire, D.W.Rhind (Eds.), Geographical Information Systems: Principles, Techniques, Management and Applications, Wiley.
Сайтове:
The QGIS User Guide also has more detailed information on interpolation tools provided in QGIS.
11.11. Какво следва?
This is the final worksheet in this series. We encourage you to explore QGIS and use the accompanying QGIS manual to discover all the other things you can do with GIS software!