Important
Traducerea este un efort al comunității, la care puteți să vă alăturați. În prezent, această pagină este tradusă 80.67%.
2. Prezentare GIS
|
Obiective: |
Înțelegerea a ceea ce este GIS și la ce poate fi folosit. |
Cuvinte cheie: |
GIS, Computer, Hărți, Date, Sistem de Informații Spațiale, Analiză |
2.1. Prezentare generală
Așa cum folosim un procesor de text pentru a scrie documente, în același mod putem folosi o aplicație GIS pentru a organiza informațiile spațiale. GIS reprezintă un acronim pentru «Sistem de Informaţii Geografice».
GIS este alcătuit din:
Digital Data — the geographical information that you will view and analyse using computer hardware and software.
Computer Hardware — computers used for storing data, displaying graphics and processing data.
Computer Software — computer programs that run on the computer hardware and allow you to work with digital data. A software program that forms part of the GIS is called a GIS Application.
Cu o aplicație GIS se pot deschide hărți digitale de pe computer, se pot adăuga noi informații spațiale hărților existente, se pot tipări hărți personalizate și se poate efectua analiza spațială.
Să ne uităm la un mic exemplu, despre cum poate fi GIS util. Imaginați-vă că sunteți un lucrător în domeniul sănătății și faceți o notă, în care plasați data și locul de reședință al fiecărui pacient pe care-l tratați.
Longitudine |
Latitudine |
Boală |
Data |
|---|---|---|---|
26.870436 |
-31.909519 |
Oreion |
13/12/2008 |
26.868682 |
-31.909259 |
Oreion |
24/12/2008 |
26.867707 |
-31.910494 |
Oreion |
22/01/2009 |
26.854908 |
-31.920759 |
Pojar |
11/01/2009 |
26.855817 |
-31.921929 |
Pojar |
26/01/2009 |
26.852764 |
-31.921929 |
Pojar |
10/02/2009 |
26.854778 |
-31.925112 |
Pojar |
22/02/2009 |
26.869072 |
-31.911988 |
Oreion |
02/02/2009 |
26.863354 |
-31.916406 |
Varicelă |
26/02/2009 |
Dacă priviți tabelul de mai sus, veți observa rapid că au existat o mulțime de cazuri de rujeolă în ianuarie și februarie. Lucrătorul în sănătate a înregistrat locația casei fiecărui pacient, notând latitudinea și longitudinea în tabel. Folosind aceste date într-o aplicație GIS, putem înțelege repede mult mai multe despre modelul îmbolnăvirii:
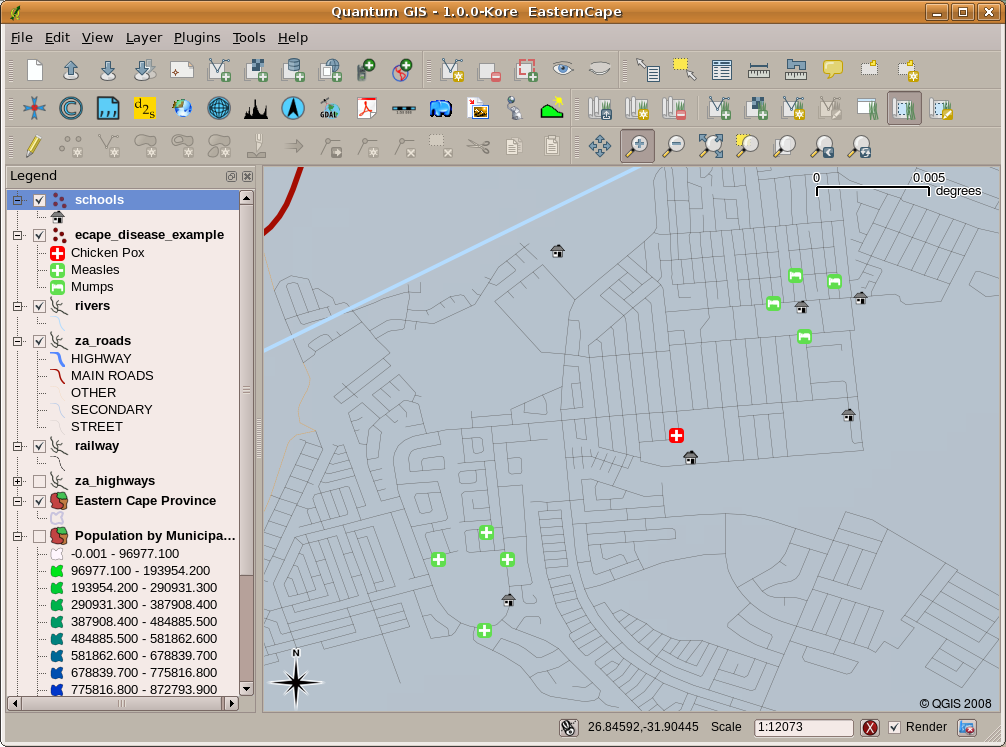
Fig. 2.11 Exemplu de înregistrare a bolilor într-o aplicație GIS. Este ușor de observat că pacienții cu oreion locuiesc toți aproape unul de altul.
2.2. Mai multe despre GIS
GIS is a relatively new field — it started in the 1970’s. It used to be that computerised GIS was only available to companies and universities that had expensive computer equipment. These days, anyone with a personal computer or laptop can use GIS software. Over time GIS Applications have also become easier to use — it used to require a lot of training to use a GIS Application, but now it is much easier to get started in GIS even for amateurs and casual users. As we described above, GIS is more than just software, it refers to all aspects of managing and using digital geographical data. In the tutorials that follow we will be focusing on GIS Software.
2.3. Ce este un software GIS / o aplicație GIS?
You can see an example of what a GIS Application looks like in Fig. 2.11. GIS Applications are normally programs with a graphical user interface that can be manipulated using the mouse and keyboard. The application provides menus near to the top of the window (Project, Edit, etc.) which, when clicked using the mouse, show a panel of actions. These actions provide a way for you to tell the GIS Application what you want to do. For example you may use the menus to tell the GIS Application to add a new layer to the display output, as in Fig. 2.12.
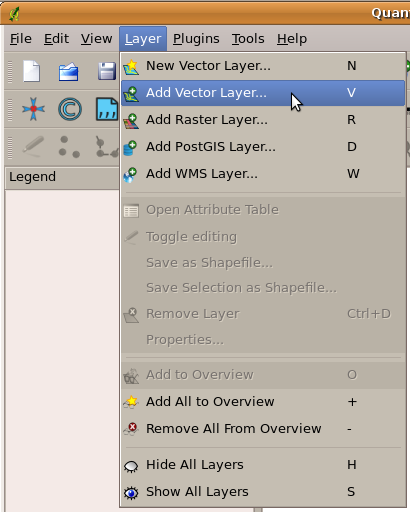
Fig. 2.12 Meniurile aplicațiile, când faceți clic cu mouse-ul, se extind pentru a afișa lista acțiunilor care pot fi efectuate.
As seen in Fig. 2.13, toolbars (rows of small pictures that can be clicked with the mouse) normally sit just below the menus and provide a quicker way to use frequently needed actions.
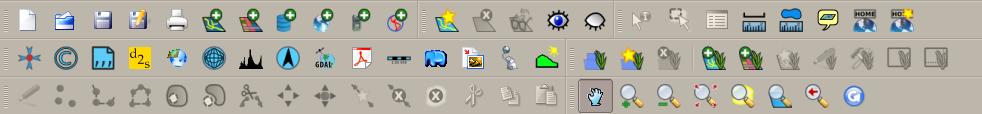
Fig. 2.13 Barele de instrumente oferă acces rapid la funcțiile utilizate frecvent. Ținând mouse-ul peste o imagine vi se va spune, de obicei, ce urmează să se întâmple atunci când faceți clic pe ea.
A common function of GIS Applications is to display map layers. Map layers are stored as files on a disk or as records in a database. Normally each map layer will represent something in the real world — a roads layer for example will have data about the street network.
When you open a layer in the GIS Application it will appear in the map view. The map view shows a graphic representing your layer. When you add more than one layer to a map view, the layers are overlaid on top of each other. Look at figures Fig. 2.14, Fig. 2.15, Fig. 2.16 and Fig. 2.17 to see a map view that has several layers being added to it.
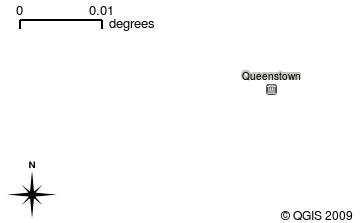
Fig. 2.14 A towns layer added to the map view
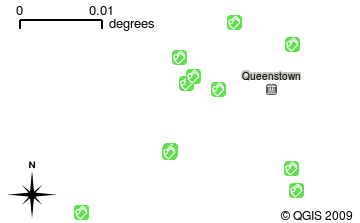
Fig. 2.15 A schools layer added to the map view
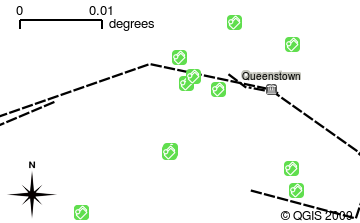
Fig. 2.16 A railways layer added to the map view
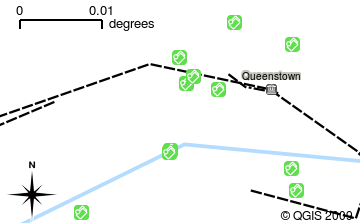
Fig. 2.17 A rivers layer added to the map view
An important function of the map view is to allow you to zoom in to magnify, zoom out to see a greater area and move around (panning) in the map. GIS software also lets you easily change symbology — the way information is displayed. Fig. 2.18 shows the map view after panning to the side and changing the symbology of the layers.
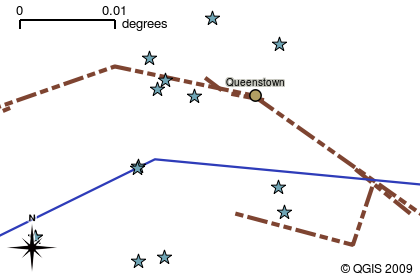
Fig. 2.18 A map view after moving around (panning) and changing the symbology
Another common feature of GIS Applications is the map legend. The map legend provides a list of layers that have been loaded in the GIS Application. Unlike a paper map legend, the map legend or «layers list» in the GIS Application provides a way to re-order, hide, show and group layers. Changing the layer order is done by clicking on a layer in the legend, holding the mouse button down and then dragging the layer to a new position. In Fig. 2.19 and Fig. 2.20, the map legend is shown as the area to the left of the GIS Application window. By changing the layer order, the way that layers are drawn can be adjusted — in this case so that rivers are drawn below the roads instead of over them.
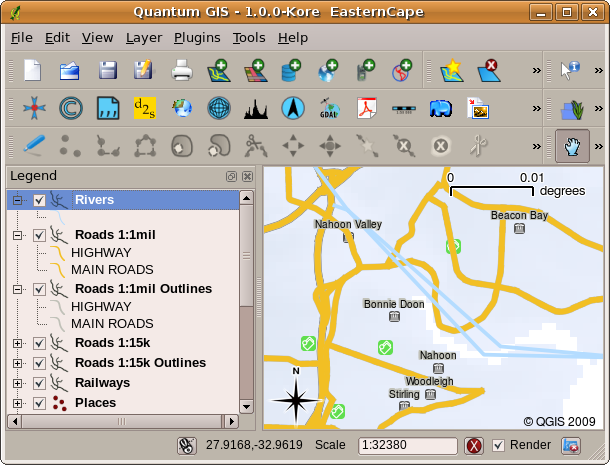
Fig. 2.19 Changing the layer order allows to adjust the way that layers are drawn. Before changing the layer order, rivers are drawn on top of roads
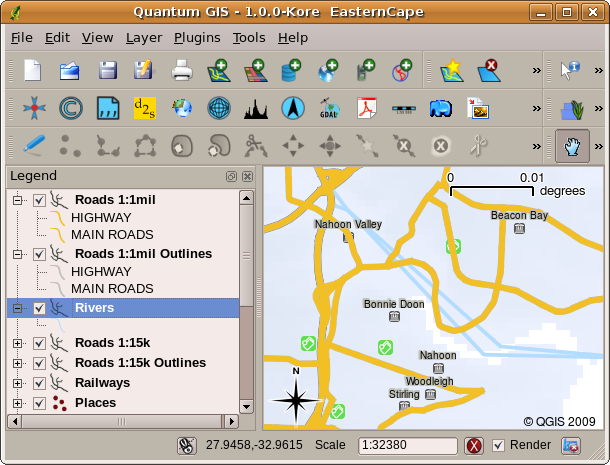
Fig. 2.20 Changing the layer order allows to adjust the way that layers are drawn. After changing the layer order, rivers are drawn underneath roads
2.4. Obținerea unei aplicații GIS pentru propriul computer(e)
There are many different GIS Applications available. Some have many sophisticated features and cost tens of thousands of Rands for each copy. In other cases, you can obtain a GIS Application for free. Deciding which GIS Application to use is a question of how much money you can afford and personal preference. For these tutorials, we will be using the QGIS Application. QGIS is completely free and you can copy it and share it with your friends as much as you like. If you received this tutorial in printed form, you should have received a copy of QGIS with it. If not, you can always visit https://www.qgis.org/ to download your free copy if you have access to the internet.
2.5. Datele GIS
Acum, că știm ce este un GIS și ceea ce poate face o aplicație GIS, haideți să vorbim despre Datele GIS. Datele reprezintă un alt cuvânt pentru informații. Informațiile pe care le folosim într-un GIS au, în mod normal, un aspect geografic. Gândiți-vă la exemplul nostru de mai sus, cu privire la lucrătoarea în îngrijirea sănătății. Ea a creat un tabel pentru a înregistra bolile care arată astfel:
Longitudine |
Latitudine |
Boală |
Data |
|---|---|---|---|
26.870436 |
-31.909519 |
Oreion |
13/12/2008 |
Coloanele longitudine și latitudine conțin date geografice. Coloanele boala și data conțin date non-geografice.
A common feature of GIS is that they allow you to associate information (non-geographical data) with places (geographical data). In fact, the GIS Application can store many pieces of information which are associated with each place — something that paper maps are not very good at. For example, our health care worker could store the person’s age and gender on her table. When the GIS Application draws the layer, you can tell it to draw the layer based on gender, or based on disease type, and so on. So, with a GIS Application we have a way to easily change the appearance of the maps we created based on the non-geographical data associated with places.
GIS Systems work with many different types of data. Vector data are stored as
a series of X, Y coordinate pairs inside the computer’s memory. Vector data
are used to represent points, lines and areas. Fig. 2.21
shows different types of vector data being viewed in a GIS application. In the
tutorials that follow we will be exploring vector data in more detail.
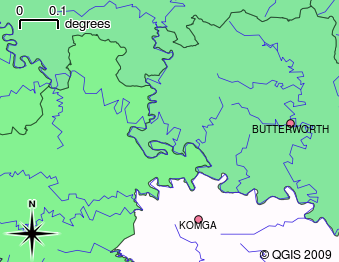
Fig. 2.21 Vector data are used to represent points (e.g., towns), lines (e.g., rivers) and polygons (e.g., municipal boundaries).
Raster data are stored as a grid of values. There are many satellites circling the earth and the photographs they take are a kind of raster data that can be viewed in a GIS. One important difference between raster and vector data is that if you zoom in too much on a raster image, it will start to appear «blocky» (see Fig. 2.22 and Fig. 2.23). In fact these blocks are the individual cells of the data grid that makes up the raster image. We will be looking at raster data in greater detail in later tutorials.
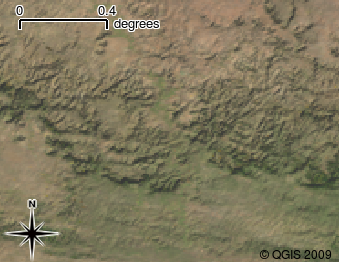
Fig. 2.22 Datele raster sunt adesea imagini luate din sateliți. Aici se pot vedea munții din Eastern Cape.
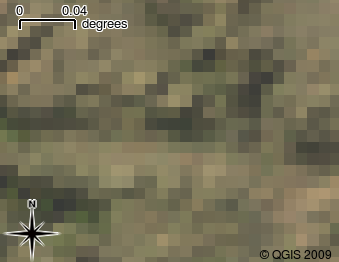
Fig. 2.23 Aceleași date raster, dar de data aceasta mărite. Se observă că datele sunt organizate într-o grilă.
2.6. Ce am învățat?
Să recapitulăm subiectele abordate în acest capitol:
Un GIS reprezintă un sistem alcătuit din hardware, software și date geografice.
O aplicație GIS vă permite să vizualizați datele geografice, reprezentând o parte importantă a GIS.
O aplicație GIS constă în mod normal dintr-o bară de meniuri, bare de instrumente , o vedere a hărții și o legendă.
Vectori și rasterele sunt datele geografice utilizate într-o aplicație GIS.
Date geografice pot avea date non-geografice.
2.7. Încercați acum!
Aici sunt câteva idei care pot fi testate împreună cu elevii dumneavoastră:
Geografie: descrieți conceptul de GIS elevilor dvs, cum s-a subliniat în acest tutorial. Cereți-le să se specifice 3 motive pentru care mai degrabă ar utiliza un GIS în locul hărților de hârtie. Iata câteva răspunsuri:
Aplicațiile GIS permit crearea mai multor tipuri diferite de hărți, pornind de la aceleași date.
GIS este un instrument bun pentru vizualizare, care vă poate arăta lucruri despre datele dvs și despre modul în care acestea sunt legate în spațiu (de exemplu, acele focare de boli pe care le-am văzut mai devreme).
Hărțile pe hârtie trebuie să fie împăturite, vizualizarea lor fiind consumatoare de timp. GIS poate stoca o cantitate foarte mare de date, permițând găsirea ușoară și rapidă a locului dorit.
Geografie: Puteți identifica, împreună cu elevii dvs., modalitățile în care datele raster provenite de la sateliți, v-ar putea fi de folos? Iată câteva idei:
În caz de dezastre naturale, datele raster pot fi utile în identificarea zonelor afectate. De exemplu, o imagine recent luată din satelit, în timpul unei inundații, pot arăta zonele în care oamenii ar putea necesita operațiuni de salvare.
Sometimes people do bad things to the environment, like dumping dangerous chemicals that kill plants and animals. Using raster data from satellites can help us to monitor for these types of problems.
Urbaniștii pot folosi datele raster de la sateliți pentru a vedea unde sunt așezările informale și pentru a ajuta la planificarea infrastructurii acestora.
2.8. De reținut
Dacă nu aveți un calculator disponibil, multe dintre subiectele pe care le acoperim în acest tutorial pot fi reproduse folosind un proiector cu folii transparente, întrucât se folosește aceeași tehnică de stratificare a informațiilor. Cu toate acestea, pentru a înțelege corect GIS, este mai bine să învățați cu ajutorul unui calculator.
2.9. Lecturi suplimentare
Carte: Desktop GIS: Maparea planetei cu ajutorul instrumentelor cu sursă deschisă. Autor: Gary Sherman. ISBN: 9781934356067
Ghidul utilizatorului QGIS conține, de asemenea, informații detaliate cu privire la lucrul în QGIS.
2.10. Ce urmează?
În secțiunile care urmează vom intra în mai multe detalii, arătându-vă cum să folosiți o aplicație GIS. Toate tutorialele se vor face cu ajutorul QGIS. Mai departe, să ne uităm la vectori!