Importante
A tradução é um esforço comunitário você pode contribuir. Esta página está atualmente traduzida em 80.67%.
2. Introdução aos SIG
|
Objectivos: |
Perceber o que são os SIG e a que fim se destinam. |
Palavras-chave: |
SIG, Computador, Mapas, Dados, Sistemas de Informação, Espacial, Análise. |
2.1. Resumo
Da mesma forma que usamos um processador de texto para escrever documentos e lidar com palavras num computador, podemos usar uma Aplicação SIG para lidar com dados geográficos num computador. SIG significa Sistemas de Informação Geográfica.
Um SIG consiste em:
Digital Data — the geographical information that you will view and analyse using computer hardware and software.
Computer Hardware — computers used for storing data, displaying graphics and processing data.
Computer Software — computer programs that run on the computer hardware and allow you to work with digital data. A software program that forms part of the GIS is called a GIS Application.
Com uma aplicação SIG podemos abrir mapas digitais no computador, cria nova informação espacial para adicionar ao mapa, imprimir mapas personalizados e efectuar analise espacial.
Vejamos um pequeno exemplo de como o SIG pode ser útil. Imagine que é um profissional de saúde e toma nota da data e do local de residência de cada paciente que trata.
Longitude |
Latitude |
Doença |
Data |
|---|---|---|---|
26.870436 |
-31.909519 |
Papeira |
13/12/2008 |
26.868682 |
-31.909259 |
Papeira |
24/12/2008 |
26.867707 |
-31.910494 |
Papeira |
22/01/2009 |
26.854908 |
-31.920759 |
Sarampo |
11/01/2009 |
26.855817 |
-31.921929 |
Sarampo |
26/01/2009 |
26.852764 |
-31.921929 |
Sarampo |
10/02/2009 |
26.854778 |
-31.925112 |
Sarampo |
22/02/2009 |
26.869072 |
-31.911988 |
Papeira |
02/02/2009 |
26.863354 |
-31.916406 |
Varicela |
26/02/2009 |
Se verificar na tabela acima, verá rapidamente que havia um monte de casos de sarampo em janeiro e fevereiro. O nosso funcionário de saúde registou a localização da casa de cada paciente, observando a sua latitude e longitude noa tabela. Usando esses dados numa aplicação SIG, podemos rapidamente entender muito mais sobre os padrões de doença:
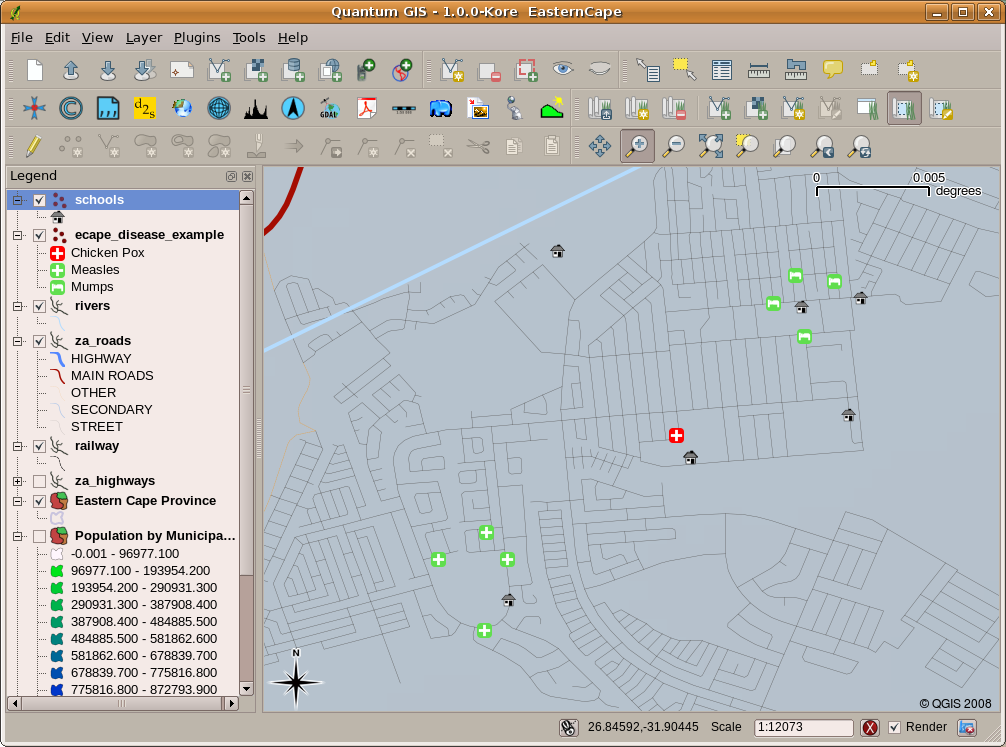
Fig. 2.11 Exemplo demonstrativo dos registos numa aplicação SIG. Facilmente verificamos que os pacientes com papeira vivem próximos uns dos outros.
2.2. Mais sobre SIG
GIS is a relatively new field — it started in the 1970’s. It used to be that computerised GIS was only available to companies and universities that had expensive computer equipment. These days, anyone with a personal computer or laptop can use GIS software. Over time GIS Applications have also become easier to use — it used to require a lot of training to use a GIS Application, but now it is much easier to get started in GIS even for amateurs and casual users. As we described above, GIS is more than just software, it refers to all aspects of managing and using digital geographical data. In the tutorials that follow we will be focusing on GIS Software.
2.3. O que é Software SIG / Aplicações SIG?
You can see an example of what a GIS Application looks like in Fig. 2.11. GIS Applications are normally programs with a graphical user interface that can be manipulated using the mouse and keyboard. The application provides menus near to the top of the window (Project, Edit, etc.) which, when clicked using the mouse, show a panel of actions. These actions provide a way for you to tell the GIS Application what you want to do. For example you may use the menus to tell the GIS Application to add a new layer to the display output, as in Fig. 2.12.
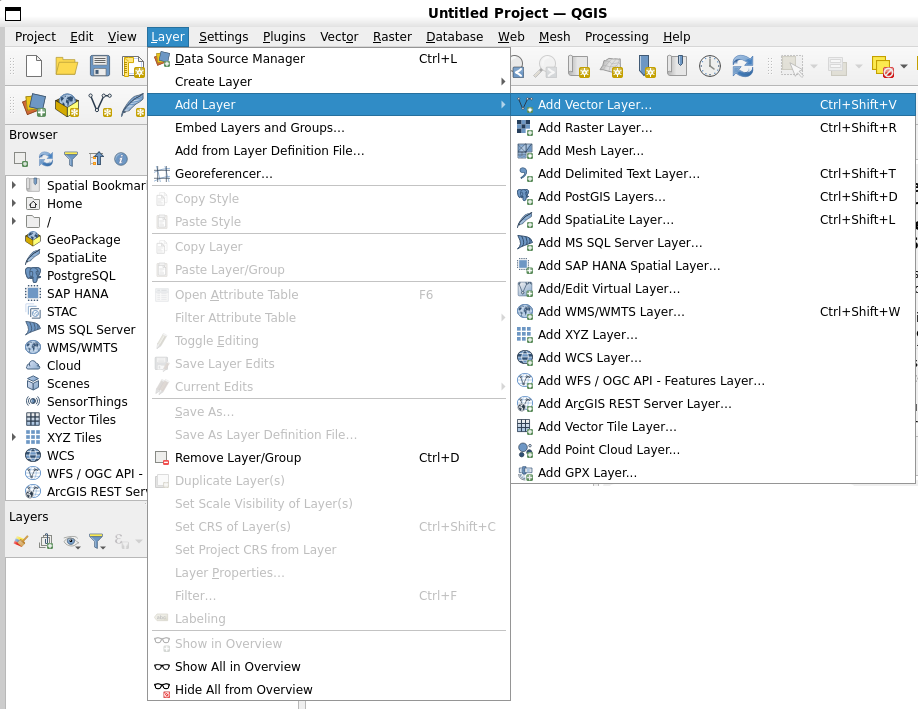
Fig. 2.12 Menus da aplicação, quando clica com o rato, expande-se e apresenta uma lista de ações que podem ser realizadas.
As seen in Fig. 2.13, toolbars (rows of small pictures that can be clicked with the mouse) normally sit just below the menus and provide a quicker way to use frequently needed actions.
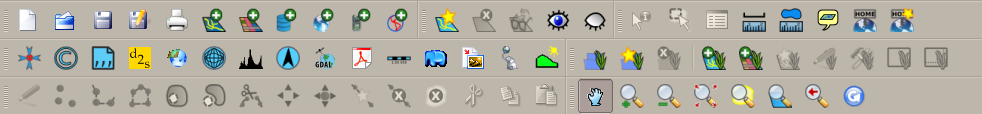
Fig. 2.13 Barra de tarefas permitem acesso rápido às funcionalidades mais utilizadas. Passando o rato sobre uma imagem, geralmente o que acontece caso clique sobre a mesma.
A common function of GIS Applications is to display map layers. Map layers are stored as files on a disk or as records in a database. Normally each map layer will represent something in the real world — a roads layer for example will have data about the street network.
When you open a layer in the GIS Application it will appear in the map view. The map view shows a graphic representing your layer. When you add more than one layer to a map view, the layers are overlaid on top of each other. Look at figures Fig. 2.14, Fig. 2.15, Fig. 2.16 and Fig. 2.17 to see a map view that has several layers being added to it.
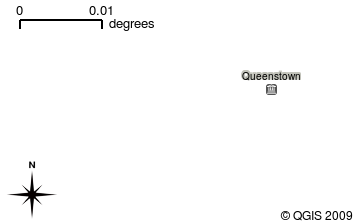
Fig. 2.14 A towns layer added to the map view
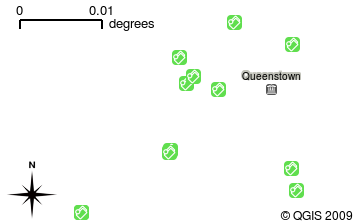
Fig. 2.15 A schools layer added to the map view
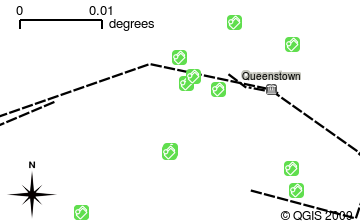
Fig. 2.16 A railways layer added to the map view
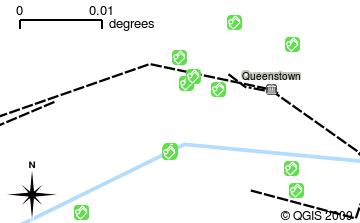
Fig. 2.17 A rivers layer added to the map view
An important function of the map view is to allow you to zoom in to magnify, zoom out to see a greater area and move around (panning) in the map. GIS software also lets you easily change symbology — the way information is displayed. Fig. 2.18 shows the map view after panning to the side and changing the symbology of the layers.
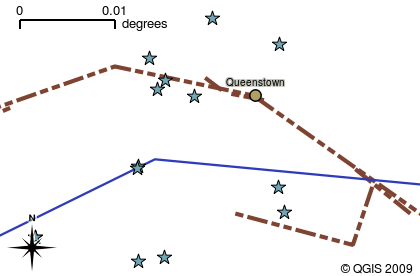
Fig. 2.18 A map view after moving around (panning) and changing the symbology
Another common feature of GIS Applications is the map legend. The map legend provides a list of layers that have been loaded in the GIS Application. Unlike a paper map legend, the map legend or “layers list” in the GIS Application provides a way to re-order, hide, show and group layers. Changing the layer order is done by clicking on a layer in the legend, holding the mouse button down and then dragging the layer to a new position. In Fig. 2.19 and Fig. 2.20, the map legend is shown as the area to the left of the GIS Application window. By changing the layer order, the way that layers are drawn can be adjusted — in this case so that rivers are drawn below the roads instead of over them.
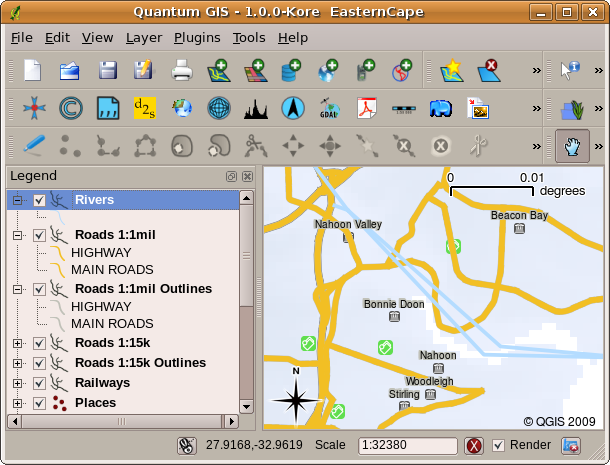
Fig. 2.19 Changing the layer order allows to adjust the way that layers are drawn. Before changing the layer order, rivers are drawn on top of roads
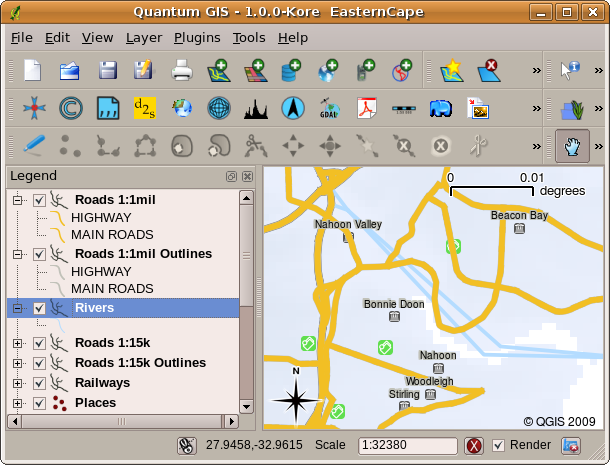
Fig. 2.20 Changing the layer order allows to adjust the way that layers are drawn. After changing the layer order, rivers are drawn underneath roads
2.4. Obter uma Aplicação SIG para seu próprio computador(es)
There are many different GIS Applications available. Some have many sophisticated features and cost tens of thousands of Rands for each copy. In other cases, you can obtain a GIS Application for free. Deciding which GIS Application to use is a question of how much money you can afford and personal preference. For these tutorials, we will be using the QGIS Application. QGIS is completely free and you can copy it and share it with your friends as much as you like. If you received this tutorial in printed form, you should have received a copy of QGIS with it. If not, you can always visit https://www.qgis.org/ to download your free copy if you have access to the internet.
2.5. Dados SIG
Agora que sabemos o que é um SIG e o que uma Aplicação SIG pode fazer, vamos falar sobre dados SIG. Os dados são outra palavra para informação. A informação que usamos em um SIG normalmente tem um aspecto geográfico. Pense no nosso exemplo acima, sobre a profissional de saúde. Ela criou uma tabela para registar doenças que se parece assim:
Longitude |
Latitude |
Doença |
Data |
|---|---|---|---|
26.870436 |
-31.909519 |
Papeira |
13/12/2008 |
As colunas de longitude e latitude possuem dados geográficos. As colunas doença e data possuem dados não geográficos.
A common feature of GIS is that they allow you to associate information (non-geographical data) with places (geographical data). In fact, the GIS Application can store many pieces of information which are associated with each place — something that paper maps are not very good at. For example, our health care worker could store the person’s age and gender on her table. When the GIS Application draws the layer, you can tell it to draw the layer based on gender, or based on disease type, and so on. So, with a GIS Application we have a way to easily change the appearance of the maps we created based on the non-geographical data associated with places.
GIS Systems work with many different types of data. Vector data are stored as
a series of X, Y coordinate pairs inside the computer’s memory. Vector data
are used to represent points, lines and areas. Fig. 2.21
shows different types of vector data being viewed in a GIS application. In the
tutorials that follow we will be exploring vector data in more detail.
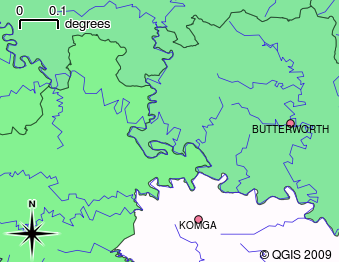
Fig. 2.21 Vector data are used to represent points (e.g., towns), lines (e.g., rivers) and polygons (e.g., municipal boundaries).
Raster data are stored as a grid of values. There are many satellites circling the earth and the photographs they take are a kind of raster data that can be viewed in a GIS. One important difference between raster and vector data is that if you zoom in too much on a raster image, it will start to appear “blocky” (see Fig. 2.22 and Fig. 2.23). In fact these blocks are the individual cells of the data grid that makes up the raster image. We will be looking at raster data in greater detail in later tutorials.
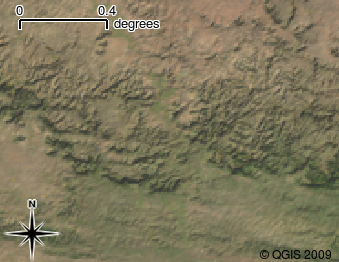
Fig. 2.22 Os dados de raster são muitas vezes imagens tiradas pelos satélites. Aqui podemos ver montanhas no Eastern Cape
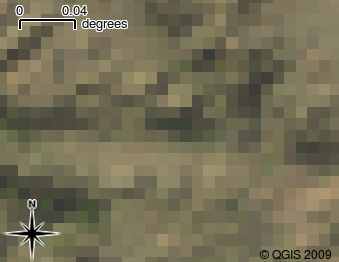
Fig. 2.23 Os mesmos dados de raster, mas desta vez ampliados. A aspeto da grelha dos dados pode ser vista.
2.6. O que aprendemos?
Resumindo o que abordámos na lista seguinte:
O SIG é um sistema composto de hardware, software e dados geográficos.
Uma Aplicação SIG permite visualizar dados geográficos e é uma parte importante do SIG.
Uma Aplicação SIG normalmente consiste numa barra de menu, ** barras de ferramentas**, um mapa e uma legenda.
Dados vetoriais e raster são dados geográficos utilizados numa aplicação de SIG.
Os dados geográficos podem ser associados a dados não geográficos.
2.7. Agora experimente!
Aqui está algumas ideias para experimentar com os seu alunos:
Geografia: descreva o conceito de SIG aos seus alunos, conforme descrito neste tutorial. Peça-lhes para tentarem pensar em 3 razões pelas quais pode ser útil usar um SIG em vez de mapas em papel. Aqui estão algumas delas:
As aplicações SIG permitem criar diferentes tipos de mapas com os mesmos dados.
O SIG é uma boa ferramenta de visualização que pode mostrar-lhe coisas sobre os seus dados e como eles se relacionam no espaço (por exemplo, as epidemias de doenças que vimos anteriormente).
Os mapas de papel necessitam de ser preenchidos e demoram a ser visualizados O SIG pode conter uma quantidade muito grande de dados de mapas e torná-lo rápido e fácil de encontrar um lugar em que você está interessado.
Geografia: você e os seus alunos podem pensar na forma como os dados raster a partir de satélites podem ser úteis? Aqui estão algumas ideias que tivemos:
Durante as catástrofes naturais, os dados raster podem ser úteis para mostrar onde estão as áreas que sofreram impactos. Por exemplo, uma imagem de satélite recente capturada durante uma inundação pode ajudar a mostrar os locais onde as pessoas necessitam de ser resgatadas.
Sometimes people do bad things to the environment, like dumping dangerous chemicals that kill plants and animals. Using raster data from satellites can help us to monitor for these types of problems.
Os urbanistas podem usar dados raster a partir de satélites para ver onde as povoações informais estão e para ajudar no planeamento de infraestruturas.
2.8. Algo para reflectir
Se não tiver um computador disponível, muitos dos tópicos mencionados neste tutorial podem ser reproduzidos e sobrepostos usando a mesma técnica dos layers. No entanto, para entender devidamente SIG o ideal será usar um computador.
2.9. Outras leituras
Livro: Desktop GIS: Mapping the Planet with Open Source Tools. Autor: Gary Sherman. ISBN: 9781934356067
O Guia de Utilizador do QGIS também tem informação mais detalhada de como trabalhar com QGIS.
2.10. O que vem a seguir?
Nas secções que se seguem, vamos entrar em mais detalhes, mostrando-lhe como usar uma aplicação SIG. Todos os tutoriais serão feitos utilizando o QGIS. Em seguida, vamos olhar para vetores!