Important
La traduction est le fruit d’un effort communautaire auquel vous pouvez vous joindre. Cette page est actuellement traduite à 83.19%.
2. SIG : Présentation
|
Objectifs : |
Comprendre ce qu’est un SIG et comment il peut être utilisé. |
Mots clés : |
SIG, informatique, cartes, données, système d’information, analyse spatiale |

2.1. Aperçu
Tout comme nous utilisons un traitement de texte pour écrire des documents et traiter des mots sur un ordinateur, nous pouvons utiliser une application SIG pour traiter l’information spatiale sur un ordinateur. SIG est synonyme de “système d’information géographique”.
Un SIG est constitué :
Digital Data — the geographical information that you will view and analyse using computer hardware and software.
Computer Hardware — computers used for storing data, displaying graphics and processing data.
Computer Software — computer programs that run on the computer hardware and allow you to work with digital data. A software program that forms part of the GIS is called a GIS Application.
Avec une application SIG vous pouvez ouvrir et afficher des cartes numériques sur votre ordinateur, créer de nouvelles données spatiales à ajouter sur une carte.
Voyons un petit exemple sur l’utilité des SIG. Imaginons que vous êtes un travailleur sanitaire et prenez notez de la date et du lieu de résidence de chacun de vos patients.
Longitude |
Latitude |
Maladie |
Date |
|---|---|---|---|
26.870436 |
-31.909519 |
Oreillons |
13/12/2008 |
26.868682 |
-31.909259 |
Oreillons |
24/12/2008 |
26.867707 |
-31.910494 |
Oreillons |
22/01/2009 |
26.854908 |
-31.920759 |
Rougeole |
11/01/2009 |
26.855817 |
-31.921929 |
Rougeole |
26/01/2009 |
26.852764 |
-31.921929 |
Rougeole |
10/02/2009 |
26.854778 |
-31.925112 |
Rougeole |
22/02/2009 |
26.869072 |
-31.911988 |
Oreillons |
02/02/2009 |
26.863354 |
-31.916406 |
Varicelle |
26/02/2009 |
Si vous regardez la table ci-dessus, vous verrez rapidement qu’il y avait beaucoup de cas de rougeole en janvier et février. Notre inspecteur de la santé publique a enregistré l’emplacement de la maison de chaque patient en notant sa latitude et longitude dans la table. En utilisant ces données dans une application SIG, nous pouvons rapidement comprendre beaucoup plus de modèles de maladie :
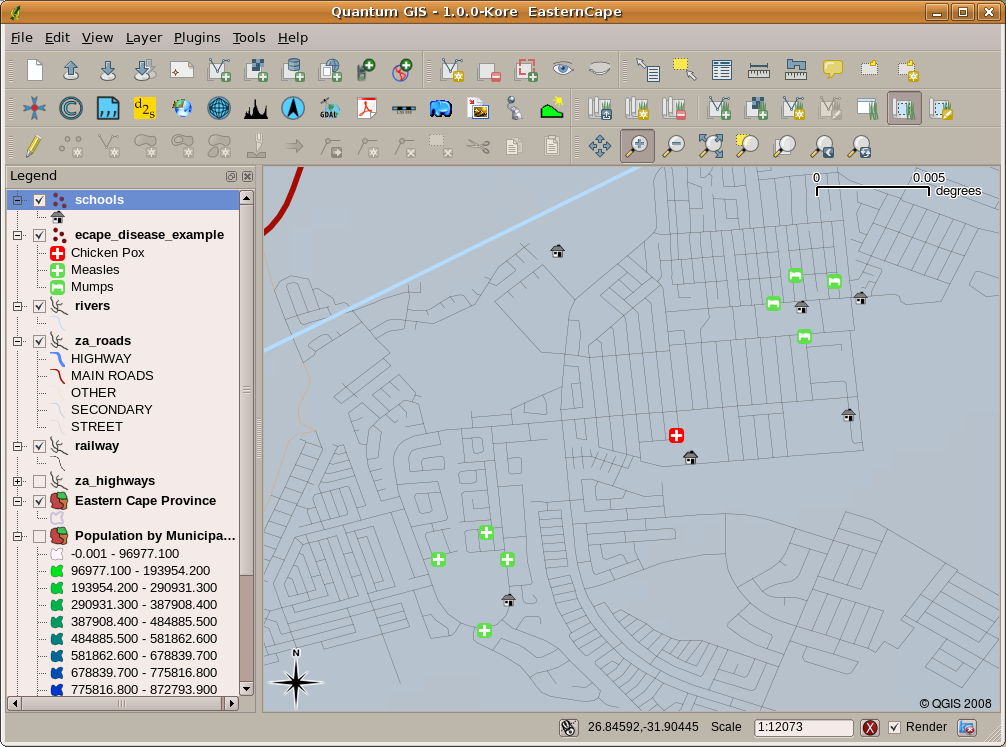
Fig. 2.11 L’exemple montrant les enregistrements de la maladie dans une application SIG. Il est facile de voir que les patients atteints d’oreillons vivent l’un près de l’autre.
2.2. Plus à propos du SIG
GIS is a relatively new field — it started in the 1970’s. It used to be that computerised GIS was only available to companies and universities that had expensive computer equipment. These days, anyone with a personal computer or laptop can use GIS software. Over time GIS Applications have also become easier to use — it used to require a lot of training to use a GIS Application, but now it is much easier to get started in GIS even for amateurs and casual users. As we described above, GIS is more than just software, it refers to all aspects of managing and using digital geographical data. In the tutorials that follow we will be focusing on GIS Software.
2.3. Qu’est-ce qu’un logiciel SIG / une application SIG ?
You can see an example of what a GIS Application looks like in Fig. 2.11. GIS Applications are normally programs with a graphical user interface that can be manipulated using the mouse and keyboard. The application provides menus near to the top of the window (Project, Edit, etc.) which, when clicked using the mouse, show a panel of actions. These actions provide a way for you to tell the GIS Application what you want to do. For example you may use the menus to tell the GIS Application to add a new layer to the display output, as in Fig. 2.12.
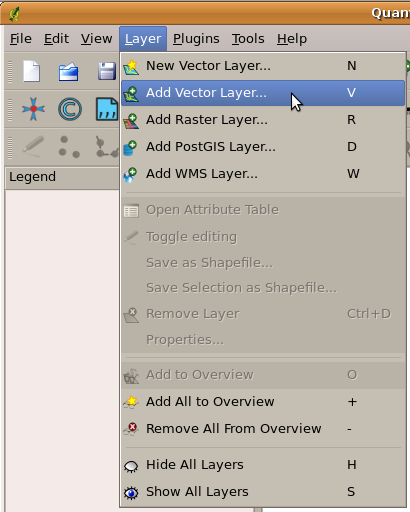
Fig. 2.12 Lorsque vous cliquez dessus, les menus déroulent une liste d’actions qui peuvent être effectuées.
As seen in Fig. 2.13, toolbars (rows of small pictures that can be clicked with the mouse) normally sit just below the menus and provide a quicker way to use frequently needed actions.
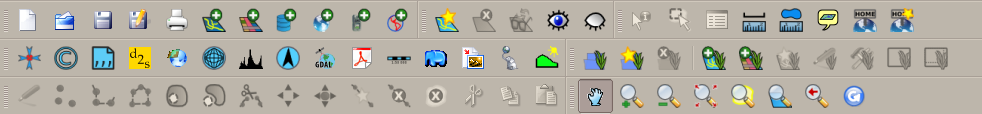
Fig. 2.13 Les barres d’outils fournissent un accès rapide aux fonctions couramment utilisées. Maintenir la souris au-dessus d’une icône vous indique généralement ce qui se passera si vous cliquez dessus.
A common function of GIS Applications is to display map layers. Map layers are stored as files on a disk or as records in a database. Normally each map layer will represent something in the real world — a roads layer for example will have data about the street network.
When you open a layer in the GIS Application it will appear in the map view. The map view shows a graphic representing your layer. When you add more than one layer to a map view, the layers are overlaid on top of each other. Look at figures Fig. 2.14, Fig. 2.15, Fig. 2.16 and Fig. 2.17 to see a map view that has several layers being added to it.

Fig. 2.14 A towns layer added to the map view
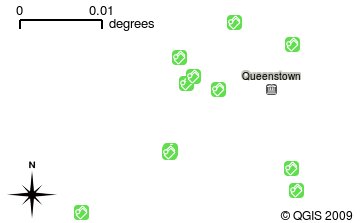
Fig. 2.15 A schools layer added to the map view

Fig. 2.16 A railways layer added to the map view
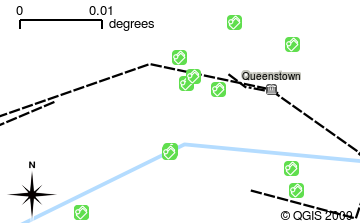
Fig. 2.17 A rivers layer added to the map view
An important function of the map view is to allow you to zoom in to magnify, zoom out to see a greater area and move around (panning) in the map. GIS software also lets you easily change symbology — the way information is displayed. Fig. 2.18 shows the map view after panning to the side and changing the symbology of the layers.
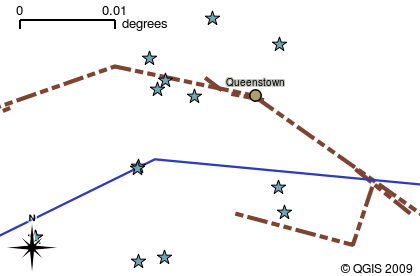
Fig. 2.18 A map view after moving around (panning) and changing the symbology
Another common feature of GIS Applications is the map legend. The map legend provides a list of layers that have been loaded in the GIS Application. Unlike a paper map legend, the map legend or “layers list” in the GIS Application provides a way to re-order, hide, show and group layers. Changing the layer order is done by clicking on a layer in the legend, holding the mouse button down and then dragging the layer to a new position. In Fig. 2.19 and Fig. 2.20, the map legend is shown as the area to the left of the GIS Application window. By changing the layer order, the way that layers are drawn can be adjusted — in this case so that rivers are drawn below the roads instead of over them.
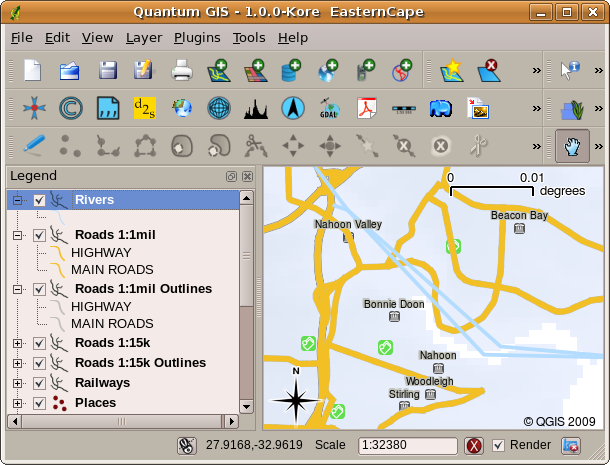
Fig. 2.19 Changer l’ordre des couches permet d’ajuster la façon dont les couches sont dessinées. Avant de changer l’ordre des couches, les rivières sont représentées au-dessus des routes.
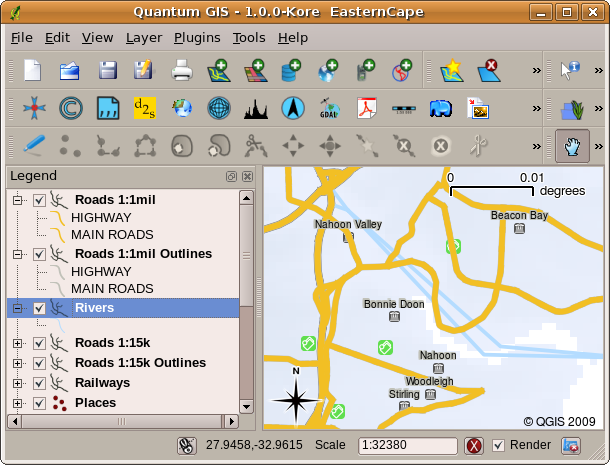
Fig. 2.20 Changer l’ordre des couches permet d’ajuster la façon dont les couches sont dessinées. Après avoir changé l’ordre des couches, les rivières sont représentées sous les routes.
2.4. Enregistrer un logiciel de SIG sur son ordinateur
Il existe de nombreuses Applications SIG. Certaines ont de nombreuses fonctionnalités sophistiquées et coûtent des centaines ou milliers d’euros pour chaque copie. D’autres par contre peuvent être obtenues gratuitement. Décider quelle Application SIG utiliser est une question de moyens financiers disponibles et de préférences personnelles. Pour ces tutoriels, nous allons utiliser l’Application QGIS. QGIS est offert gratuitement et vous pouvez le copier et partager avec vos amis autant que vous le souhaitez. Si vous avez reçu ce tutoriel sous forme imprimée, vous devriez avoir reçu une copie de QGIS avec elle. Si ce n’est pas le cas, vous pouvez toujours visiter https://www.qgis.org/ pour télécharger votre exemplaire gratuit si vous avez accès à internet.
2.5. Données SIG
Maintenant que nous savons ce qu’est un SIG et ce qu’une Application SIG peut faire, abordons la question des Données SIG. Donnée est un autre terme pour désigner information. L’information que nous utilisons dans un SIG contient normalement un aspect géographique. Reprenons l’exemple ci-dessus, concernant l’agent de santé. Elle a créé une table qui enregistre les maladies, sous cette forme:
Longitude |
Latitude |
Maladie |
Date |
|---|---|---|---|
26.870436 |
-31.909519 |
Oreillons |
13/12/2008 |
Les colonnes longitude et latitude contiennent la donnée géographique. Les colonnes maladie et date contiennent la donnée non-géographique.
A common feature of GIS is that they allow you to associate information (non-geographical data) with places (geographical data). In fact, the GIS Application can store many pieces of information which are associated with each place — something that paper maps are not very good at. For example, our health care worker could store the person’s age and gender on her table. When the GIS Application draws the layer, you can tell it to draw the layer based on gender, or based on disease type, and so on. So, with a GIS Application we have a way to easily change the appearance of the maps we created based on the non-geographical data associated with places.
GIS Systems work with many different types of data. Vector data are stored as
a series of X, Y coordinate pairs inside the computer’s memory. Vector data
are used to represent points, lines and areas. Fig. 2.21
shows different types of vector data being viewed in a GIS application. In the
tutorials that follow we will be exploring vector data in more detail.
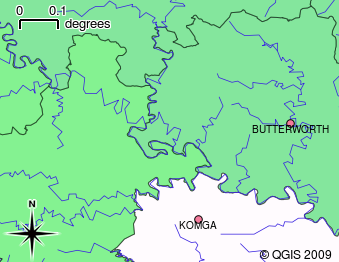
Fig. 2.21 Vector data are used to represent points (e.g., towns), lines (e.g., rivers) and polygons (e.g., municipal boundaries).
Raster data are stored as a grid of values. There are many satellites circling the earth and the photographs they take are a kind of raster data that can be viewed in a GIS. One important difference between raster and vector data is that if you zoom in too much on a raster image, it will start to appear “blocky” (see Fig. 2.22 and Fig. 2.23). In fact these blocks are the individual cells of the data grid that makes up the raster image. We will be looking at raster data in greater detail in later tutorials.
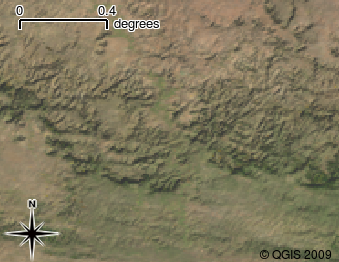
Fig. 2.22 Les données raster sont souvent des images prises par satellites. Nous pouvons voir ici les montagnes de l’Eastern Cape.
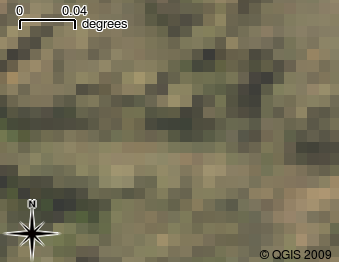
Fig. 2.23 La même donnée raster, mais cette fois-ci agrandie. On peut y voir la grille des données.
2.6. Qu’avons-nous appris?
Faisons le point sur ce que nous avons abordé dans cette partie :
Un « SIG » est un système comprenant un ordinateur, un logiciel et des données géographiques
Un « Logiciel de SIG » permet de voir des données géographiques et c’est une part importante du Système d’Information Géographique
Un logiciel de SIG contient, normalement, une « barre de menu », une « barre d’outil », une « carte » et une « légende »
Les « Vecteurs » et les « Rasters » sont des données géographiques utilisées dans les logiciels de SIG.
On peut associer des données « Non Géographiques » à des données « Géographiques »
2.7. Maintenant, essayez !
Voici quelques pistes d’actions à essayer avec vos élèves :
Géographie: Décrivez le concept de SIG à vos apprenants comme souligné dans ce tutoriel. Demandez-leur d’essayer de trouver 3 raisons pour lesquelles il pourrait être utile d’utiliser un SIG au lieu de cartes papier. En voici quelques-unes :
Les applications SIG vous permettent de créer différents types de cartes à partir des mêmes données.
Le SIG est un important outil de visualisation qui peut vous montrer des choses sur vos données et comment elles sont reliées dans l’espace (par exemple, ces épidémies de maladies vues précédemment).
Les cartes papier ont besoin d’être classées et requièrent beaucoup de temps pour être exploitées. Le SIG peut contenir une très grande quantité de données cartographiques et rendre rapide et facile la recherche d’un endroit qui vous intéresse.
Géographie: Pouvez-vous, vous et vos élèves, imaginer comment les données raster de satellites pourraient être utiles ? Voici quelques idées que nous avons eues :
Lors de catastrophes naturelles, les données raster peuvent être utiles pour montrer où sont les zones touchées. Par exemple, une image satellite récente prise durant une inondation peut aider à montrer où les personnes peuvent avoir besoin de secours.
Sometimes people do bad things to the environment, like dumping dangerous chemicals that kill plants and animals. Using raster data from satellites can help us to monitor for these types of problems.
Les urbanistes peuvent utiliser les données raster des satellites pour savoir où sont les quartiers informels et aider dans la planification des infrastructures.
2.8. Pour aller un peu plus loin…
Si vous ne disposez pas d’un ordinateur, la plupart des manipulations détaillées dans ce tutoriel peuvent être réalisées avec un simple « transparent » et un rétroprojecteur puisque le principe des calques est le même. Cependant, l’utilisation d’un ordinateur est plus approprié pour comprendre le fonctionnement d’un SIG.
2.9. Pour aller plus loin
Livre: Desktop GIS: Mapping the Planet with Open Source Tools. Auteur: Gary Sherman. ISBN: 9781934356067
Le Guide d’Utilisateur de QGIS contient également plus d’informations détaillées sur l’utilisation de QGIS.
2.10. La suite ?
Dans les sections suivantes, nous allons entrer dans les détails, vous montrant comment utiliser une application SIG. Tous les tutoriels seront faits à l’aide de QGIS. Prochaine étape, penchons-nous sur les vecteurs !