Ważne
Tłumaczenie jest wysiłkiem społeczności QGISa przyłącz się. Ta strona jest obecnie przetłumaczona w 51.47%.
24.1.14. Wydruki
24.1.14.1. Bar plot
Creates a bar plot from a category and a layer field.
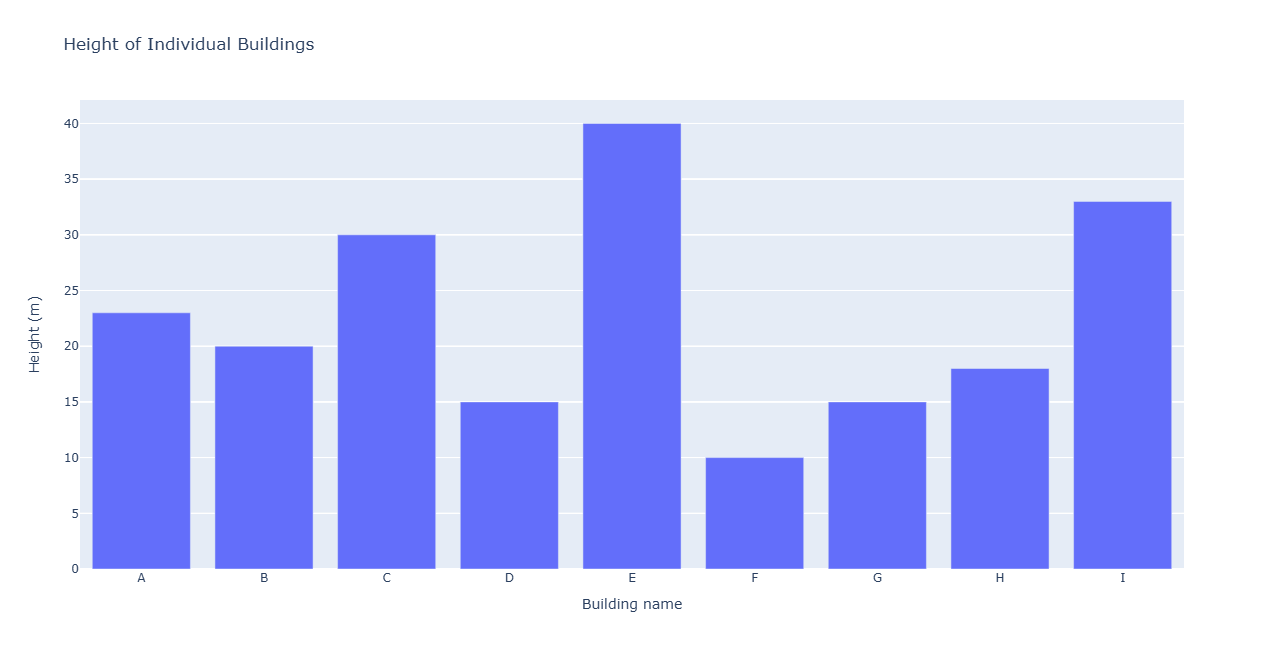
Rys. 24.32 Bar plot example
Parametry
Etykieta |
Nazwa |
Typ |
Opis |
|---|---|---|---|
Warstwa wejściowa |
|
[vector: geometry] |
Input vector layer |
Category field name |
|
[tablefield: any] |
Categorical field to use for grouping the bars (X axis) |
Value field |
|
[tablefield: numeric] |
Value to use for the plot (Y axis). |
Title Opcjonalne
|
|
[ciąg tekstowy] Default: „” |
Title of the plot |
X-axis Title Opcjonalne
|
|
[ciąg tekstowy] Default: „” |
If empty, the name of the category field is used. With a single space, the axis title is hidden. |
Y-axis Title Opcjonalne
|
|
[ciąg tekstowy] Default: „” |
If empty, the name of the value field is used. With a single space, the axis title is hidden. |
Bar plot |
|
[html] Domyślnie: |
Specify the HTML file for the plot. One of:
|
Wyniki
Etykieta |
Nazwa |
Typ |
Opis |
|---|---|---|---|
Bar plot |
|
[html] |
HTML file with the plot. Available in the . |
Kod pythona
ID algorytmu: qgis:barplot
import processing
processing.run("algorithm_id", {parameter_dictionary})
The algorithm id is displayed when you hover over the algorithm in the Processing Toolbox. The parameter dictionary provides the parameter NAMEs and values. See Using processing algorithms from the console for details on how to run processing algorithms from the Python console.
24.1.14.2. Box plot
Creates a box plot from a category field and a numerical layer field.
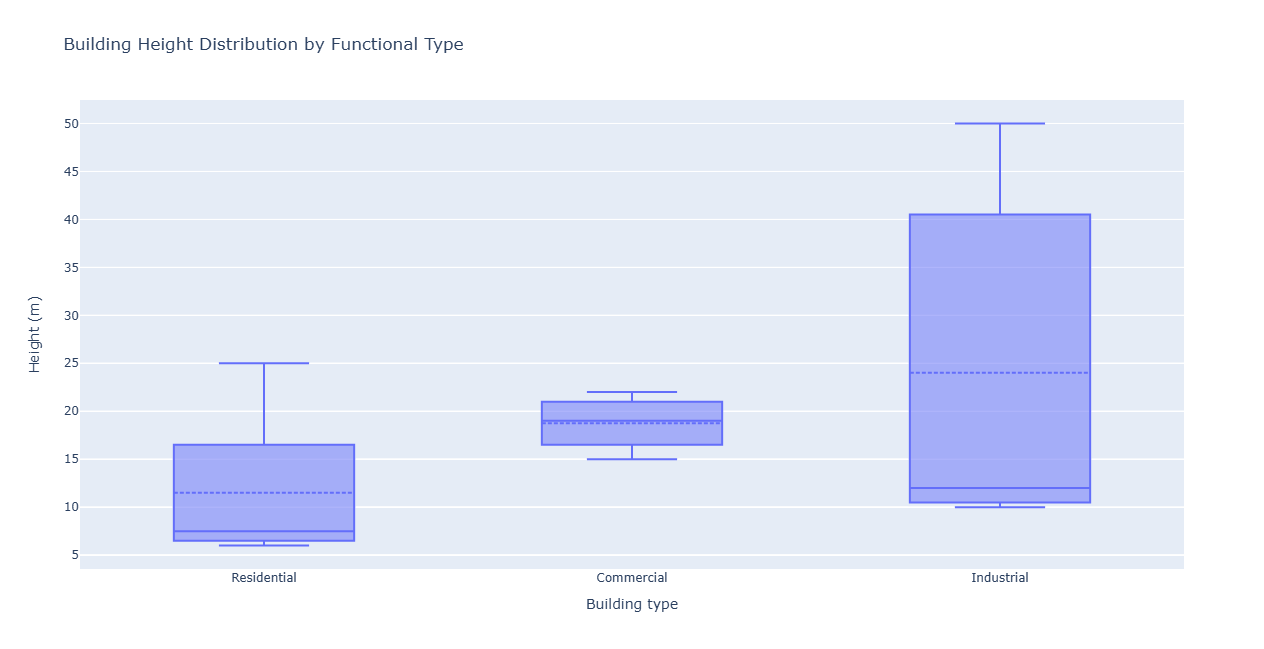
Rys. 24.33 Example of box plot
Parametry
Etykieta |
Nazwa |
Typ |
Opis |
|---|---|---|---|
Warstwa wejściowa |
|
[vector: geometry] |
Input vector layer |
Category name field |
|
[tablefield: any] |
Categorical field to use for grouping the boxes (X axis) |
Value field |
|
[tablefield: numeric] |
Value to use for the plot (Y axis). |
Additional statistic lines |
|
[wyliczenie] Domyślnie: 0 |
Additional statistics information to add to the plot. One of:
|
Title Opcjonalne
|
|
[ciąg tekstowy] Default: „” |
Title of the plot |
X-axis Title Opcjonalne
|
|
[ciąg tekstowy] Default: „” |
If empty, the name of the category field is used. With a single space, the axis title is not shown. |
Y-axis Title Opcjonalne
|
|
[ciąg tekstowy] Default: „” |
If empty, the name of the value field is used. With a single space, the axis title is not shown. |
Box plot |
|
[html] Domyślnie: |
Specify the HTML file for the plot. One of:
|
Wyniki
Etykieta |
Nazwa |
Typ |
Opis |
|---|---|---|---|
Box plot |
|
[html] |
HTML file with the plot. Available in the . |
Kod pythona
ID algorytmu: qgis:boxplot
import processing
processing.run("algorithm_id", {parameter_dictionary})
The algorithm id is displayed when you hover over the algorithm in the Processing Toolbox. The parameter dictionary provides the parameter NAMEs and values. See Using processing algorithms from the console for details on how to run processing algorithms from the Python console.
24.1.14.3. Generate elevation profile image
Added in 3.42
Creates an elevation profile image from a list of map layers and an optional terrain layer.
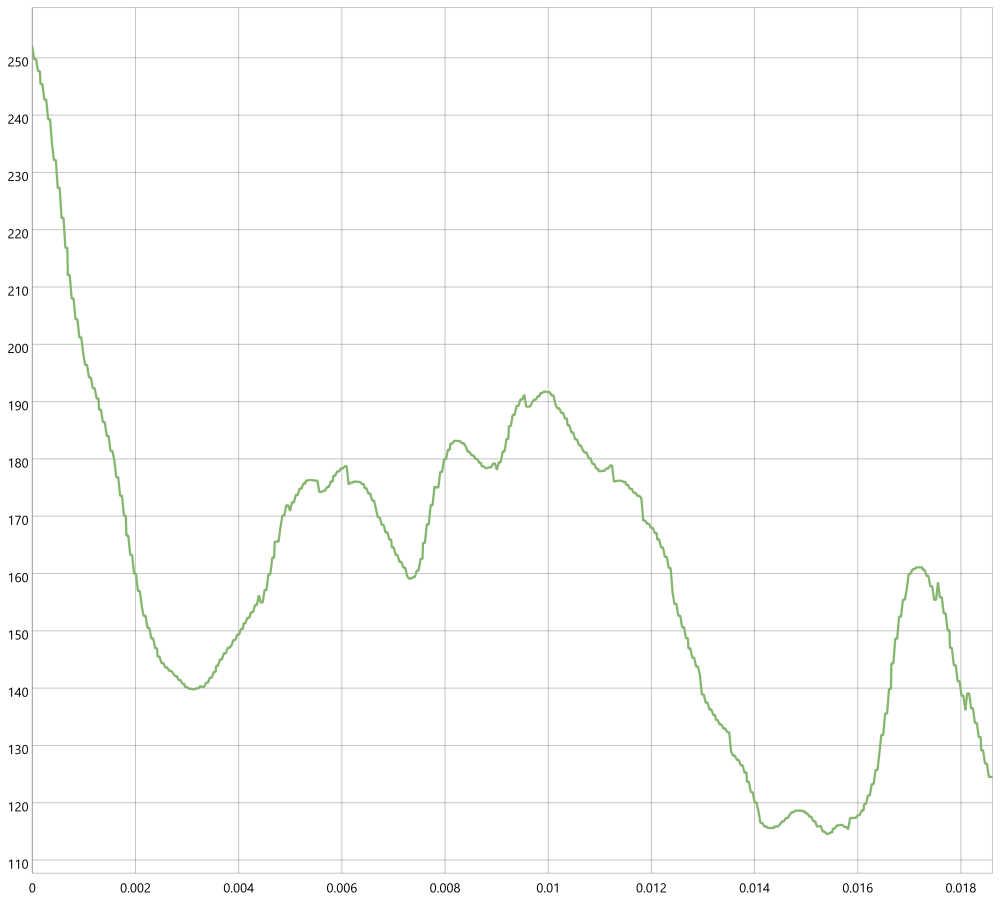
Rys. 24.34 Example of elevation profile
Parametry
Parametry podstawowe
Etykieta |
Nazwa |
Typ |
Opis |
|---|---|---|---|
Profile curve |
|
[geometry: line] |
The LineString geometry (WKT or GeoJSON) representing the profile curve along which the elevation profile will be generated |
Map layers |
|
[layer] [list] |
The list of map layers to include in the elevation profile |
Chart width (in pixels) |
|
[numeric: integer] Default: 400 Minimum value: 0 |
The width of the output chart in pixels. |
Chart height (in pixels) |
|
[numeric: integer] Default: 300 Minimum value: 0 |
The height of the output chart in pixels. |
Terrain layer Opcjonalne |
|
[raster] |
A terrain layer (e.g., DEM) to use for elevation data. If not provided, elevation data will be derived from the map layers. |
Parametry zaawansowane
Etykieta |
Nazwa |
Typ |
Opis |
|---|---|---|---|
Chart minimum distance (X axis) Opcjonalne |
|
[numeric: double] |
The minimum distance (X axis) to display on the chart. If not specified, the chart will auto-scale. |
Chart maximum distance (X axis) Opcjonalne |
|
[numeric: double] |
The maximum distance (X axis) to display on the chart. If not specified, the chart will auto-scale. |
Chart minimum elevation (Y axis) Opcjonalne |
|
[numeric: double] |
The minimum elevation (Y axis) to display on the chart. If not specified, the chart will auto-scale. |
Chart maximum elevation (Y axis) Opcjonalne |
|
[numeric: double] |
The maximum elevation (Y axis) to display on the chart. If not specified, the chart will auto-scale. |
Chart text color Opcjonalne |
|
[color] |
The color of the text in the chart (e.g., axis labels, titles). |
Chart background color Opcjonalne |
|
[color] |
The background color of the chart. |
Chart border color Opcjonalne |
|
[color] |
The color of the chart border. |
Profile tolerance |
|
[numeric: double] Domyślnie: 5.0 Minimum value: 0 |
Defines how far a feature (vector point, line, polygon, or point cloud) can be from the profile line to be included in the results. It uses map units and does not affect other layer types. |
Chart DPI |
|
[numeric: integer] Domyślnie: 96 Minimum value: 0 |
The resolution of the output image in dots per inch (DPI). |
Output image |
|
[plik] Domyślnie: |
Specify the image file for the plot. One of:
|
Wyniki
Etykieta |
Nazwa |
Typ |
Opis |
|---|---|---|---|
Output image |
|
[plik] |
The generated elevation profile image in the specified format. |
Kod pythona
Algorithm ID: native:generateelevationprofileimage
import processing
processing.run("algorithm_id", {parameter_dictionary})
The algorithm id is displayed when you hover over the algorithm in the Processing Toolbox. The parameter dictionary provides the parameter NAMEs and values. See Using processing algorithms from the console for details on how to run processing algorithms from the Python console.
24.1.14.4. Mean and standard deviation plot
Creates a box plot with mean and standard deviation values.
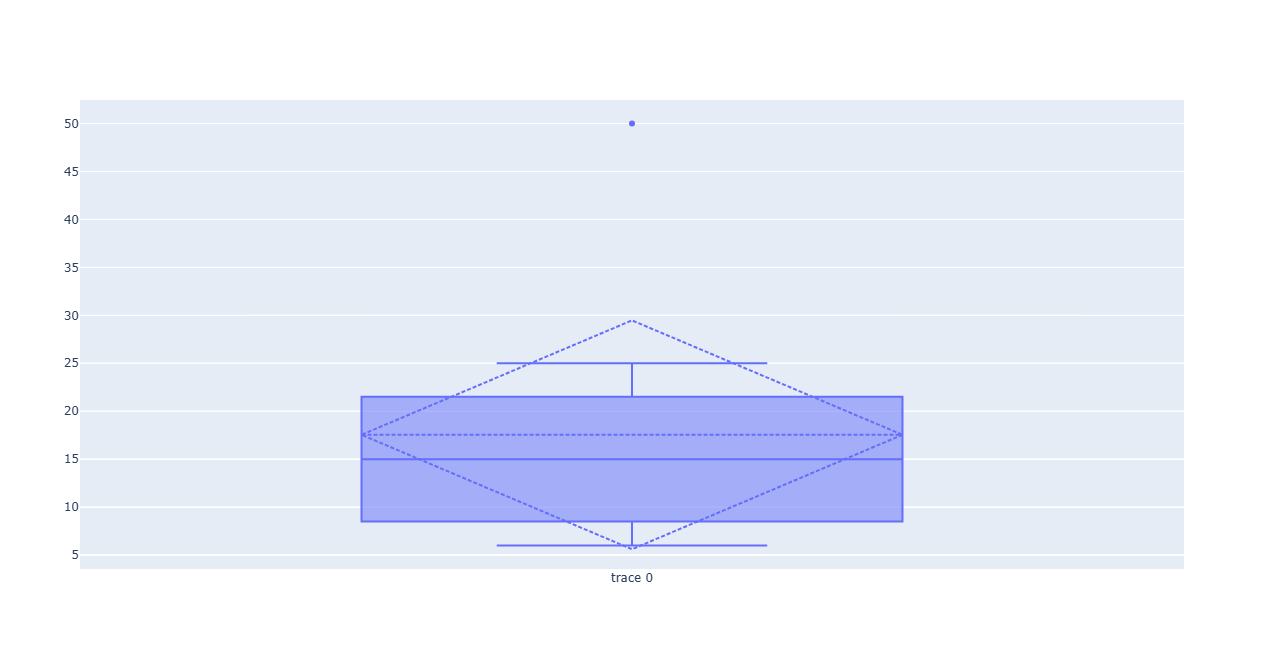
Rys. 24.35 Example of mean and standard deviation plot
Parametry
Etykieta |
Nazwa |
Typ |
Opis |
|---|---|---|---|
Input table |
|
[vector: geometry] |
Input vector layer |
Category name field |
|
[tablefield: any] |
Categorical field to use for grouping the boxes (X axis) |
Value field |
|
[tablefield: numeric] |
Value to use for the plot (Y axis). |
Plot |
|
[html] Domyślnie: |
Specify the HTML file for the plot. One of:
|
Wyniki
Etykieta |
Nazwa |
Typ |
Opis |
|---|---|---|---|
Plot |
|
[html] |
HTML file with the plot. Available in the . |
Kod pythona
ID algorytmu: qgis:meanandstandarddeviationplot
import processing
processing.run("algorithm_id", {parameter_dictionary})
The algorithm id is displayed when you hover over the algorithm in the Processing Toolbox. The parameter dictionary provides the parameter NAMEs and values. See Using processing algorithms from the console for details on how to run processing algorithms from the Python console.
24.1.14.5. Polar plot
Generates a polar plot based on the value of an input vector layer.
Two fields must be entered as parameters: one that defines the category each feature (to group features) and another one with the variable to plot (this has to be a numeric one).
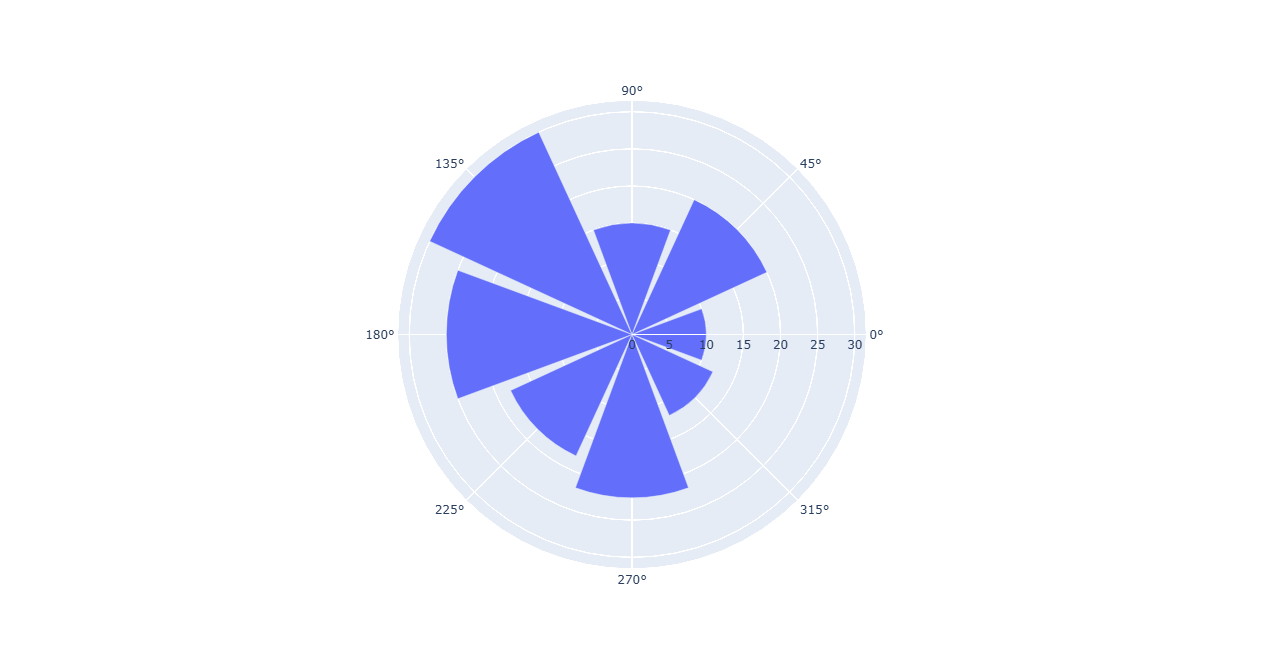
Rys. 24.36 Example of polar plot
Parametry
Etykieta |
Nazwa |
Typ |
Opis |
|---|---|---|---|
Warstwa wejściowa |
|
[vector: geometry] |
Input vector layer |
Category name field |
|
[tablefield: any] |
Categorical field to use for grouping the features (X axis) |
Value field |
|
[tablefield: numeric] |
Value to use for the plot (Y axis). |
Polar plot |
|
[html] Domyślnie: |
Specify the HTML file for the plot. One of:
|
Wyniki
Etykieta |
Nazwa |
Typ |
Opis |
|---|---|---|---|
Polar plot |
|
[html] |
HTML file with the plot. Available in the . |
Kod pythona
ID algorytmu: qgis:polarplot
import processing
processing.run("algorithm_id", {parameter_dictionary})
The algorithm id is displayed when you hover over the algorithm in the Processing Toolbox. The parameter dictionary provides the parameter NAMEs and values. See Using processing algorithms from the console for details on how to run processing algorithms from the Python console.
24.1.14.6. Raster layer histogram
Generates a histogram with the values of a raster layer.
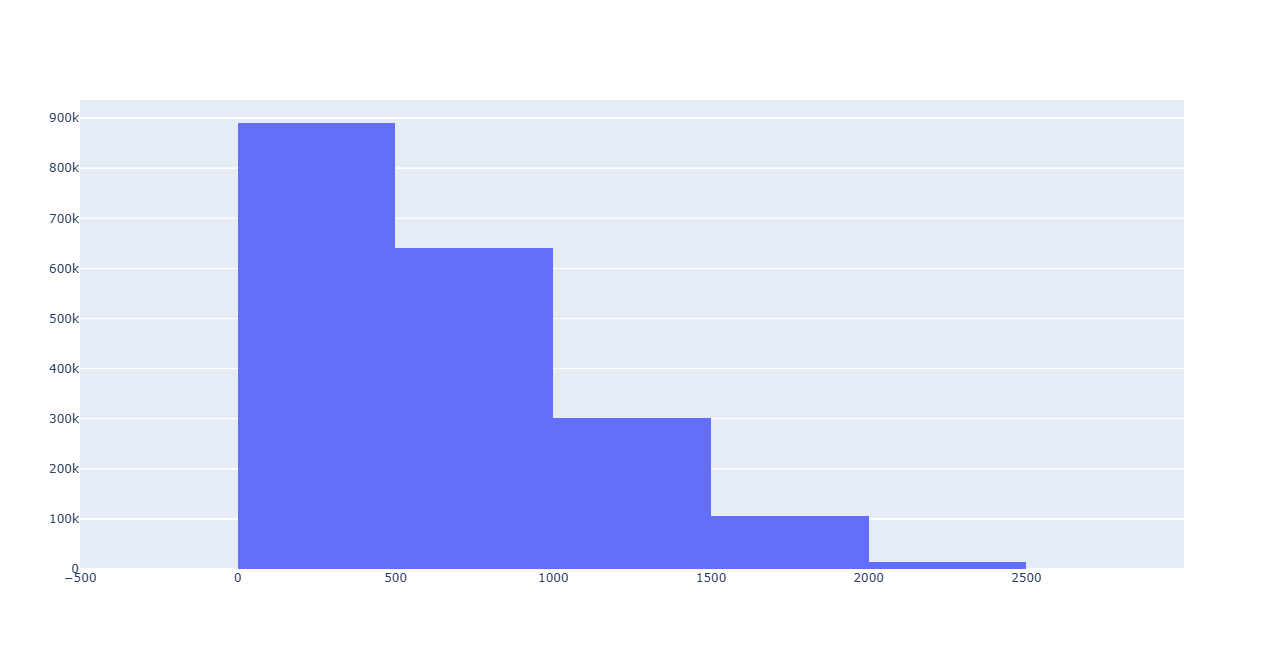
Rys. 24.37 Raster layer histogram example
Parametry
Etykieta |
Nazwa |
Typ |
Opis |
|---|---|---|---|
Warstwa wejściowa |
|
[raster] |
Input raster layer |
Band number |
|
[raster band] |
Raster band to use for the histogram |
number of bins |
|
[numeric: integer] Domyślnie: 10 |
The number of bins to use in the histogram (X axis). Minimum 2. |
Histogram |
|
[html] Domyślnie: |
Specify the HTML file for the plot. One of:
|
Wyniki
Etykieta |
Nazwa |
Typ |
Opis |
|---|---|---|---|
Histogram |
|
[html] |
HTML file with the plot. Available in the . |
Kod pythona
ID algorytmu: qgis:rasterlayerhistogram
import processing
processing.run("algorithm_id", {parameter_dictionary})
The algorithm id is displayed when you hover over the algorithm in the Processing Toolbox. The parameter dictionary provides the parameter NAMEs and values. See Using processing algorithms from the console for details on how to run processing algorithms from the Python console.
24.1.14.7. Vector layer histogram
Generates a histogram with the values of the attribute of a vector layer.
The attribute to use for computing the histogram must be numeric.
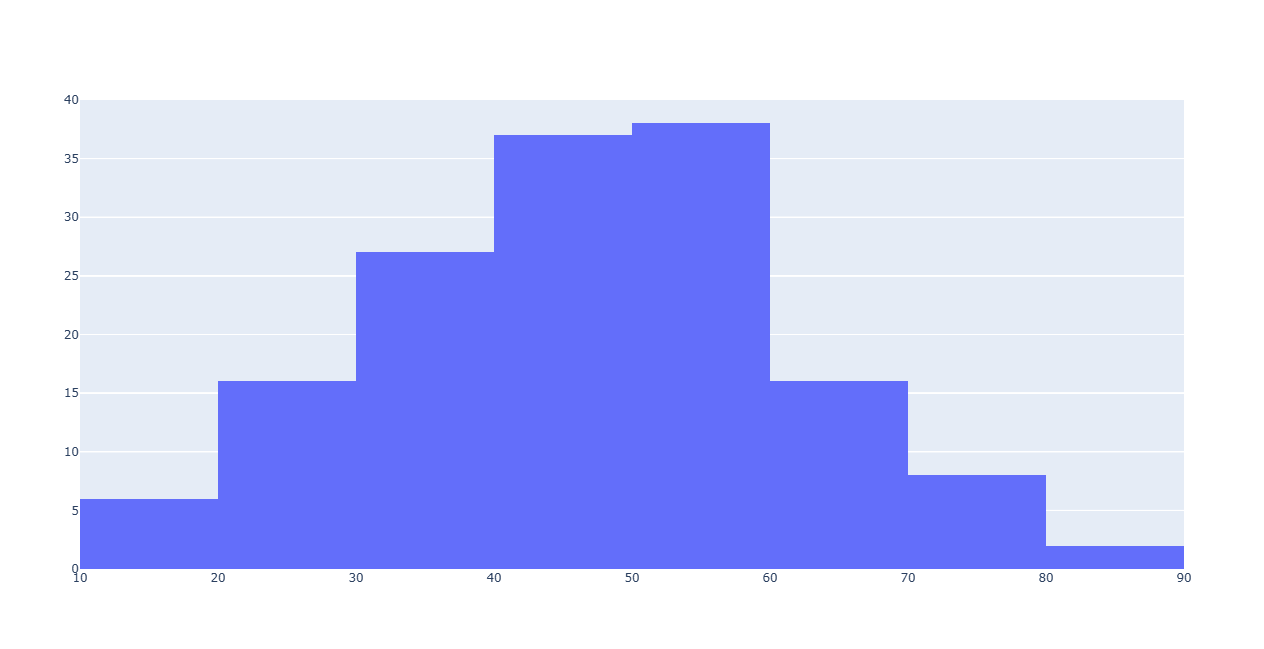
Rys. 24.38 Example of vector layer histogram
Parametry
Etykieta |
Nazwa |
Typ |
Opis |
|---|---|---|---|
Warstwa wejściowa |
|
[vector: any] |
Input vector layer |
Atrybut |
|
[tablefield: numeric] |
Value to use for the plot (Y axis). |
number of bins |
|
[numeric: integer] Domyślnie: 10 |
The number of bins to use in the histogram (X axis). Minimum 2. |
Histogram |
|
[html] Domyślnie: |
Specify the HTML file for the plot. One of:
|
Wyniki
Etykieta |
Nazwa |
Typ |
Opis |
|---|---|---|---|
Histogram |
|
[html] |
HTML file with the plot. Available in the . |
Kod pythona
ID algorytmu: qgis:vectorlayerhistogram
import processing
processing.run("algorithm_id", {parameter_dictionary})
The algorithm id is displayed when you hover over the algorithm in the Processing Toolbox. The parameter dictionary provides the parameter NAMEs and values. See Using processing algorithms from the console for details on how to run processing algorithms from the Python console.
24.1.14.8. Vector layer scatterplot
Creates a simple X - Y scatter plot for a vector layer.
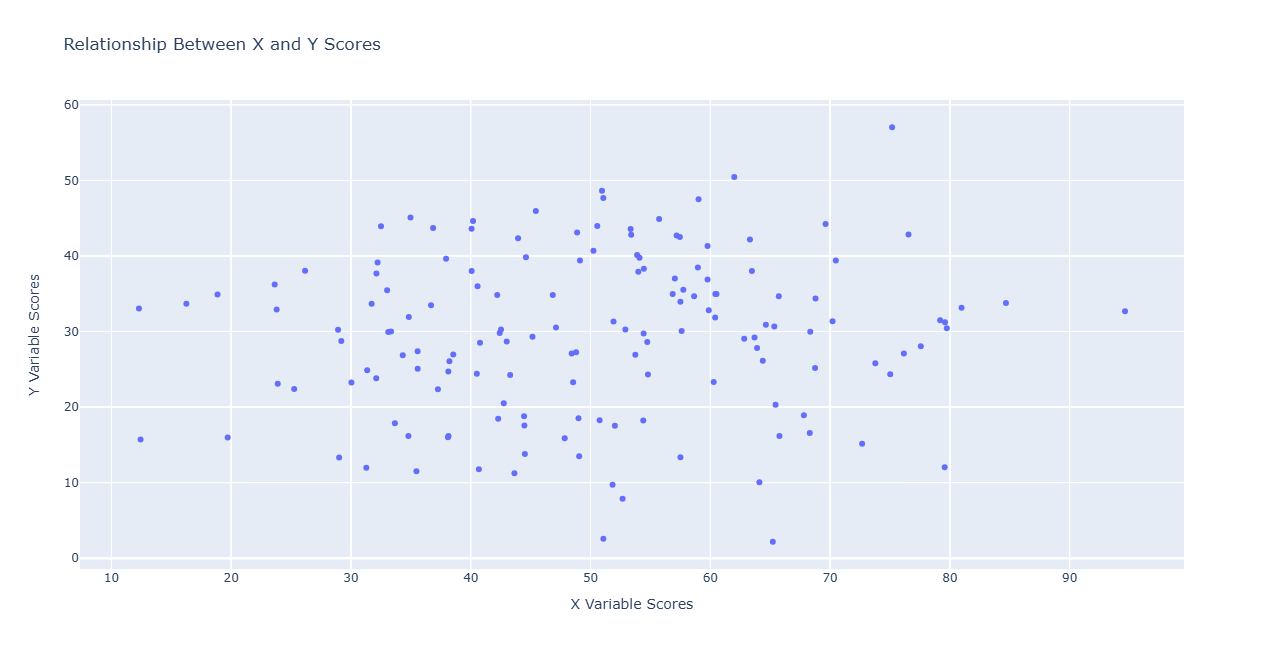
Rys. 24.39 Example of vector layer scatterplot
Parametry
Etykieta |
Nazwa |
Typ |
Opis |
|---|---|---|---|
Warstwa wejściowa |
|
[vector: geometry] |
Input vector layer |
X attribute |
|
[tablefield: numeric] |
Field to use for the X axis |
Y attribute |
|
[tablefield: numeric] |
Field to use for the Y axis |
Hover text Opcjonalne
|
|
[wyrażenie] Default: „” |
Text to be shown when hovering with the mouse over data points. It can be picked from a field or based on an expression. |
Title Opcjonalne
|
|
[ciąg tekstowy] Default: „” |
Title of the plot |
X-axis Title Opcjonalne
|
|
[ciąg tekstowy] Default: „” |
If empty, the field name of the x attribute is used. With a single space, the axis title is not shown. |
Y-axis Title Opcjonalne
|
|
[ciąg tekstowy] Default: „” |
If empty, the field name of the y attribute is used. With a single space, the axis title is not shown. |
Use logarithmic scale for x-axis
|
|
[wartość logiczna] Domyślnie: False |
When enabled, uses logarithmic scale for the x-axis |
Use logarithmic scale for y-axis
|
|
[wartość logiczna] Domyślnie: False |
When enabled, uses logarithmic scale for the y-axis |
Scatterplot |
|
[html] Domyślnie: |
Specify the HTML file for the plot. One of:
|
Wyniki
Etykieta |
Nazwa |
Typ |
Opis |
|---|---|---|---|
Scatterplot |
|
[html] |
HTML file with the plot. Available in the . |
Kod pythona
ID algorytmu: qgis:vectorlayerscatterplot
import processing
processing.run("algorithm_id", {parameter_dictionary})
The algorithm id is displayed when you hover over the algorithm in the Processing Toolbox. The parameter dictionary provides the parameter NAMEs and values. See Using processing algorithms from the console for details on how to run processing algorithms from the Python console.
24.1.14.9. Vector layer scatterplot 3D
Creates a 3D scatter plot for a vector layer.
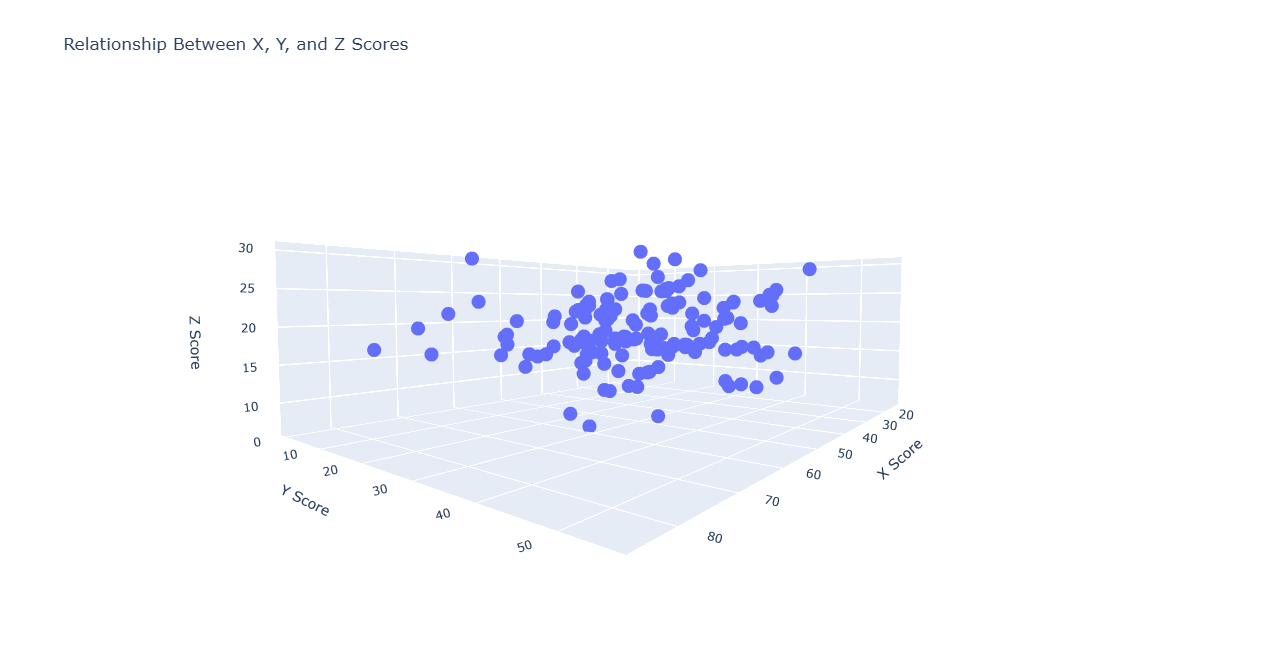
Rys. 24.40 Example of 3D scatter plot
Parametry
Etykieta |
Nazwa |
Typ |
Opis |
|---|---|---|---|
Warstwa wejściowa |
|
[vector: geometry] |
Input vector layer |
X attribute |
|
[tablefield: numeric] |
Field to use for the X axis |
Y attribute |
|
[tablefield: numeric] |
Field to use for the Y axis |
Z attribute |
|
[tablefield: numeric] |
Field to use for the Z axis |
Title Opcjonalne
|
|
[ciąg tekstowy] Default: „” |
Title of the plot |
X-axis Title Opcjonalne
|
|
[ciąg tekstowy] Default: „” |
If empty, the field name of the X attribute is used. |
Y-axis Title Opcjonalne
|
|
[ciąg tekstowy] Default: „” |
If empty, the field name of the Y attribute is used. |
Z-axis Title Opcjonalne
|
|
[ciąg tekstowy] Default: „” |
If empty, the field name of the Z attribute is used. |
Scatterplot 3D |
|
[html] Domyślnie: |
Specify the HTML file for the plot. One of:
|
Wyniki
Etykieta |
Nazwa |
Typ |
Opis |
|---|---|---|---|
Scatterplot 3D |
|
[html] |
HTML file with the plot. Available in the . |
Kod pythona
ID algorytmu: qgis:scatter3dplot
import processing
processing.run("algorithm_id", {parameter_dictionary})
The algorithm id is displayed when you hover over the algorithm in the Processing Toolbox. The parameter dictionary provides the parameter NAMEs and values. See Using processing algorithms from the console for details on how to run processing algorithms from the Python console.