Wichtig
Übersetzen ist eine Gemeinschaftsleistung Sie können mitmachen. Diese Seite ist aktuell zu 57.58% übersetzt.
21. Working with 3D Tiles
21.1. What are 3D Tiles?
3D tiles are specification for streaming and rendering large-scale 3D geospatial datasets. They use a hierarchical structure to efficiently manage and display 3D content, optimising performance by dynamically loading appropriate levels of detail. This technology is widely used in urban planning, architecture, simulation, gaming, and virtual reality, providing a standardised and interoperable solution for visualising complex geographical data. Read Verwendung von 3D-Kacheldiensten for more details.
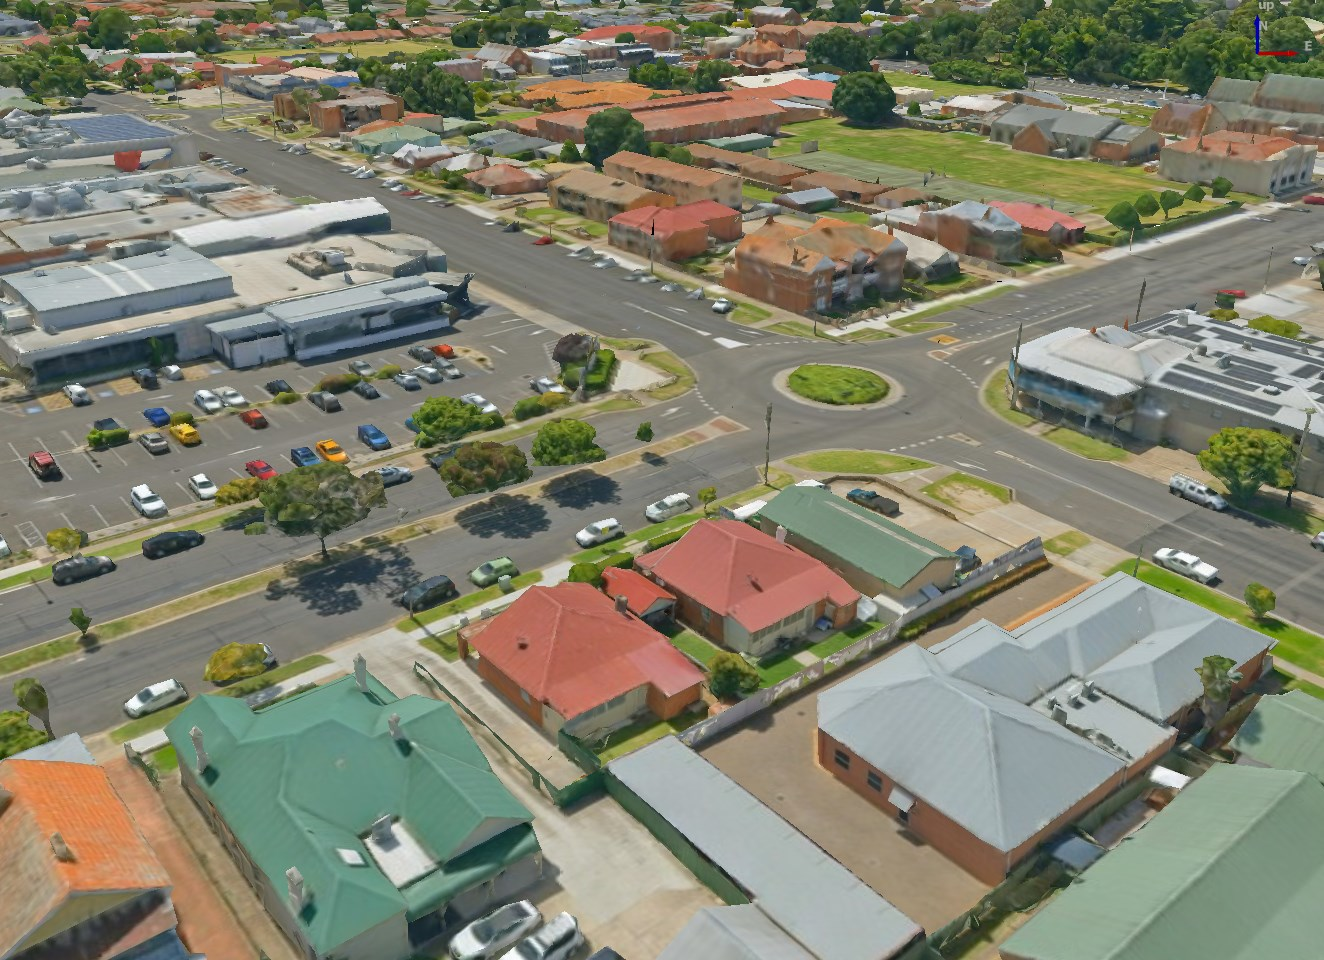
Abb. 21.1 Example of 3D tiles
21.2. Data Sources
Support for 3D tiles:
Netzwerk-Quelle -
http://example.com/tileset.jsonLokale Dateien -
file:///path/to/tiles/tileset.json
21.2.1. Using data from Cesium ion
Cesium ion is a cloud-based platform for managing and streaming 3D geospatial data. It simplifies data management, visualisation and sharing. To add 3D tiles from Cesium ion, you need to first sign up to their service here: https://ion.cesium.com.
You can also use Cesium ion plugin from the QGIS repository to add the data to QGIS.
21.2.2. Using Google 3D data
To use Google Photorealistic 3D tiles in QGIS, get an API key for 3D tiles. Once you have the key, simply add Google tiles using the same connection process.
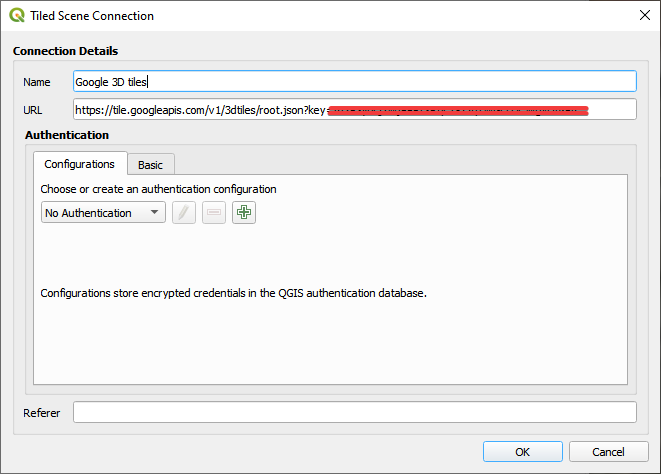
Abb. 21.2 Google 3D Tiles connection
21.3. 3D Tiles Properties
The 3D tiles Layer Properties dialog provides the following sections:
|
||
|
|
|


[1] Auch im Bedienfeld Layergestalltung verfügbar
21.3.1. Eigenschaften Information
Der Tab Information kann nicht editiert werden und ist ein guter Platz, um schnell zusammengefasste Informationen und Metadaten des aktuellen Layers nachzuschlagen. Hier erhalten Sie folgende Informationen:
based on the provider of the layer: name, URL, source type and path, number of zoom levels
das Koordinatenbezugssystem: Name, Einheiten, Methode, Genauigkeit, Referenz (d.h., ob es statisch oder dynamisch ist)
picked from the filled metadata: access, extents, links, contacts, history…
21.3.2. Eigenschaften Quelle
The  Source tab displays basic information about
the selected 3D tile, including:
Source tab displays basic information about
the selected 3D tile, including:
der Layername, der im Layer-Bedienfeld angezeigt wird;
das Koordinatenreferenzsystem: Zeigt das Koordinatenreferenzsystem (KBS) des Layers an. Sie können das KBS des Layers ändern, indem Sie ein kürzlich verwendetes KBS aus der Dropdown-Liste auswählen oder auf die Schaltfläche
 KBS wählen klicken (siehe Auswahl des Koordinatenbezugssystems). Verwenden Sie dieses Verfahren nur, wenn das KBS falsch oder nicht angegeben ist.
21.3.3. Eigenschaften Symbolisierung
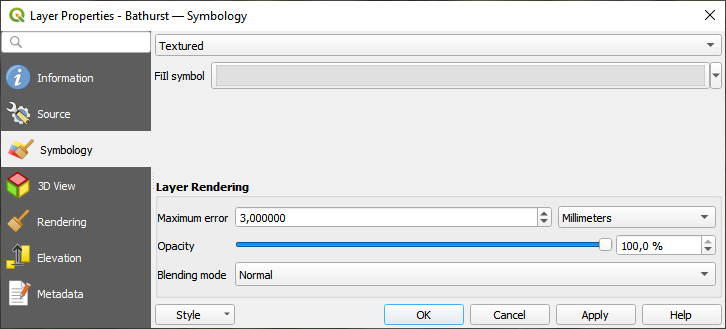
Abb. 21.3 3D Tile Layer Symbology
By default, the layer is styled using texture, but you can change it
to see the wireframe mesh behind the scene by choosing Wireframe
in the drop-down menu. You can also, change the mesh fill and line symbols
similar to the vector polygons.
Checking  Use texture colors will render each mesh element
with the average value of the full texture.
This is a good option to try when dealing with a large dataset and
want to get a quick overview of the data.
Use texture colors will render each mesh element
with the average value of the full texture.
This is a good option to try when dealing with a large dataset and
want to get a quick overview of the data.
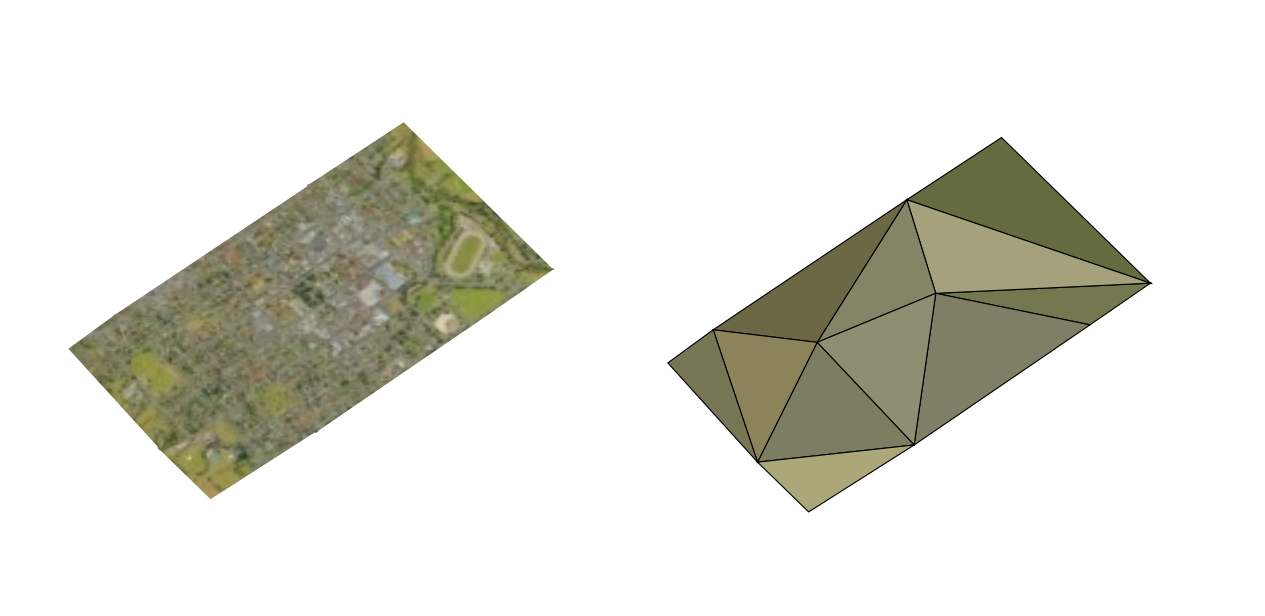
Abb. 21.4 3D Tiles - textured and wireframe
To view the data you can open  New 3D map view.
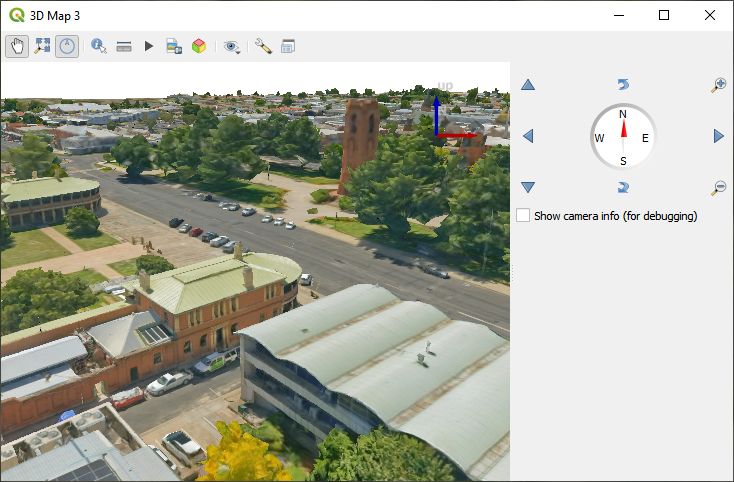
Abb. 21.5 3D-Ansicht
Auf der Registerkarte Symbolisierung können Sie auch einige Optionen einstellen, die sich immer auf alle Objekte des Layers auswirken:
Maximum error: This parameter determines the level of detail displayed in the 3D model. Similar to point clouds, 3D tiles often contain more information than necessary for visual representation. By adjusting this setting, you control the balance between display density and rendering speed. A larger value (e.g., 5 mm) may introduce noticeable gaps between elements, while a smaller value (e.g., 0.1 mm) could lead to the rendering of an excessive number of details, potentially slowing down the rendering process. Different units can be selected to tailor the setting to your specific needs.
Opacity: Adjust the visibility of the underlying layer on the map canvas using this tool. Use slider to tailor the visibility of your scene layer according to your preferences. Alternatively, specify the exact percentage of visibility through the menu next to the slider.
Mischmodus: Mit diesen Werkzeugen können Sie spezielle Rendering-Effekte erzielen, die Sie bisher nur von Graphikprogrammen her kennen. Die Pixel von sich überlagernden Layern werden durch die verwendete Einstellungen gemischt, wie in Mischmodi beschrieben.
21.3.4. 3D-Ansicht Eigenschaften
Maximum screen space error determines the threshold for swapping terrain tiles with more detailed ones (and vice versa) - i.e. how soon the 3D view will use higher quality tiles. Lower numbers mean more details in the scene at the expenses of increased rendering complexity.
 Show bounding boxes Show 3D bounding boxes of the
terrain tiles (useful for troubleshooting terrain issues).
Show bounding boxes Show 3D bounding boxes of the
terrain tiles (useful for troubleshooting terrain issues).
21.3.5. Eigenschaften Darstellung
Unter Maßstabsabhängige Sichtbarkeit können Sie die Maßstäbe Maximum („(inklusive)“) und :guilabel:`Minimum („(exklusive)“) festlegen und damit einen Bereich von Maßstäben definieren, in dem die Objekte des Layers sichtbar sind. Außerhalb dieses Bereichs werden sie ausgeblendet. Die Schaltfläche |mapIdentification| :sup:`Auf aktuellen Kartenmaßstab setzen hilft Ihnen, den aktuellen Maßstab der Kartenansicht als Grenze für den Sichtbarkeitsbereich zu verwenden. Siehe Einstellen des Sichtbarkeitsmaßstabs für weitere Informationen.
21.3.6. Höhe
The  Elevation tab provides options to control
the layer elevation properties within a 3D map view.
Specifically, you can set:
Elevation tab provides options to control
the layer elevation properties within a 3D map view.
Specifically, you can set:
Elevation Surface: how the 3D layer vertices Z values should be interpreted as terrain elevation. You can apply a Scale factor and an Offset.
21.3.7. Eigenschaften Metadaten
Der Tab  Metadaten ermöglicht es Ihnen, Metadaten für Ihren Layer zu erstellen oder zu editieren. Siehe Metadaten für weitere Informationen.