8. Souřadnicové referenční systémy
Cíle: |
Porozumění souřadnicovým referenčním systémům |
|
Klíčová slova: |
Souřadnicový referenční systém (CRS), mapové zobrazení, improvizované zobrazení, zeměpisná šířka, zeměpisná délka, severní souřadnice, východní souřadnice |
8.1. Přehled
Map projections try to portray the surface of the earth, or a portion of the earth, on a flat piece of paper or computer screen. In layman’s term, map projections try to transform the earth from its spherical shape (3D) to a planar shape (2D).
A coordinate reference system (CRS) then defines how the two-dimensional, projected map in your GIS relates to real places on the earth. The decision of which map projection and CRS to use depends on the regional extent of the area you want to work in, on the analysis you want to do, and often on the availability of data.
8.2. Detail mapového zobrazení
Tradiční způsob zobrazení zemského tvaru je použití glóbu. Avšak, s tímto přístupem je problém. Ačkoli glóby zachovávají většinu zemského tvaru a ilustrují prostorovou konfiguraci prvků kontinentu, jsou velmi obtížně přenositelné. Navíc jsou vhodné k použití pouze ve velmi malém měřítku (např. 1:100 milionům).
Většina tematických mapových údajů, běžně používaných v aplikacích GIS je v podstatně větším měřítku. Typické datové soubory GIS jsou v měřítkách 1:250 000 nebo vyšších, v závislosti na úrovni detailů. Glóbus této velikosti by byl obtížný a nákladný na výrobu a ještě obtížněji přenositelný. V důsledku toho, kartografové vyvinuli řadu technik zvaných mapová zobrazení, jejichž cílem je, s dostatečnou přesností, zobrazit sférickou Zemi ve 2D.
Při pohledu zblízka se Země zdá být relativně plochá. Avšak při pohledu z vesmíru, můžeme vidět, že je Země poměrně kulovitá. Mapy, jak uvidíme v nadcházejícím tému tvorby map, jsou znázorněním reality. Jsou navrženy tak, aby reprezentovaly nejen prvky, ale také jejich tvar a prostorové uspořádání. Každé mapové zobrazení má výhody a nevýhody. Nejlepší zobrazení pro mapu je závislé na měřítku mapy, a na účelu využití. Například zobrazení může mít nepřijatelné zkreslení, pokud je použito k mapování celého afrického kontinentu, ale může být vynikající volbou pro mapu velkého měřítka (detailní) vaší země. Tyto vlastnosti mapového zobrazení mohou také ovlivňovat některé konstrukční prvky mapy. Některá zobrazení jsou dobrá pro malé plochy, některá z nich jsou vhodná pro mapování oblastí s velkým rozsahem Východ-Západ, a některá jsou lepší pro mapování oblastí s velkým rozsahem Sever-Jih.
8.3. Tři soubory rozdělení mapových zobrazení
The process of creating map projections is best illustrated by positioning a light source inside a transparent globe on which opaque earth features are placed. Then project the feature outlines onto a two-dimensional flat piece of paper. Different ways of projecting can be produced by surrounding the globe in a cylindrical fashion, as a cone, or even as a flat surface. Each of these methods produces what is called a map projection family. Therefore, there is a family of planar projections, a family of cylindrical projections, and another called conical projections (see Obr. 8.3)
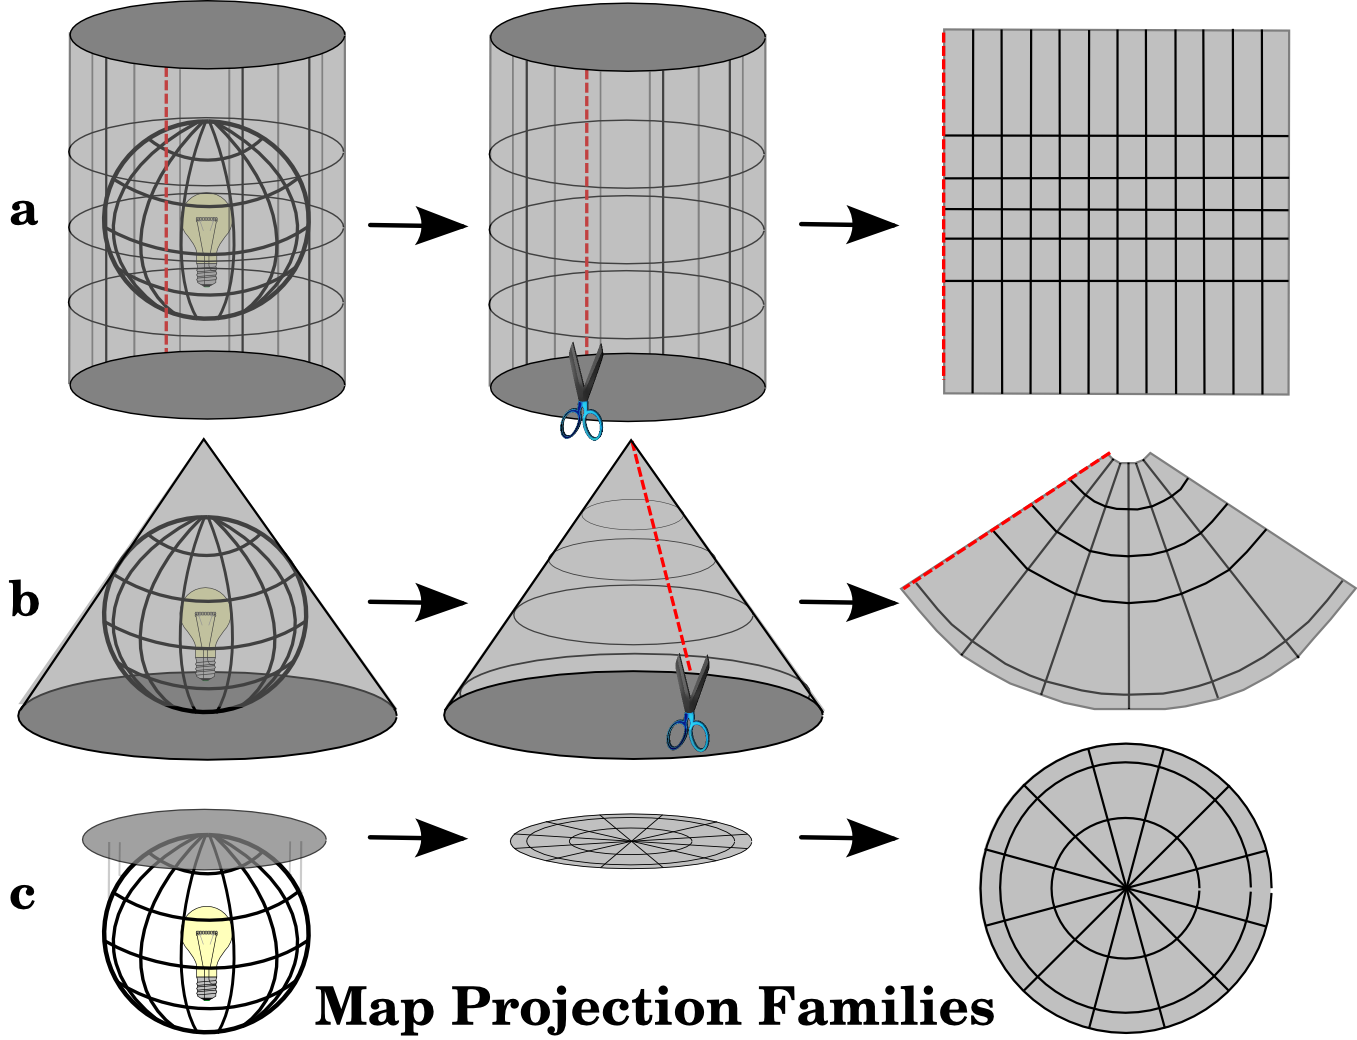
Obr. 8.3 Tři soubory mapových zobrazení. Mohou být znázorněny a) válcovými zobrazeními, b) kuželovými zobrazeními nebo c) rovinnými zobrazeními.
Dnes, se samozřejmě proces projektování sférické Země na plochý papír, provádí pomocí matematických principů geometrie a trigonometrie. Ty převytvářejí fyzické zobrazení světla přes glóbus.
8.4. Přesnost mapových zobrazení
Map projections are never absolutely accurate representations of the spherical earth. As a result of the map projection process, every map shows distortions of angular conformity, distance and area. A map projection may combine several of these characteristics, or may be a compromise that distorts all the properties of area, distance and angular conformity, within some acceptable limit. Examples of compromise projections are the Winkel Tripel projection and the Robinson projection (see Obr. 8.4), which are often used for producing and visualizing world maps.
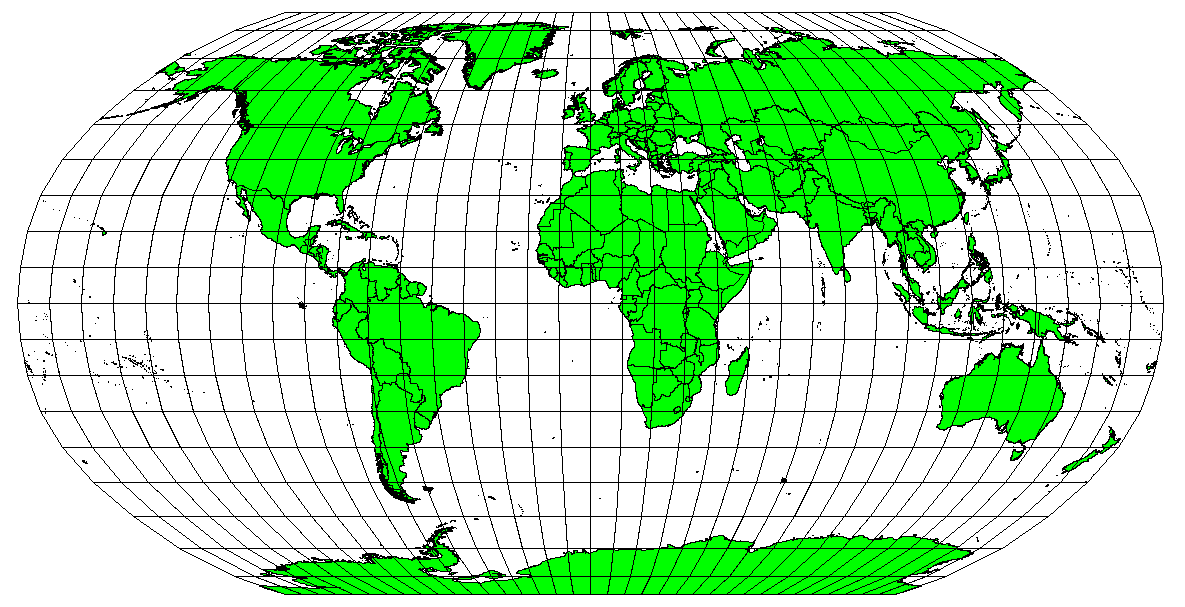
Obr. 8.4 Robinsonovo zobrazení je kombinací, kde jsou zkreslení ploch, úhlů a vzdáleností přijatelné.
Obvykle není možné zachovat všechny vlastnosti najednou v jednom mapovém zobrazení. To znamená, že když chcete provést přesné analytické operace, musíte použít mapové zobrazení, které poskytuje ty nejlepší vlastnosti pro vaše analýzy. Například, pokud je potřeba měřit vzdálenosti na mapě, měli byste se pokusit použít mapové zobrazení pro vaše data, které poskytuje vysokou přesnost pro vzdálenosti.
8.4.1. Mapová zobrazení s úhlovým zkreslením
Při práci s glóbem, hlavní světové strany (sever, východ, jih a západ) jsou vždy navzájem v úhlu 90 stupňů. Jinými slovy, východ je vždy v úhlu 90 stupňů k severu. Zachování správných úhlových vlastností může také být v mapovém zobrazení zachováno. Mapové zobrazení, které nezkresluje úhly se nazývá konformní nebo úhlojevné.
These projections are used when the preservation of angular relationships is important. They are commonly used for navigational or meteorological tasks. It is important to remember that maintaining true angles on a map is difficult for large areas and should be attempted only for small portions of the earth. The conformal type of projection results in distortions of areas, meaning that if area measurements are made on the map, they will be incorrect. The larger the area the less accurate the area measurements will be. Examples are the Mercator projection (as shown in Obr. 8.5) and the Lambert Conformal Conic projection. The U.S. Geological Survey uses a conformal projection for many of its topographic maps.
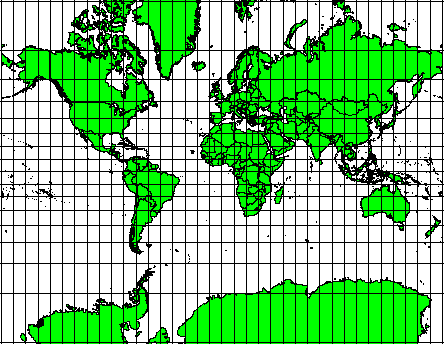
Obr. 8.5 Mercatorovo zobrazení se používá například tam, kde jsou důležité vztahy úhlů, ale vztahy ploch jsou zkresleny.
8.4.2. Mapová zobrazení se stejnými vzdálenostmi
If your goal in projecting a map is to accurately measure distances, you should select a projection that is designed to preserve distances well. Such projections, called equidistant projections, require that the scale of the map is kept constant. A map is equidistant when it correctly represents distances from the centre of the projection to any other place on the map. Equidistant projections maintain accurate distances from the centre of the projection or along given lines. These projections are used for radio and seismic mapping, and for navigation. The Plate Carree Equidistant Cylindrical (see Obr. 8.6) and the Equirectangular projection are two good examples of equidistant projections. The Azimuthal Equidistant projection is the projection used for the emblem of the United Nations (see Obr. 8.7).
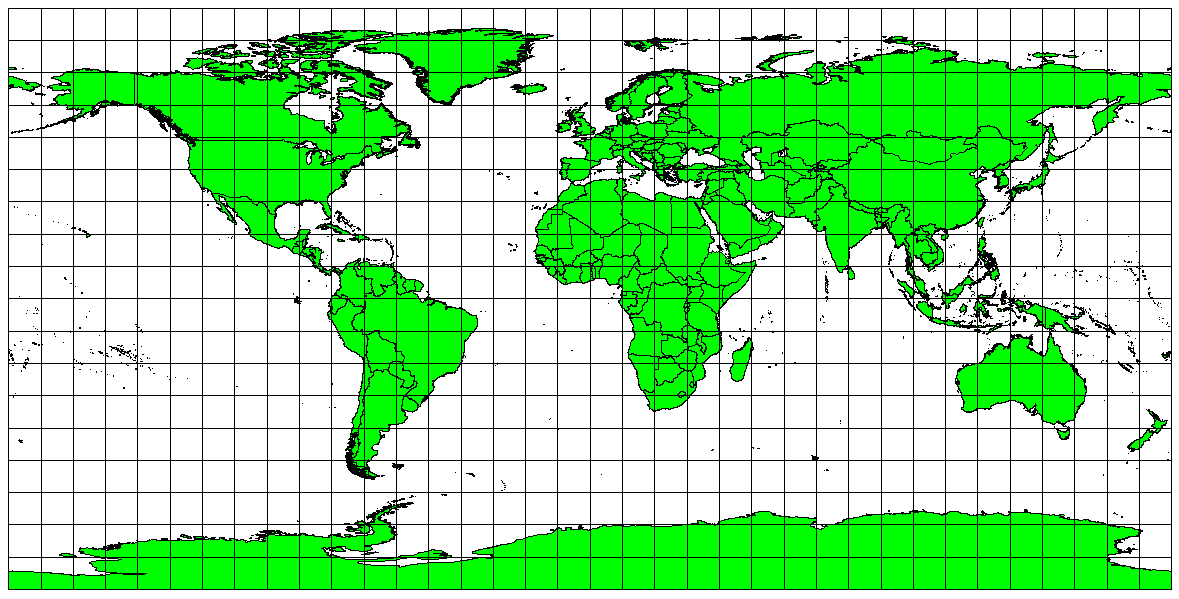
Obr. 8.6 Platte Carreeovo ekvidistantní válcová projekce je na příklad používaná, když je potřeba přesně měřit vzdálenosti.

Obr. 8.7 Logo spojených států amerických azimutální ekvidistantní projekci.
8.4.3. Projekce se stejnými plochami.
When a map portrays areas over the entire map, so that all mapped areas have the same proportional relationship to the areas on the Earth that they represent, the map is an equal area map. In practice, general reference and educational maps most often require the use of equal area projections. As the name implies, these maps are best used when calculations of area are the dominant calculations you will perform. If, for example, you are trying to analyse a particular area in your town to find out whether it is large enough for a new shopping mall, equal area projections are the best choice. On the one hand, the larger the area you are analysing, the more precise your area measures will be, if you use an equal area projection rather than another type. On the other hand, an equal area projection results in distortions of angular conformity when dealing with large areas. Small areas will be far less prone to having their angles distorted when you use an equal area projection. Alber’s equal area, Lambert’s equal area and Mollweide Equal Area Cylindrical projections (shown in Obr. 8.8) are types of equal area projections that are often encountered in GIS work.
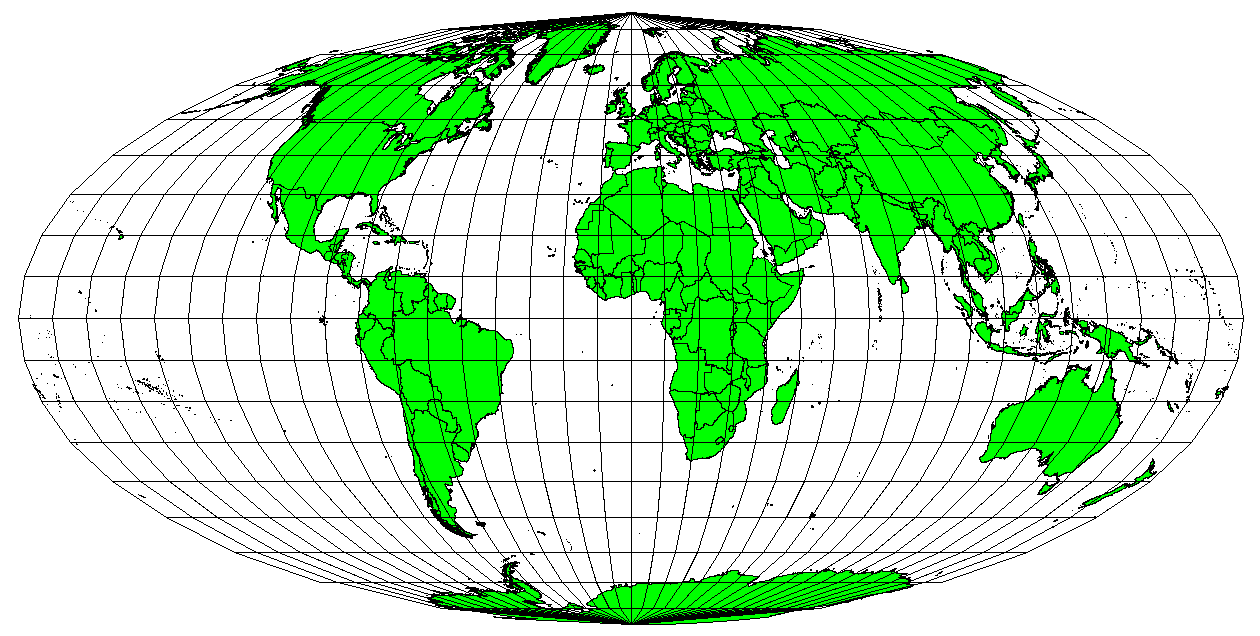
Obr. 8.8 Mollweidova projekce zachovávající plochy například zajišťuje, že všechny mapové oblasti mají stejný proporční vztah všech ploch na celé Zemi.
Pamatujte na to, že mapové projekce je velmi komplexní téma. Je zde stovka různých mapových projekcí dostupná napříč celým světem, každá se snaží zobrazit část zemského povrchu tak věrohodně, jak to jen jde na kousku papíru. Ve skutečnosti, volba použité projekce bude často na Vás. Většina zemí má obvykle používané projekce a když jsou data měněny, lidé následují „národní zvyk“.
8.5. Souřadnicový zeměpisný systém (CRS) v detailu
S pomocí souřadnicových referenčních systémů (CRS) je každé místo na zemi specifikována trojicí souřadnic. Obecně to znamená, že CRS můžou být rozděleny do „projekčníck souřadnicových referenčních systémů“ (často nazývaných kartézské nebo obdélníkové souřadnicové referenční systémy) and „geografické souřadnicové refereční systémy“.
8.5.1. Geografické souřadnicové systémy
Použití geografických referenčních souřadnicových systémů je velmi běžné. Používají se stupně zeměpisné šířky a zeměpisné délky and často také zeměpisné výšky k popsání bodu na Zemském povrchu. Nejčastšji používaný se nazývá „WGS 84“
Lines of latitude run parallel to the equator and divide the earth into 180 equally spaced sections from North to South (or South to North). The reference line for latitude is the equator and each hemisphere is divided into ninety sections, each representing one degree of latitude. In the northern hemisphere, degrees of latitude are measured from zero at the equator to ninety at the north pole. In the southern hemisphere, degrees of latitude are measured from zero at the equator to ninety degrees at the south pole. To simplify the digitisation of maps, degrees of latitude in the southern hemisphere are often assigned negative values (0 to -90°). Wherever you are on the earth’s surface, the distance between the lines of latitude is the same (60 nautical miles). See Obr. 8.9 for a pictorial view.
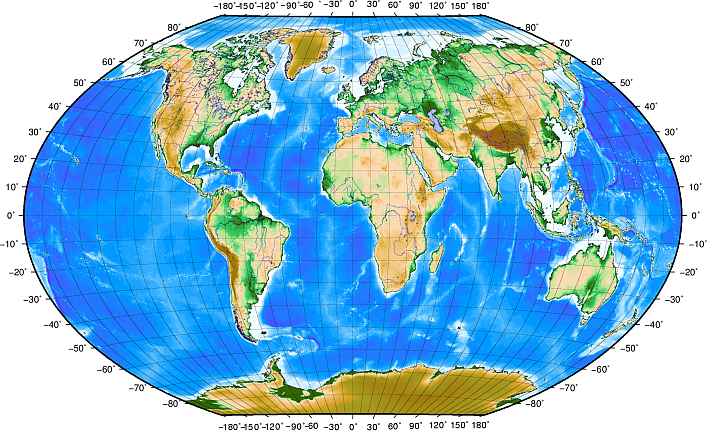
Obr. 8.9 Zeměpisný souřadnicový systém s liniemi zeměpisných šířek rovnoběžných k rovníku a liniemi zeměpisných délek rovnoběžných s poledníkem Greenwich.
Lines of longitude, on the other hand, do not stand up so well to the standard of uniformity. Lines of longitude run perpendicular to the equator and converge at the poles. The reference line for longitude (the prime meridian) runs from the North pole to the South pole through Greenwich, England. Subsequent lines of longitude are measured from zero to 180 degrees East or West of the prime meridian. Note that values West of the prime meridian are assigned negative values for use in digital mapping applications. See Obr. 8.9 for a pictorial view.
Pouze na rovníku je vzdálenost reprezentovaná jednou linií zeměpisné délky je stejná jako vzdálenost reprezentovaná jinou zeměpisnou délkou na této zeměpisné šířce. Při pohybu směrem k pólům se bude vzdálenost mezi liniemi zeměpisných šířek zkracovat dokud nedosáhmene pólů. Všechny 360 stupňové zeměpisné délky jsou reprezentovány jediným bodem, na který můžete položit prst (možná budete chtít mít rukavice). Použitím zeměpisného referenčního systému si můžeme sestavit mřížku linií rozdělujících zemi do čtverců, které pokrývají přibližně 12363.365 čverečních kilometrů na rovníku— dobrý start, ale není to velmi užitečné pro určování oblasti čehokoliv jiného než čtverce.
Aby to bylo opravdu užitečné, musí být mapová mřížka rozdělena do dostatečně malých sekcí aby mohly být použity k popsání (s akcepotovanou hodnoto uvážení) lokace bodu na mapě. Vzhledem k tomu že jsou stupně rozděleny na „minuty“ (“‘“) a vteřiny(“‘‘“). Máme šedesát minut v každém stupni a šedesát vteřin v každé minutě (3600 vteřin v jednom stupni). Takže, na rovníku je jedna sekunda zeměpisné délky nebo zeměpisné šířky 30.87624 metrů.
8.5.2. Projekční souřadnicový referenční systémy
A two-dimensional coordinate reference system is commonly defined by two axes. At right angles to each other, they form a so called XY-plane (see Obr. 8.10 on the left side). The horizontal axis is normally labelled X, and the vertical axis is normally labelled Y. In a three-dimensional coordinate reference system, another axis, normally labelled Z, is added. It is also at right angles to the X and Y axes. The Z axis provides the third dimension of space (see Obr. 8.10 on the right side). Every point that is expressed in spherical coordinates can be expressed as an X Y Z coordinate.
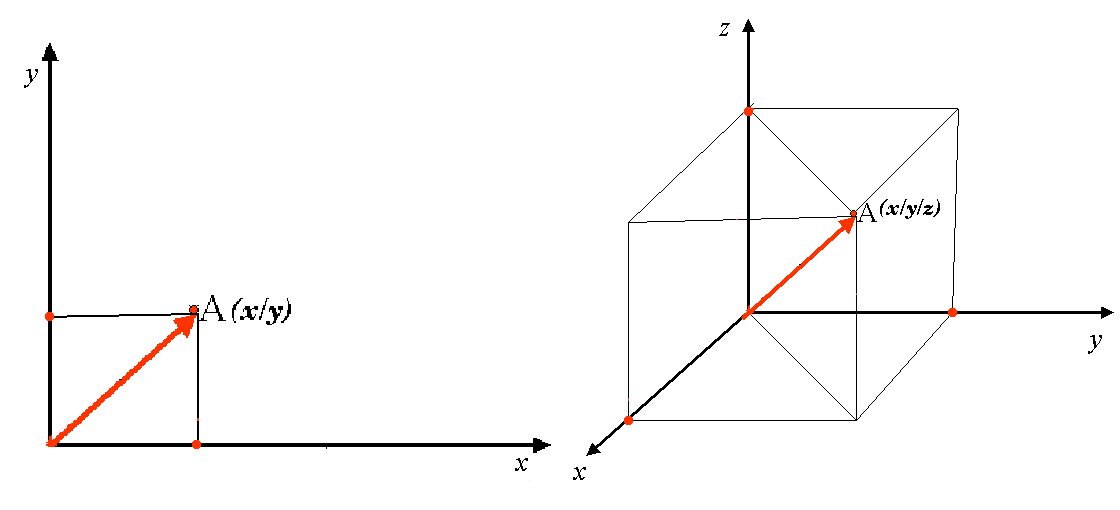
Obr. 8.10 Dvourozměrné a třírozměrné souřadnicový systémy.
Projekční souřadnicový referenční systém na jižní polokouli (jižně od rovníku) má normálně vlastní a specifické souřadnice „zeměpisné šířky“. To znamená, že hodna Y-ové souřadnice rostou směrem na jih a hodnoty X-ové souřadnice směrem na západ. Na severní polokouli (severně od rovníku) má také specifické hodnoty „zeměpisné šířky“. Avšak nyní hodnoty Y-ové souřadnice rostou směrem na sever a hodnoty X-ové souřadnice rostour směrem na východ. V následující sekci si popíšeme projekční souřadnicový referenční systém nazvaný (UTM), který je používán v Jižní Africe.
8.6. Univerzální transverzální Marcátorovo souřadnicový systém (UTM) v detailu.
The Universal Transverse Mercator (UTM) coordinate reference system has its origin on the equator at a specific Longitude. Now the Y-values increase southwards and the X-values increase to the West. The UTM CRS is a global map projection. This means, it is generally used all over the world. But as already described in the section ‚accuracy of map projections‘ above, the larger the area (for example South Africa) the more distortion of angular conformity, distance and area occur. To avoid too much distortion, the world is divided into 60 equal zones that are all 6 degrees wide in longitude from East to West. The UTM zones are numbered 1 to 60, starting at the antimeridian (zone 1 at 180 degrees West longitude) and progressing East back to the antemeridian (zone 60 at 180 degrees East longitude) as shown in Obr. 8.11.
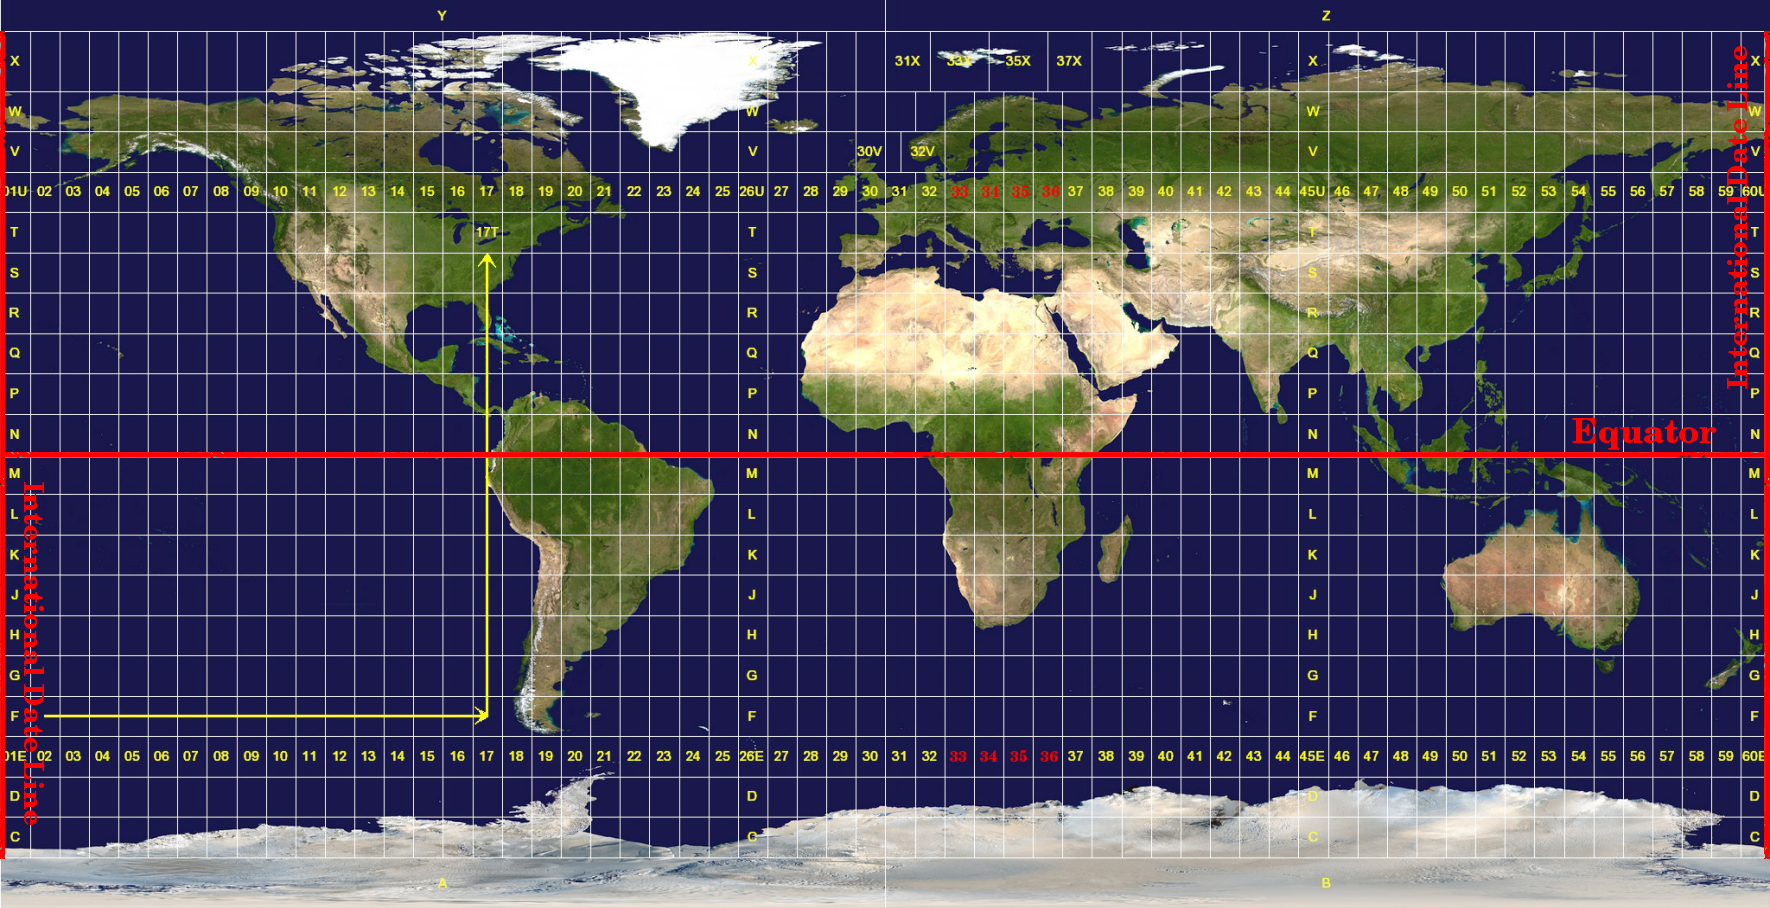
Obr. 8.11 Univerzální Transverzální Mercatorovo zńy. Pro Jižní Afriku jsou používány UTM zóny 33S, 34S, 35S a 36S.
As you can see in Obr. 8.11 and Obr. 8.12, South Africa is covered by four UTM zones to minimize distortion. The zones are called UTM 33S, UTM 34S, UTM 35S and UTM 36S. The S after the zone means that the UTM zones are located south of the equator.
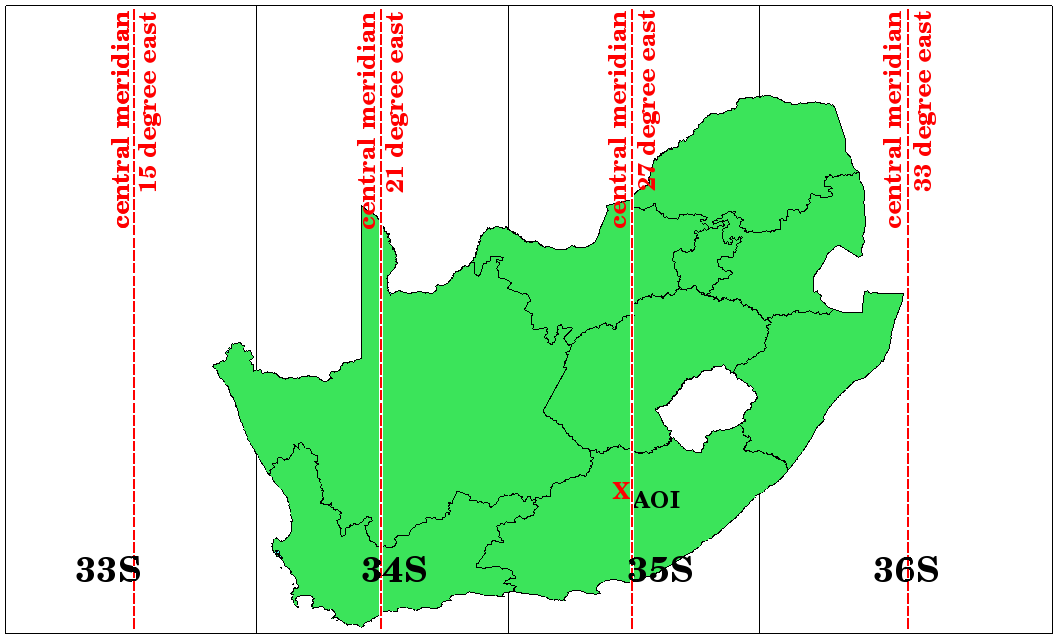
Obr. 8.12 UTM zóny 33S, 34S, 35S a 36S s centrálními zeměpisnými délkami (poledníky) jsou použity k projektu Jižní Afriky s vysokou přesností. Červený kříž ukazuje oblast zájmu (AOI).
Say, for example, that we want to define a two-dimensional coordinate within the Area of Interest (AOI) marked with a red cross in Obr. 8.12. You can see, that the area is located within the UTM zone 35S. This means, to minimize distortion and to get accurate analysis results, we should use UTM zone 35S as the coordinate reference system.
The position of a coordinate in UTM south of the equator must be indicated with the zone number (35) and with its northing (Y) value and easting (X) value in meters. The northing value is the distance of the position from the equator in meters. The easting value is the distance from the central meridian (longitude) of the used UTM zone. For UTM zone 35S it is 27 degrees East as shown in Obr. 8.12. Furthermore, because we are south of the equator and negative values are not allowed in the UTM coordinate reference system, we have to add a so called false northing value of 10,000,000 m to the northing (Y) value and a false easting value of 500,000 m to the easting (X) value. This sounds difficult, so, we will do an example that shows you how to find the correct UTM 35S coordinate for the Area of Interest.
8.6.1. The northing (Y) value
The place we are looking for is 3,550,000 meters south of the equator, so the northing (Y) value gets a negative sign and is -3,550,000 m. According to the UTM definitions we have to add a false northing value of 10,000,000 m. This means the northing (Y) value of our coordinate is 6,450,000 m (-3,550,000 m + 10,000,000 m).
8.6.2. The easting (X) value
First we have to find the central meridian (longitude) for the UTM zone 35S. As we can see in Obr. 8.12 it is 27 degrees East. The place we are looking for is 85,000 meters West from the central meridian. Just like the northing value, the easting (X) value gets a negative sign, giving a result of -85,000 m. According to the UTM definitions we have to add a false easting value of 500,000 m. This means the easting (X) value of our coordinate is 415,000 m (-85,000 m + 500,000 m). Finally, we have to add the zone number to the easting value to get the correct value.
Výsledkem je, že souřadnice našeho Bodu zájmu, promítané v UTM zóně 35S, budou zapsány jako: 35 415 000 m E / 6 450 000 m N. V některých GIS, když je definována správná zóna UTM 35S a jednotky jsou v systému nastaveny na metry, může být souřadnice také jednoduše zobrazena jako 415,000 6,450,000.
8.7. Projekce On-The-Fly
Jak si asi dokážete představit, může dojít k situaci, kdy data, která chcete použít v GIS, jsou promítnuta v různých souřadnicových referenčních systémech. Můžete například získat vektorovou vrstvu znázorňující hranice Jižní Afriky navržené v UTM 35S a další vektorovou vrstvu s bodovou informací o srážkách poskytnutou v geografickém souřadném systému WGS 84. V GIS jsou tyto dvě vektorové vrstvy umístěny v zcela odlišných oblastech mapového okna, protože mají různé projekce.
To solve this problem, many GIS include a functionality called on-the-fly projection. It means, that you can define a certain projection when you start the GIS and all layers that you then load, no matter what coordinate reference system they have, will be automatically displayed in the projection you defined. This functionality allows you to overlay layers within the map window of your GIS, even though they may be in different reference systems. In QGIS, this functionality is applied by default.
8.8. Běžné problémy / věci, kterým by jste se měli věnovat pozornost
Téma mapová projekce je velmi složitá a dokonce i profesionálové, kteří studovali geografii, geodézii nebo jiné vědy související s GIS, často mají problémy se správnou definicí mapových projekcí a souřadnicových referenčních systémů - CRS. Obvykle, když pracujete s GIS, máte již na začátku data v nějaké projekci. Ve většině případů budou tyto údaje promítány v určitém CRS, takže nemusíte vytvořit nový nebo dokonce znovu zpracovávat data z jednoho CRS do druhého. To znamená, že je vždy užitečné mít představu o tom, co mapová projekce a CRS znamená.
8.9. Co jsme se naučili?
Pojďme si shrnout, co jsme se naučili v tomto pracovním listu.
Mapové projekce zobrazují povrch země na dvourozměrném plochém papíru nebo na obrazovce počítače.
Existují globální mapové projekce, ale většina mapových projekcí je vytvořena a optimalizována pro zobrazování menších oblastí zemského povrchu.
Mapové projekce nejsou nikdy zcela přesné reprezentace sférické země. Vykazují zkreslení úhlové konformity, vzdálenosti a plochy. V mapové projekci nelze současně zachovat vše tyto vlastnosti bez zkreslení.
A ** Souřadnicový referenční systém ** (CRS) definuje pomocí souřadnic, jak dvojrozměrná promítaná mapa odpovídá reálným místům na Zemi.
Existují dva různé typy souřadnicových referenčních systémů: Geografické souřadnicové systémy a Projektované souřadnicové systémy.
On the Fly projekce je funkce v GIS, která nám umožňuje překrýt vrstvy, a to i v případě, že jsou promítány v různých souřadnicových referenčních systémech.
8.10. Teď si to vyzkoušejte!
Zde je několik nápadů, které můžete vyzkoušet se svými studenty:
Start QGIS
In check No projection (or unknown/non-Earth projection)
Load two layers of the same area but with different projections
Let your pupils find the coordinates of several places on the two layers. You can show them that it is not possible to overlay the two layers.
Then define the coordinate reference system as Geographic/WGS 84 inside the Project Properties dialog
Load the two layers of the same area again and let your pupils see how setting a CRS for the project (hence, enabling „on-the-fly“ projection) works.
You can open the Project Properties dialog in QGIS and show your pupils the many different Coordinate Reference Systems so they get an idea of the complexity of this topic. You can select different CRSs to display the same layer in different projections.
8.11. Něco k zamyšlení
If you don’t have a computer available, you can show your pupils the principles of the three map projection families. Get a globe and paper and demonstrate how cylindrical, conical and planar projections work in general. With the help of a transparency sheet you can draw a two-dimensional coordinate reference system showing X axes and Y axes. Then, let your pupils define coordinates (X and Y values) for different places.
8.12. Další čtení
Knihy:
Chang, Kang-Tsung (2006). Introduction to Geographic Information Systems. 3rd Edition. McGraw Hill. ISBN: 0070658986
DeMers, Michael N. (2005). Fundamentals of Geographic Information Systems. 3rd Edition. Wiley. ISBN: 9814126195
Galati, Stephen R. (2006): Geographic Information Systems Demystified. Artech House Inc. ISBN: 158053533X
Webové stránky:
https://foote.geography.uconn.edu/gcraft/notes/mapproj/mapproj_f.html
http://geology.isu.edu/wapi/geostac/Field_Exercise/topomaps/index.htm
Uživatelská příručka QGIS má také podrobnější informace o práci s mapovými projekcemi v QGIS.
8.13. Co dál?
V následující části se blíže podíváme na Tvorbu map.
