6.1. Lesson: 데이터 재투영 및 변환
좌표계(CRS) 얘기를 다시 해봅시다. 이전에 간략하게 언급했지만, 실제로 어떤 의미를 가지고 있는지에 대해서는 설명하지 않았습니다.
이 강의의 목표: 벡터 데이터를 재투영하고 변환하기.
6.1.1.  Follow Along: 투영
맵 자체는 물론 모든 데이터는 현재 WGS84 라는 CRS를 사용하고 있습니다. WGS84는 데이터를 표현하는 데 쓰이는 매우 흔한 지리 좌표계(GCS)입니다. 그러나 이제 곧 설명할 문제점도 가지고 있습니다.
현재 맵을 저장하십시오.
그 다음
exercise_data/world/world.qgs경로에 있는 세계 지도를 여십시오.Zoom In 도구를 사용해서 남아프리카 공화국으로 확대하십시오.
창 맨 아래의 상태 바 에 있는 Scale 항목으로 통해 축척을 설정해보십시오. 남아프리카 공화국이 보이는 상태에서
1:5,000,000(5백만 분의 1)로 값을 설정합니다.Scale 항목에 주의를 기울이면서 맵을 이리저리 이동해보십시오.
축척이 변하는 것을 보셨습니까? 여러분이 1:5,000,000 축척으로 확대한, 화면 정중앙에 있던 포인트를 벗어났기 때문입니다. 그 포인트를 벗어나면 축척이 달라집니다.
그 이유를 이해하려면, 지구의를 생각해보십시오. 남북 방향으로 선이 뻗어 있습니다. 이 경도 선들은 적도에서는 멀리 떨어져 있지만 남극/북극에서 만납니다.
GCS는 이 구체 상에서 정의되지만, 여러분의 모니터는 평면입니다. 평면에서 구체를 표현하려 할 때, 마치 테니스 공을 잘라서 평평하게 펼치려고 할 때처럼, 왜곡이 발생합니다. 즉 맵 상에서는 경도 선들이 (서로 만나야 할) 극지방에서도 평행하게 떨어져 있습니다. 다시 말해 맵 상에서 적도로부터 멀어질수록, 여러분이 보는 객체의 축척이 점점 커진다는 뜻입니다. 한 마디로 말하자면 맵 상의 위치에 따라 축척이 계속 변한다는 말이지요!
이 문제를 해결하기 위해 투영좌표계(PCS)를 대신 사용해봅시다. PCS는 축척 변화를 감안하여 바로잡는 방식으로 데이터를 “투영”하거나 변환합니다. 따라서 축척을 일정하게 유지하려면 PCS를 이용해서 데이터를 재투영해야 합니다.
6.1.2. Follow Along: “실시간” 재투영
QGIS는 기본적으로 “실시간(on the fly)” 으로 데이터를 재투영합니다. 데이터 자체가 다른 좌표계를 이용하고 있더라도, 사용자가 바라는 좌표계로 데이터를 투영할 수 있다는 뜻입니다.
QGIS 우하단에 있는  Current projection 버튼을 클릭하면 프로젝트의 좌표계를 변경할 수 있습니다.
대화창이 뜨면, Filter 항목에
global이라고 입력하십시오. 아래에 있는 Predefined Reference Systems 항목에 좌표계 몇 개가 나타날 것입니다.WGS 84 / NSIDC EASE-Grid 2.0 Global | EPSG:6933 항목을 클릭해서 선택한 다음 OK 를 클릭하십시오.
남아프리카 공화국의 형태가 어떻게 변하는지 보셨습니까? 투영체를 바꾸면 지구 상의 객체의 형태가 바뀝니다.
이전과 마찬가지로
1:5,000,000축척으로 확대하십시오.맵을 이리저리 이동해보십시오.
축척이 일정하게 유지됩니다!
서로 다른 CRS를 이용하는 데이터셋을 결합하는 데에도 “실시간” 재투영을 사용할 수 있습니다.
남아프리카 공화국의 데이터만을 가지고 있는 다른 벡터 레이어를 맵에 추가해보십시오.
exercise_data/world/RSA.shp경로에서 찾을 수 있습니다.해당 레이어를 불러오십시오. 범례에 있는 레이어 위에 마우스를 가져가면 레이어의 좌표계를 쉽게 알 수 있습니다. 해당 레이어의 좌표계는
EPSG:3410입니다.보이십니까?
해당 레이어가 continents 레이어와는 다른 좌표계인데도 스크린에 가시화되었습니다.
6.1.3.  Follow Along: 다른 CRS로 데이터셋 저장
Sometimes you need to export an existing dataset with another CRS. As we will see in the next lesson, if you need to make distance calculations on layer, it is always better to have the layer in a projected coordinate system.
Be aware that the ‘on the fly’ reprojection is related to the project and not to single layers. This means that a layer can have a different CRS from the project even if you see it in the correct position.
You can easily export the layer with another CRS.
Add the
buildingsdataset fromtraining_data.gpkgRight-click on the
buildingslayer in the Layers panelSelect in the menu that appears. You will be shown the Save Vector Layer as… dialog.
Click on the Browse button next to the File name field
Navigate to
exercise_data/and specify the name of the new layer asbuildings_reprojected.shp.Change the value of the CRS. Only the recent CRSs used will be shown in the drop-down menu. Click on the
 Select projection button next
to the drop-down menu.
Select projection button next
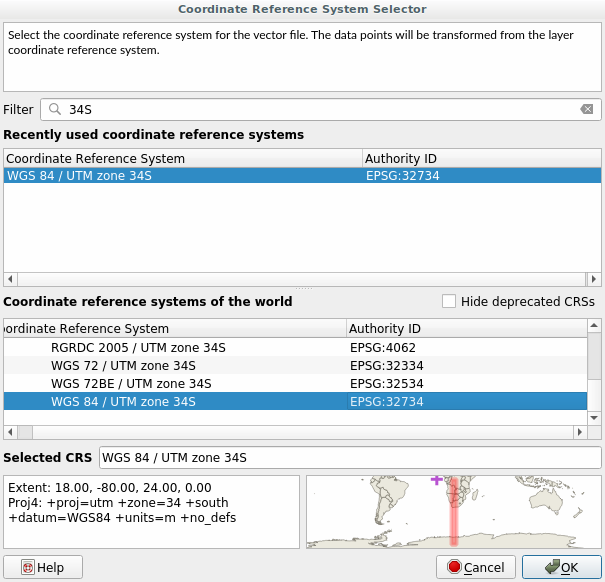
to the drop-down menu.The Coordinate Reference System Selector dialog will appear. In its Filter field, search for
34S.Select WGS 84 / UTM zone 34S | EPSG:32734 from the list
Leave the other options unchanged. The Save Vector Layer as… dialog now looks like this:
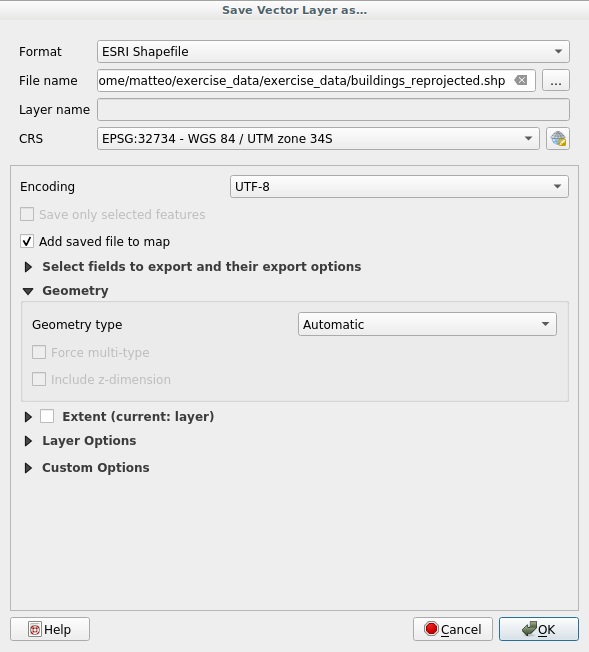
OK 를 클릭합니다.
You can now compare the old and new projections of the layer and see that they are in two different CRS but they are still overlapping.
6.1.4.  Follow Along: 사용자 지정 투영체 생성
QGIS에 기본으로 포함된 투영체 외에도 많은 투영체가 있습니다. 여러분 자신만의 투영체를 생성할 수도 있습니다.
Start a new map
Load the
world/oceans.shpdatasetGo to and you will see this dialog.
Click on the
 Add new CRS button to create a new
projection
Add new CRS button to create a new
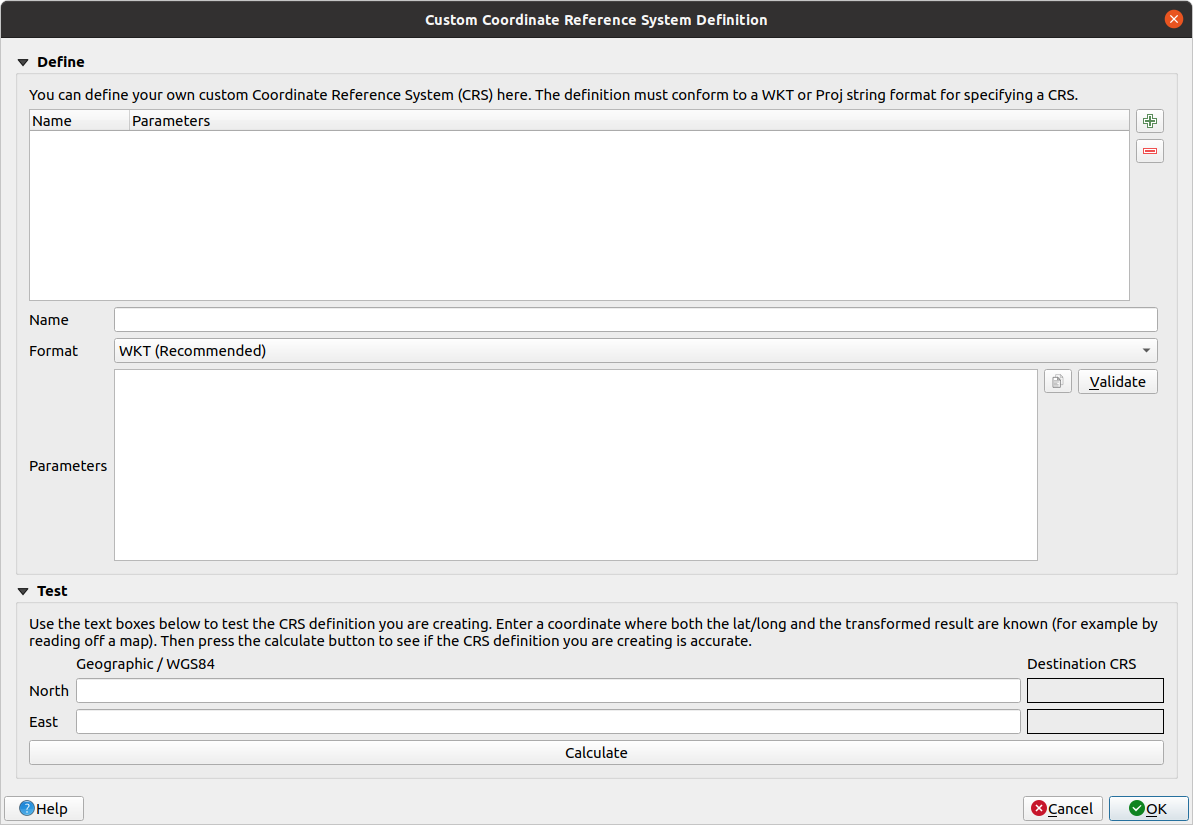
projectionAn interesting projection to use is called
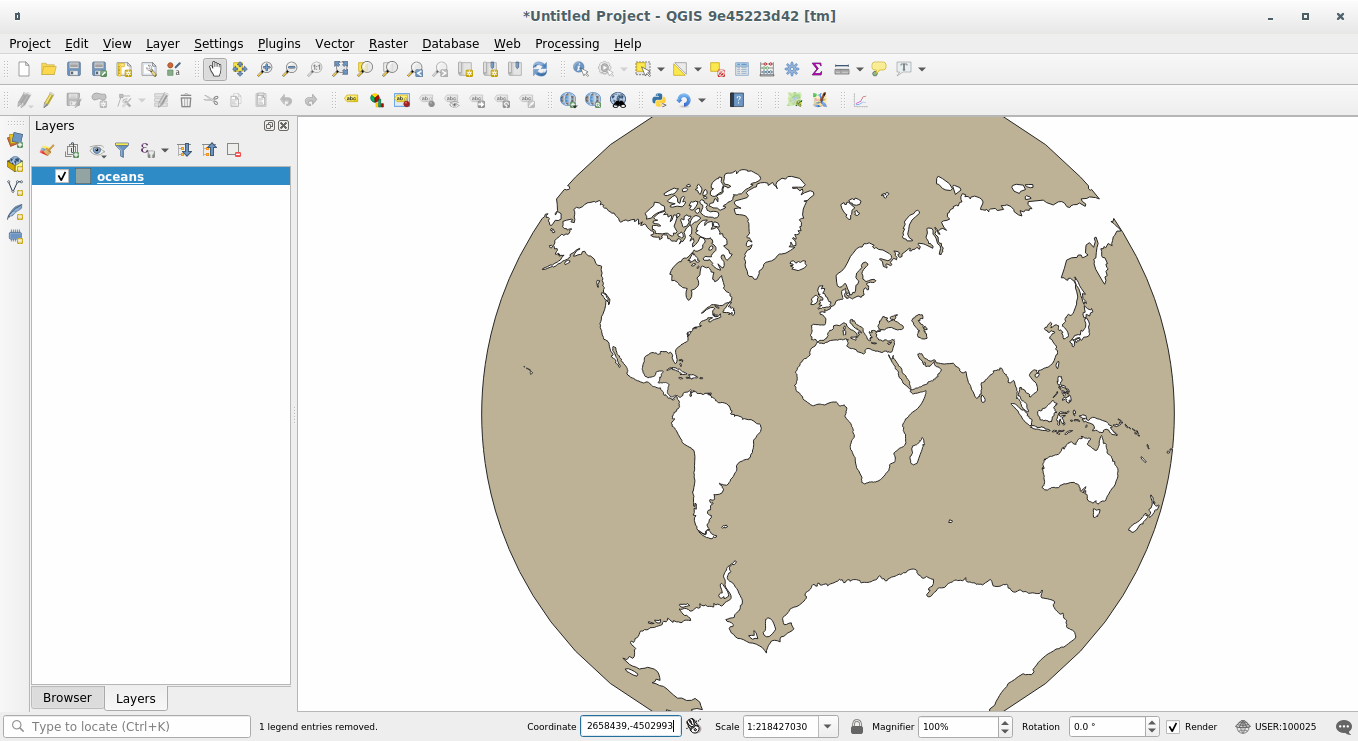
Van der Grinten I. Enter its name in the Name field.이 투영체는 다른 대부분 투영체와는 달리 사각 면이 아니라 원형 면에 지구를 표현합니다.
In Format, select WKT (Recommended)
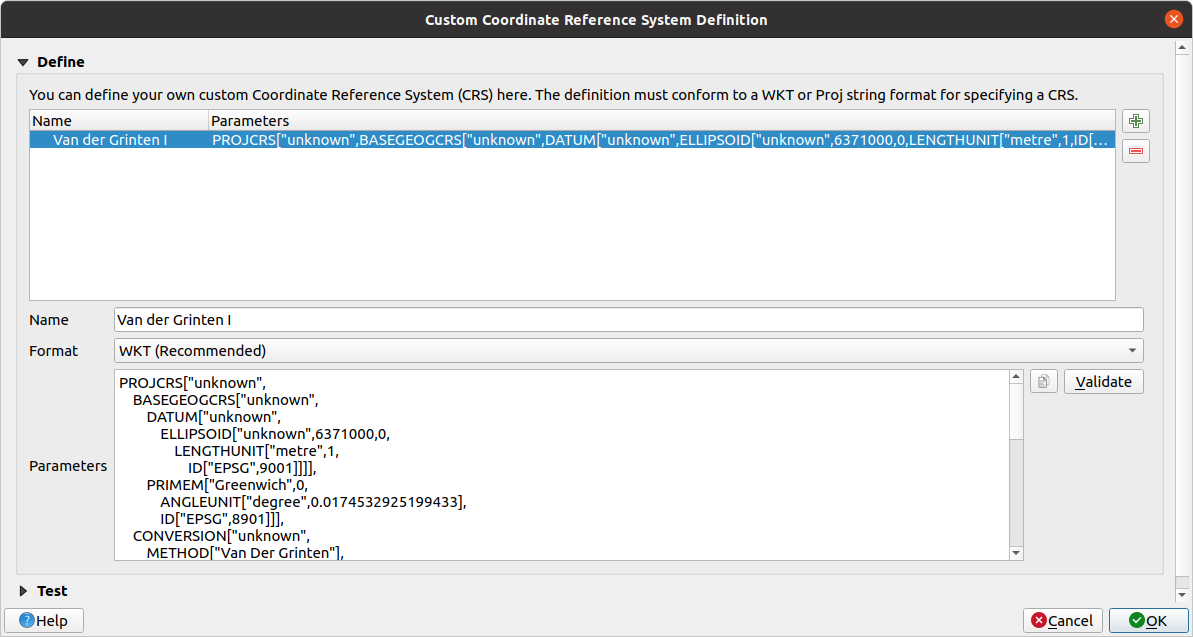
Add the following string in the Parameters field:
PROJCRS["unknown",
    BASEGEOGCRS["unknown",
        DATUM["unknown",
            ELLIPSOID["unknown",6371000,0,
                LENGTHUNIT["metre",1,
                    ID["EPSG",9001]]]],
        PRIMEM["Greenwich",0,
            ANGLEUNIT["degree",0.0174532925199433],
            ID["EPSG",8901]]],
    CONVERSION["unknown",
        METHOD["Van Der Grinten"],
        PARAMETER["Longitude of natural origin",0,
            ANGLEUNIT["degree",0.0174532925199433],
            ID["EPSG",8802]],
        PARAMETER["False easting",0,
            LENGTHUNIT["metre",1],
            ID["EPSG",8806]],
        PARAMETER["False northing",0,
            LENGTHUNIT["metre",1],
            ID["EPSG",8807]]],
    CS[Cartesian,2],
        AXIS["(E)",east,
            ORDER[1],
            LENGTHUNIT["metre",1,
                ID["EPSG",9001]]],
        AXIS["(N)",north,
            ORDER[2],
            LENGTHUNIT["metre",1,
                ID["EPSG",9001]]]]
OK 를 클릭합니다.
Click on the
Current CRS button at the
right of the status bar to change the project CRSChoose your newly defined projection (search for its name in the Filter field)
이 투영체를 적용하면 맵이 다음과 같이 재투영될 것입니다.
6.1.5. In Conclusion
목적에 따라 유용한 투영체도 달라집니다. 올바른 투영체를 선택함으로써 사용자 맵 상에 피처를 정확하게 표현할 수 있게 됩니다.
6.1.6. Further Reading
Materials for the Advanced section of this lesson were taken from this article.
Read further information on Coordinate Reference Systems.
6.1.7. What’s Next?
In the next lesson you will learn how to analyze vector data using QGIS’ various vector analysis tools.