8.2. Lesson: 분석의 결합
래스터 분석을 벡터화한 결과물을 이용하면 적합한 지형에 있는 건물들만 선택할 수 있게 됩니다.
이 강의의 목표: 벡터화된 지형 분석 결과를 이용해서 적합한 계획을 선택하기.
8.2.1.  Try Yourself
현재 맵(
raster_analysis.qgs)을 저장하십시오.이전 벡터 분석 과정에서 생성했던 (
analysis.qgs라는 파일로 저장되어 있을 겁니다) 맵을 엽니다.Layers 패널에서 다음 레이어들을 활성화하십시오:
hillshade,
solution (또는 buildings_over_100)
이전에 작업했을 때 이미 맵에 로드돼 있어야 하는 이 레이어들 외에,
suitable_terrain.shp데이터셋도 추가하십시오.일부 레이어가 보이지 않을 경우
exercise_data/residential_development/디렉터리에서 찾을 수 있을 것입니다.Intersection 도구()를 사용해서 suitable_terrain 레이어와 교차하는 건물들만 담고 있는
new_solution.shp라는 새 벡터 레이어를 생성하십시오.
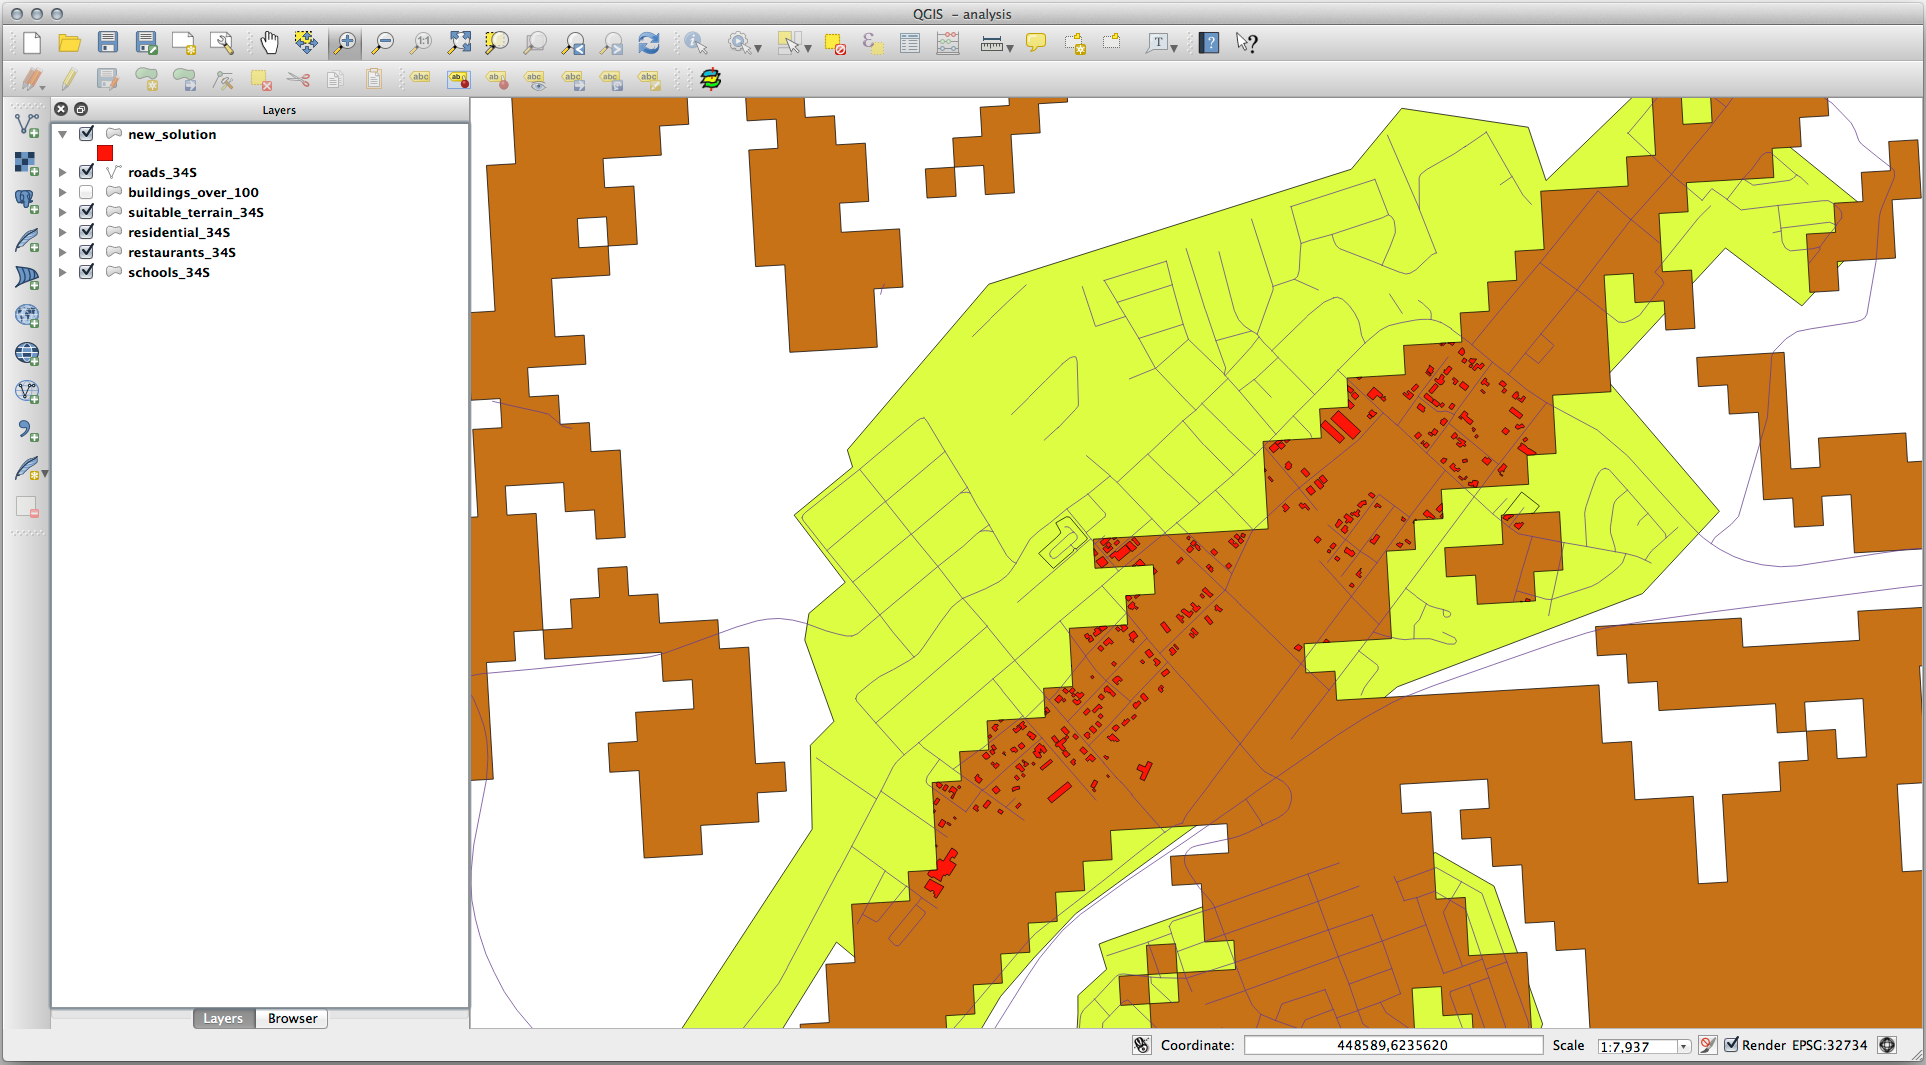
이제 해답으로 다음과 같이 특정한 건물들만 보이는 레이어를 생성했을 것입니다.
8.2.2. Try Yourself 결과 점검
new_solution 레이어에 있는 건물을 하나 하나 살펴보십시오. new_solution 레이어의 심볼을 변경해서 윤곽선만 보이도록 한 다음, suitable_terrain 레이어와 비교해보십시오. 어떤 건물에 눈에 띄는 점이 있습니까? 단지 suitable_terrain 레이어와 교차한다고 해서 모든 건물이 적합한가요? 아니라면 그 이유는 무엇일까요? 어떤 건물이 적합하지 않아 보입니까?
Answer
You may notice that some of the buildings in your new_solution layer
have been “sliced” by the Intersection tool. This shows that only
part of the building - and therefore only part of the property - lies on
suitable terrain. We can therefore sensibly eliminate those buildings from
our dataset.
8.2.3. Try Yourself 분석 개선
결과물에 포함된 건물들 가운데 실제로는 적합하지 않는 건물을 볼 수 있습니다. 따라서 이제 분석을 개선할 수 있습니다.
우리는 suitable_terrain 레이어 안에 완전히 들어가는 건물들만 반환하도록 분석하고자 합니다. 어떻게 하면 될까요? 우리가 원하는 건물은 면적이 100평방미터 이상이어야 한다는 점을 기억하면서 하나 또는 그 이상의 벡터 분석 도구를 사용해보십시오.
Answer
At the moment, your analysis should look something like this:
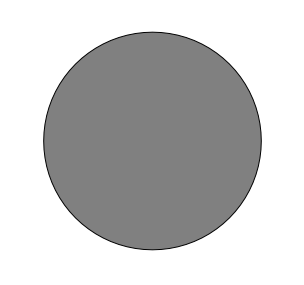
Consider a circular area, continuous for 100 meters in all directions.
If it is greater than 100 meters in radius, then subtracting 100 meters from its size (from all directions) will result in a part of it being left in the middle.
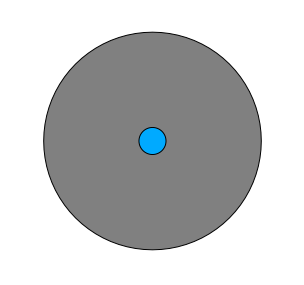
Therefore, you can run an interior buffer of 100 meters on your existing suitable_terrain vector layer. In the output of the buffer function, whatever remains of the original layer will represent areas where there is suitable terrain for 100 meters beyond.
To demonstrate:
Go to to open the Buffer(s) dialog.
Set it up like this:
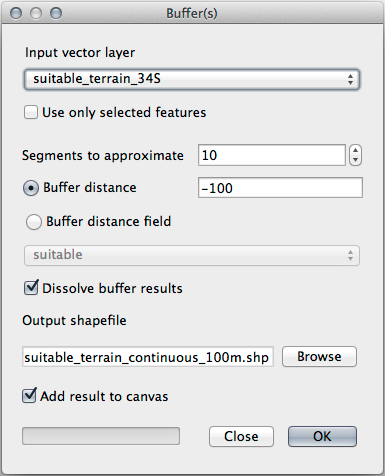
Use the suitable_terrain layer with
10segments and a buffer distance of-100. (The distance is automatically in meters because your map is using a projected CRS.)Save the output in
exercise_data/residential_development/assuitable_terrain_continuous100m.shp.If necessary, move the new layer above your original suitable_terrain layer.
Your results will look like something like this:
Now use the Select by Location tool ().
Set up like this:
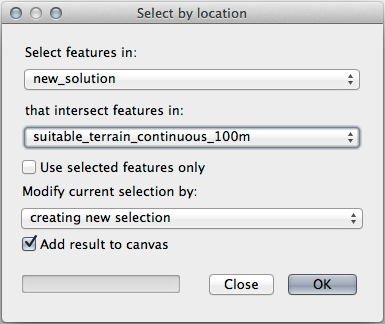
Select features in new_solution that intersect features in suitable_terrain_continuous100m.shp.
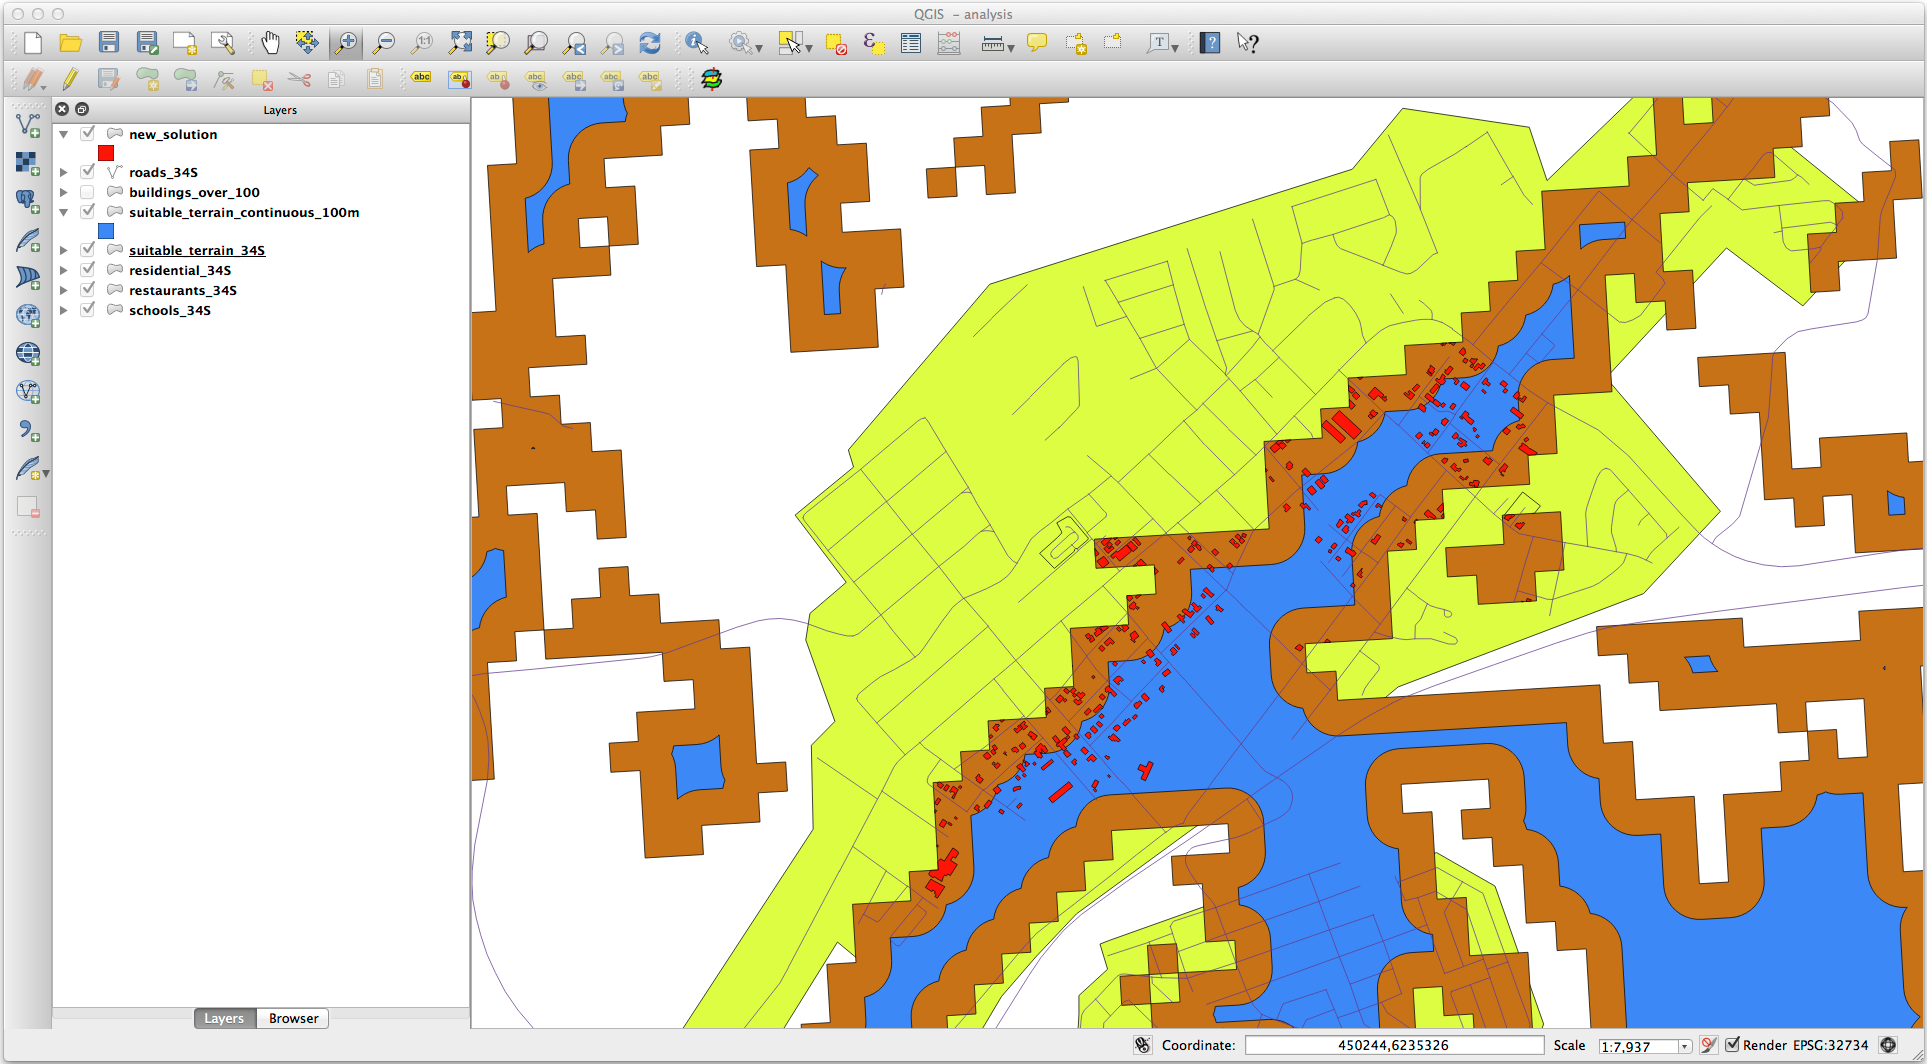
This is the result:

The yellow buildings are selected. Although some of the buildings fall partly outside the new suitable_terrain_continuous100m layer, they lie well within the original suitable_terrain layer and therefore meet all of our requirements.
Save the selection under
exercise_data/residential_development/asfinal_answer.shp.
8.2.4. In Conclusion
이제 처음의 연구 문제에 해답을 내놓았고, 어떤 부지를 개발해야 할지에 대한 (분석 결과가 뒷받침하는 논리적인) 추천 의견을 제시할 수도 있습니다.
8.2.5. What’s Next?
다음으로, 여러분의 두 번째 과제의 일부로 이 결과물을 제출하게 될 것입니다.