중요
번역은 여러분이 참여할 수 있는 커뮤니티 활동입니다. 이 페이지는 현재 74.42% 번역되었습니다.
8.2. 수업: 분석 결합하기
래스터 분석을 벡터화한 결과물을 사용하면 적합한 지형에 있는 건물들만 선택할 수 있게 됩니다.
이 수업의 목표: 벡터화된 지형 분석 결과를 이용해서 적합한 계획을 선택하기.
8.2.1. ★★☆ 혼자서 해보세요:
현재 맵(
raster_analysis.qgs)을 저장하십시오.이전 벡터 분석 도중 생성했던 (
analysis.qgs라는 파일로 저장되어 있을) 맵을 엽니다.Layers 패널에서 다음 레이어들을 활성화하십시오:
hillshade,solution(orbuildings_over_100)
이전에 작업했을 때부터 이미 맵에 불러와져 있어야 하는 이 레이어들 외에,
suitable_terrain.shp데이터셋도 추가하십시오.일부 레이어가 보이지 않을 경우
exercise_data/residential_development/디렉터리에서 찾을 수 있을 것입니다.Use the Intersection tool () to create a new vector layer called
new_solution.shpwhich contains only those buildings which intersect thesuitable_terrainlayer.
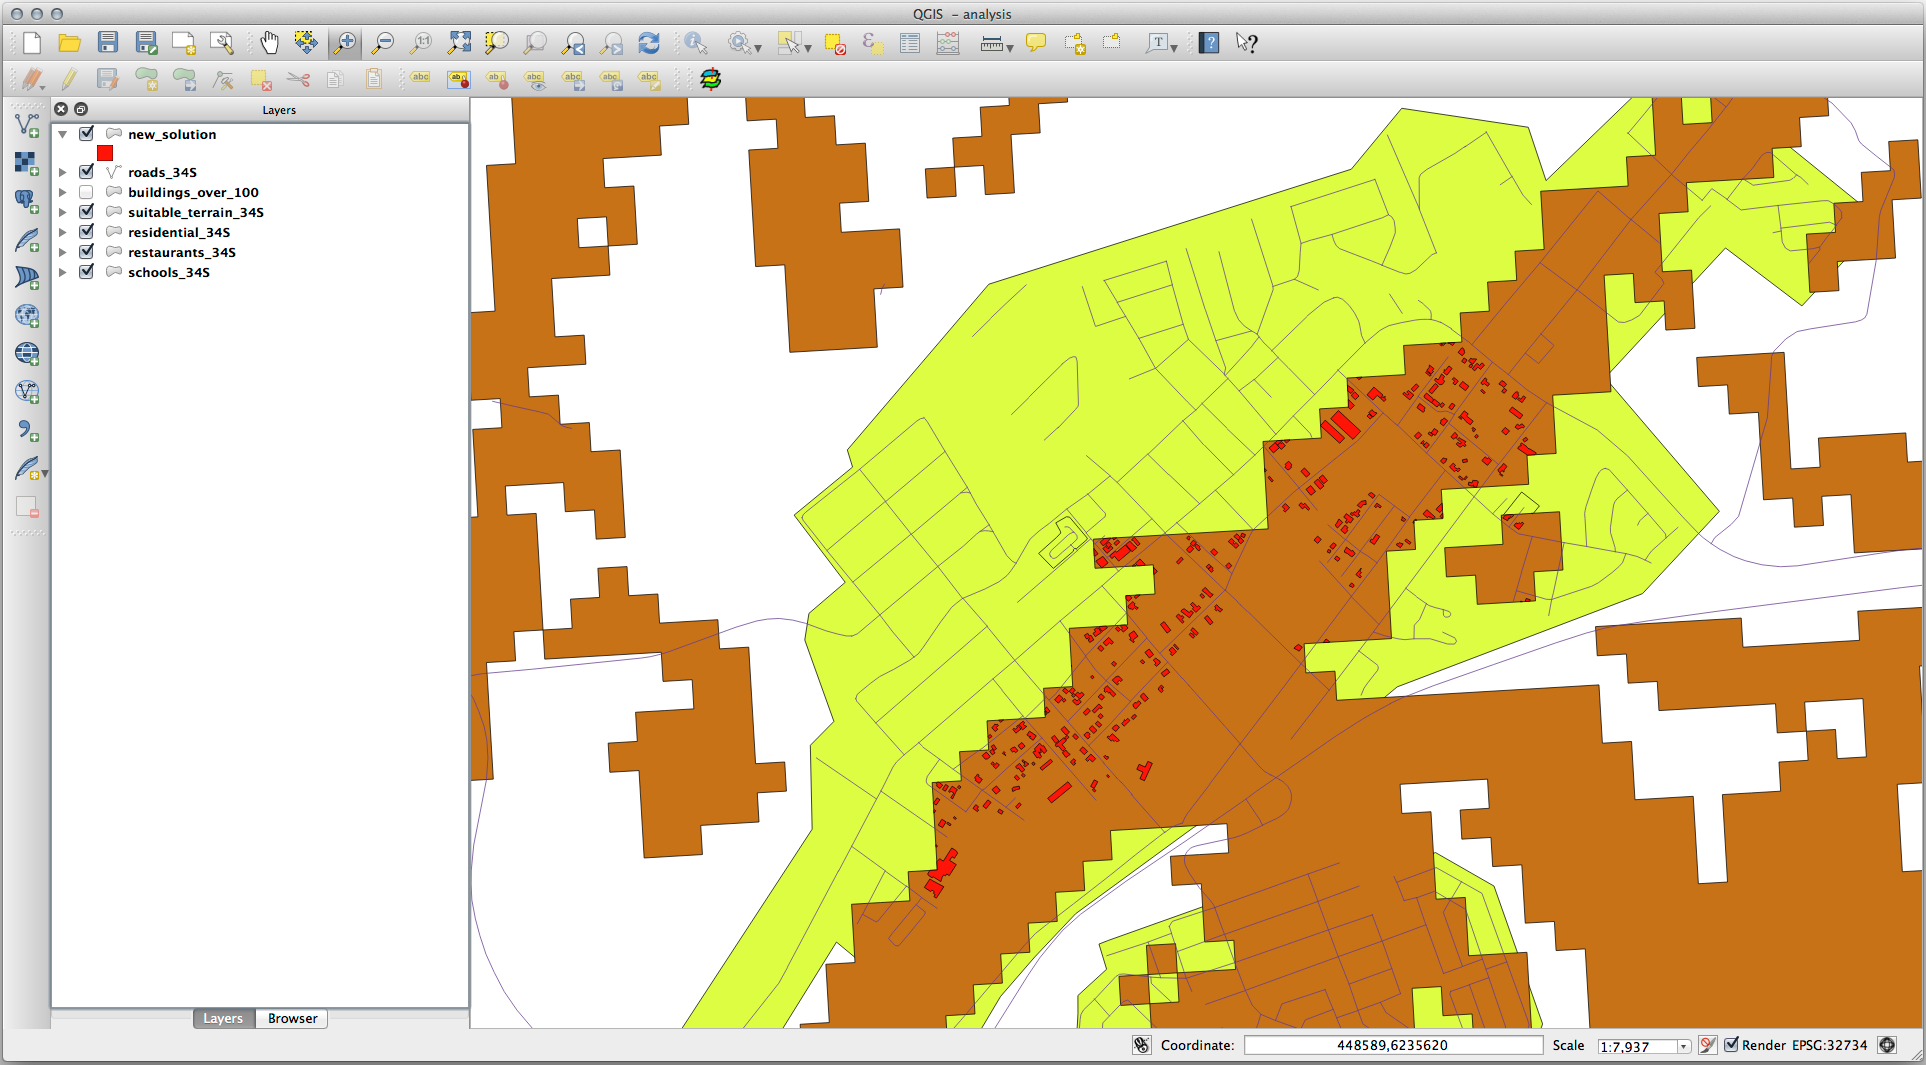
이제 해답으로 다음과 같이 특정한 건물들만 보이는 레이어를 생성했을 것입니다:
8.2.2. ★★☆ 혼자서 해보세요: 결과물 검사하기
Look at each of the buildings in your new_solution layer. Compare them
with the suitable_terrain layer by changing the symbology for the
new_solution layer so that it has outlines only. What do you notice
about some of the buildings? Are they all suitable just because they intersect with
the suitable_terrain layer? Why or why not? Which ones would you
deem to be unsuitable?
해답
You may notice that some of the buildings in your new_solution layer
have been “sliced” by the Intersection tool. This shows that only
part of the building - and therefore only part of the property - lies on
suitable terrain. We can therefore sensibly eliminate those buildings from
our dataset.
8.2.3. ★★☆ 혼자서 해보세요: 분석 개선하기
결과물에 포함된 건물들 가운데 실제로는 적합하지 않은 건물을 볼 수 있습니다. 따라서 이제 분석을 개선할 수 있습니다.
We want to ensure that our analysis returns only those buildings which fall
entirely within the suitable_terrain layer. How would you achieve this?
Use one or more Vector Analysis tools and remember that our buildings are all
over 100m squared in size.
해답
이 시점에서, 여러분의 분석은 다음과 비슷하게 보여야 합니다:
모든 방향으로 100미터 계속되는 원형 영역을 가정해보십시오.
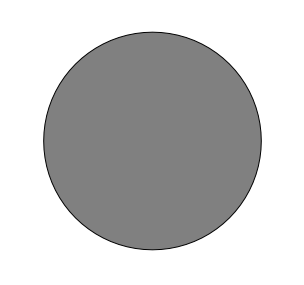
반경이 100미터를 초과하는 경우, (모든 방향에서) 100미터를 빼면 한가운데 그 일부가 남게 될 것입니다.
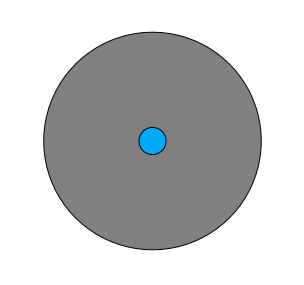
Therefore, you can run an interior buffer of 100 meters on your existing
suitable_terrain vector layer. In the output of the buffer
function, whatever remains of the original layer will represent areas where
there is suitable terrain for 100 meters beyond.
이를 시연해봅시다:
메뉴 항목을 선택해서 Buffer(s) 대화창을 여십시오.
다음과 같이 설정하십시오:
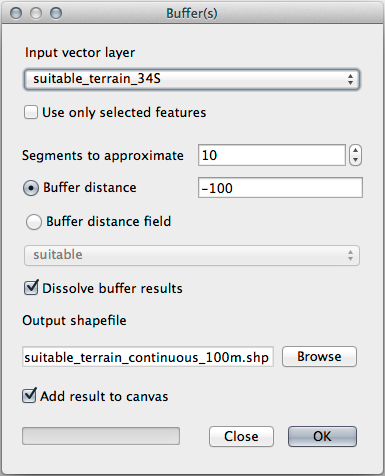
Use the
suitable_terrainlayer with10segments and a buffer distance of-100. (The distance is automatically in meters because your map is using a projected CRS.)exercise_data/residential_development/디렉터리에 산출물을suitable_terrain_continuous100m.shp로 저장하십시오.If necessary, move the new layer above your original
suitable_terrainlayer.결과물이 다음과 비슷하게 보일 것입니다:
이제 Select by Location 도구를 사용하십시오. ()
다음과 같이 설정하십시오:
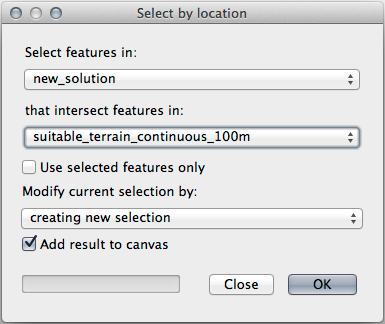
Select features in
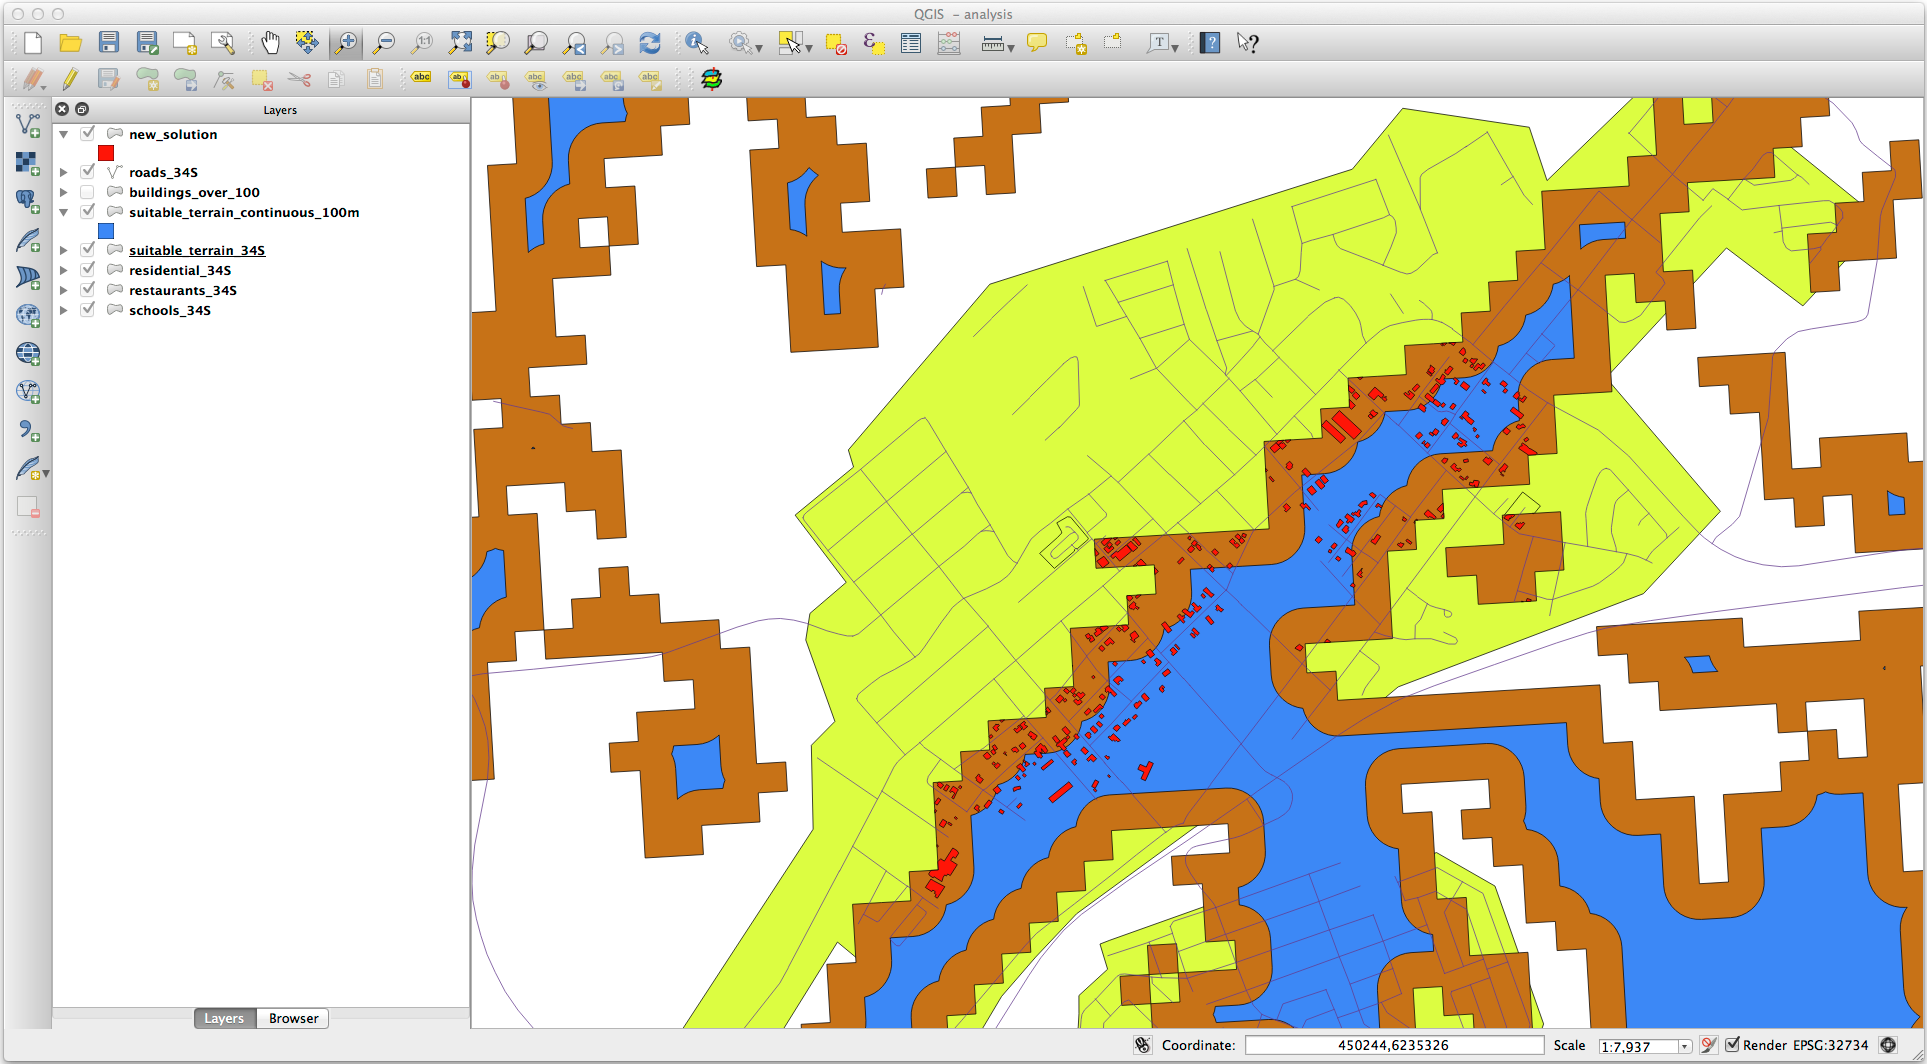
new_solutionthat intersect features insuitable_terrain_continuous100m.shp.결과는 다음과 같습니다:

The yellow buildings are selected. Although some of the buildings fall partly outside the new
suitable_terrain_continuous100mlayer, they lie well within the originalsuitable_terrainlayer and therefore meet all of our requirements.exercise_data/residential_development/디렉터리에 이 선택 집합을final_answer.shp파일로 저장하십시오.
8.2.4. 결론
이제 처음의 연구 문제에 해답을 내놓았고, 어떤 부지를 개발해야 할지에 대한 (분석 결과가 뒷받침하는 논리적인) 추천 의견을 제시할 수도 있습니다.
8.2.5. 다음은 무엇을 배우게 될까요?
다음은 여러분의 두 번째 과제의 일부로써 이 결과물을 제출하게 될 것입니다.