Svarbu
Vertimas yra bendruomenės pastangos, prie kurių jūs galite prisijungti. Šis puslapis šiuo metu išverstas 6.98%.
8.2. Pamoka: Analizių kombinavimas
Using the vectorized results of the raster analysis will allow you to select only those buildings on suitable terrain.
The goal for this lesson: To use the vectorized terrain results to select suitable plots.
8.2.1. ★★☆ Try Yourself:
Save your current map (
raster_analysis.qgs).Open the map which you created during the vector analysis earlier (you should have saved the file as
analysis.qgs).In the Layers panel, enable these layers:
hillshade,solution(orbuildings_over_100)
In addition to these layers, which should already be loaded in the map from when you worked on it before, also add the
suitable_terrain.shpdataset.If you are missing some layers, you should find them in
exercise_data/residential_development/Use the Intersection tool () to create a new vector layer called
new_solution.shpwhich contains only those buildings which intersect thesuitable_terrainlayer.
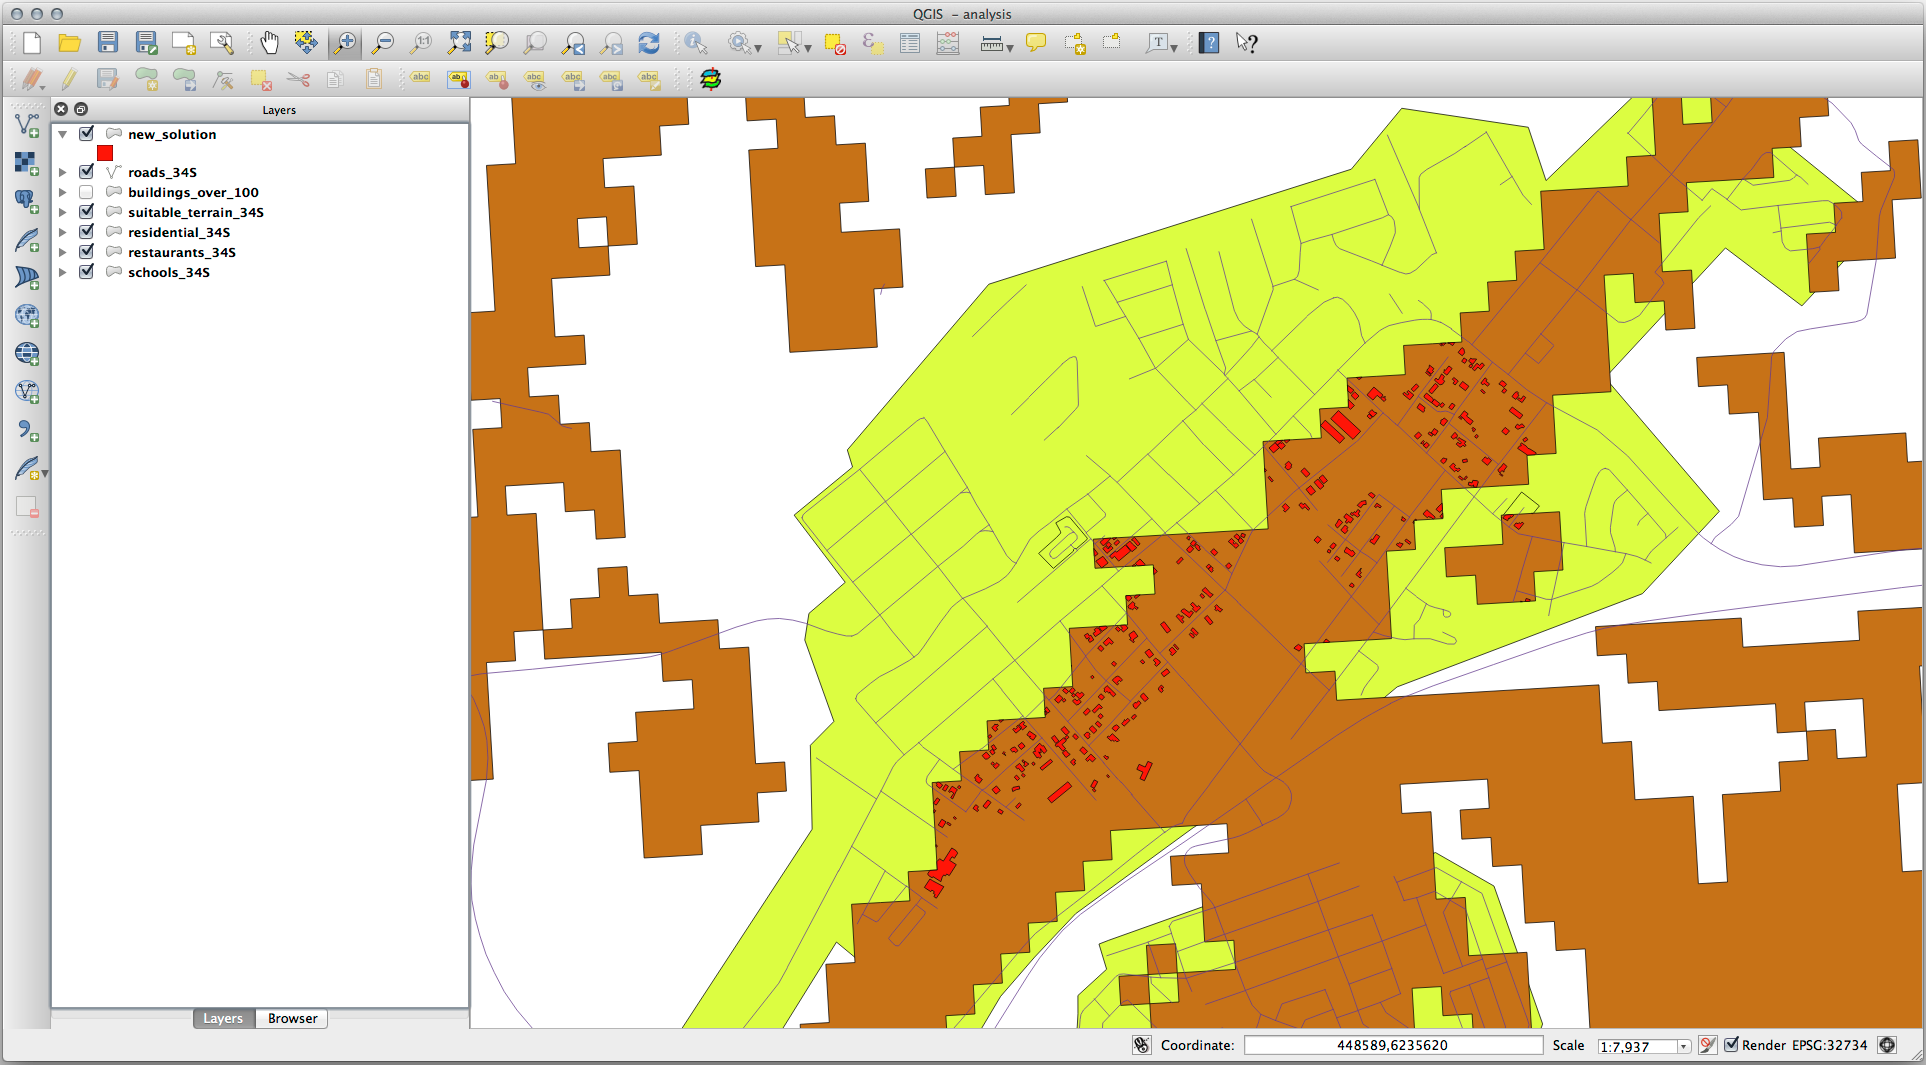
You should now have a layer showing certain buildings as your solution, for example:
8.2.2. ★★☆ Try Yourself: Inspecting the Results
Look at each of the buildings in your new_solution layer. Compare them
with the suitable_terrain layer by changing the symbology for the
new_solution layer so that it has outlines only. What do you notice
about some of the buildings? Are they all suitable just because they intersect with
the suitable_terrain layer? Why or why not? Which ones would you
deem to be unsuitable?
Answer
You may notice that some of the buildings in your new_solution layer
have been „sliced“ by the Intersection tool. This shows that only
part of the building - and therefore only part of the property - lies on
suitable terrain. We can therefore sensibly eliminate those buildings from
our dataset.
8.2.3. ★★☆ Try Yourself: Refining the Analysis
You can see from the results that some buildings which were included were not really suitable, so we can now refine the analysis.
We want to ensure that our analysis returns only those buildings which fall
entirely within the suitable_terrain layer. How would you achieve this?
Use one or more Vector Analysis tools and remember that our buildings are all
over 100m squared in size.
Answer
At the moment, your analysis should look something like this:
Consider a circular area, continuous for 100 meters in all directions.
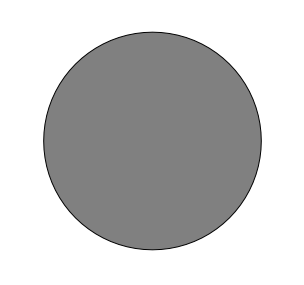
If it is greater than 100 meters in radius, then subtracting 100 meters from its size (from all directions) will result in a part of it being left in the middle.
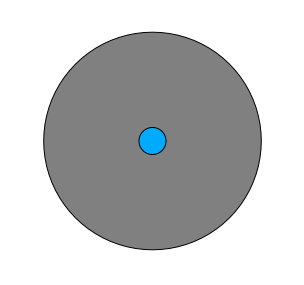
Therefore, you can run an interior buffer of 100 meters on your existing
suitable_terrain vector layer. In the output of the buffer
function, whatever remains of the original layer will represent areas where
there is suitable terrain for 100 meters beyond.
To demonstrate:
Go to to open the Buffer(s) dialog.
Set it up like this:
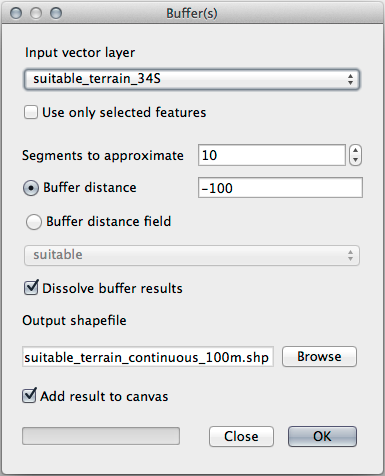
Use the
suitable_terrainlayer with10segments and a buffer distance of-100. (The distance is automatically in meters because your map is using a projected CRS.)Save the output in
exercise_data/residential_development/assuitable_terrain_continuous100m.shp.If necessary, move the new layer above your original
suitable_terrainlayer.Your results will look like something like this:
Now use the Select by Location tool ().
Set up like this:
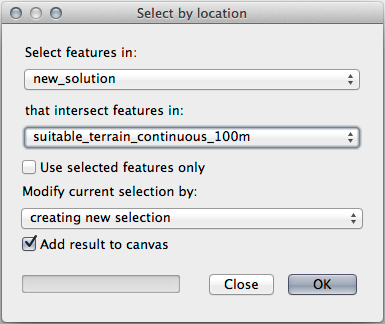
Select features in
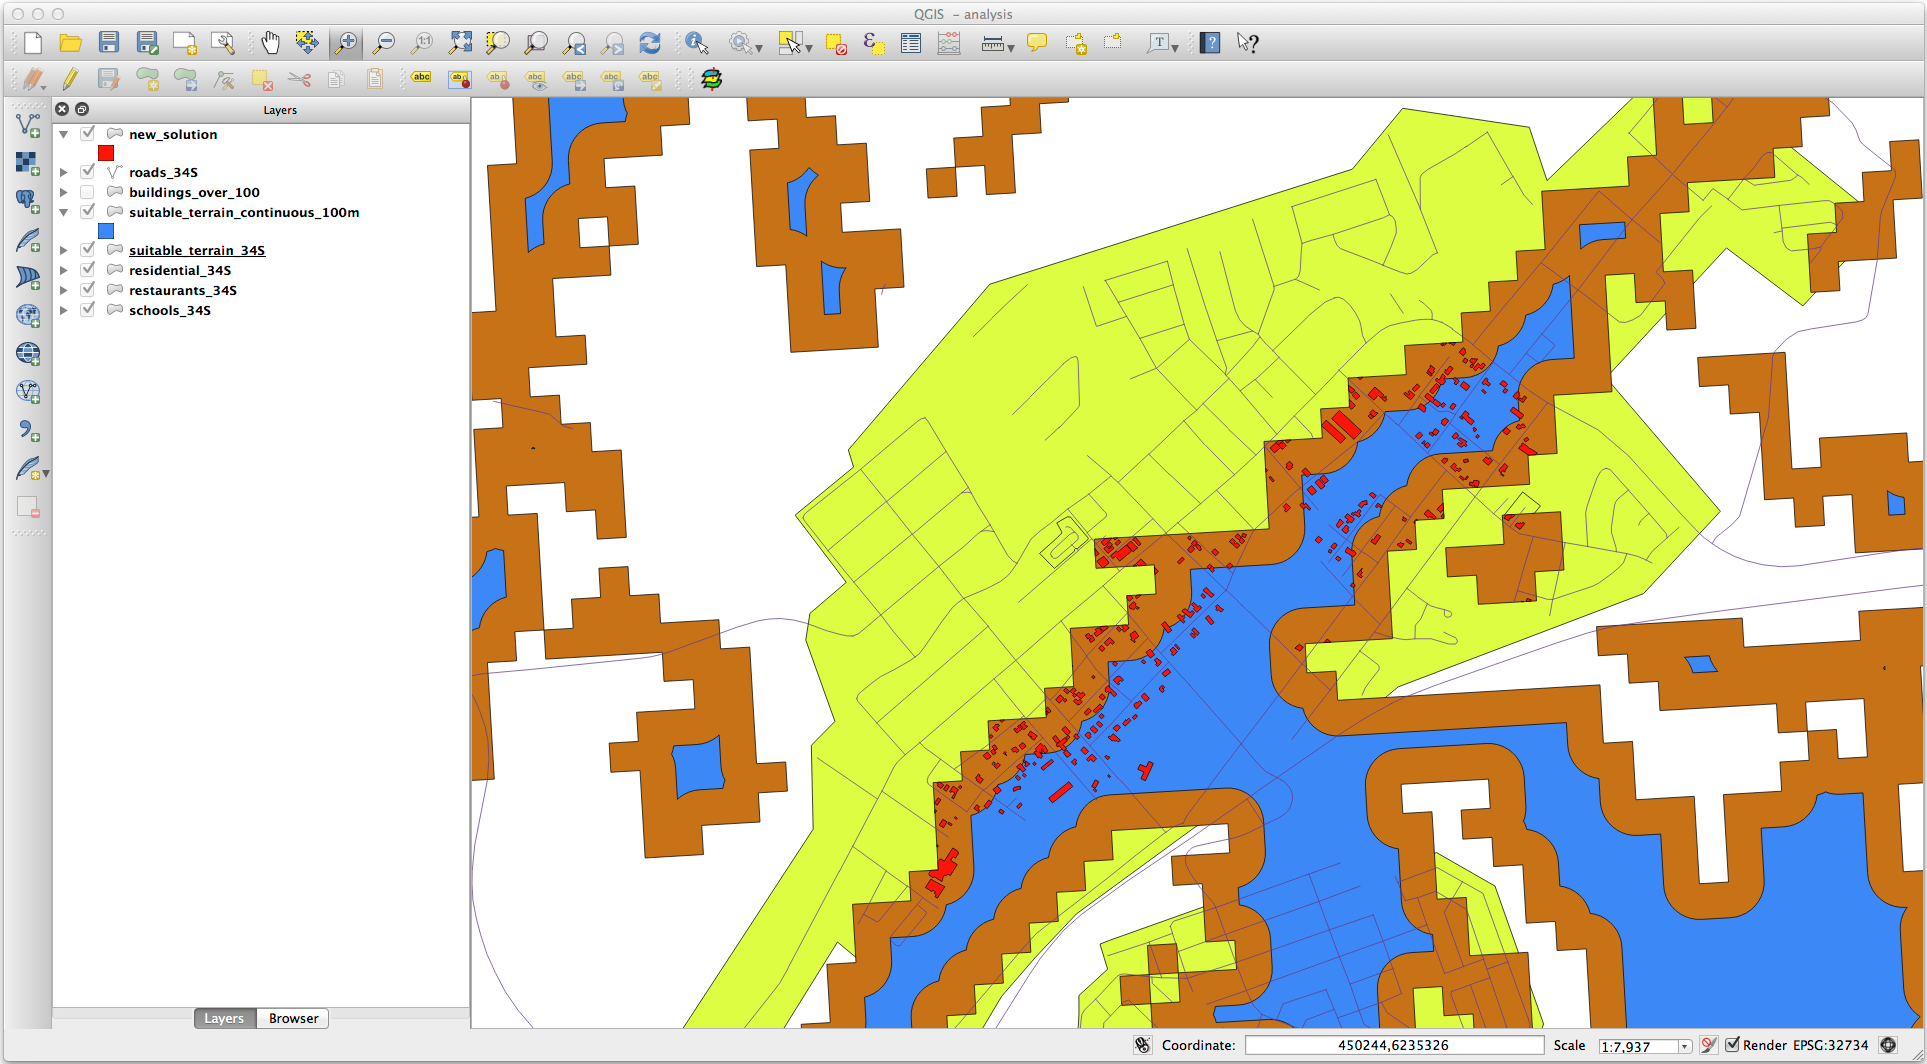
new_solutionthat intersect features insuitable_terrain_continuous100m.shp.This is the result:

The yellow buildings are selected. Although some of the buildings fall partly outside the new
suitable_terrain_continuous100mlayer, they lie well within the originalsuitable_terrainlayer and therefore meet all of our requirements.Save the selection under
exercise_data/residential_development/asfinal_answer.shp.
8.2.4. In Conclusion
You have now answered the original research question, and can offer an opinion (with reasons, backed by analysis) for a recommendation regarding which property to develop.
8.2.5. What’s Next?
Next you will present these results as part of your second assignment.