12.2. Lesson: GRASSツール
このレッスンでは、あなたにGRASSの機能についてのアイデアを与えるために選り抜きのツールを紹介します。
12.2.1.  Follow Along: 傾斜方位地図を作る
GRASSツール タブを開きます
grass_mapset マップセットから
g_demラスタレイヤを読み込みますr.aspect モジュールを モジュールリスト タブの フィルタ フィールドを使って探します
そのツールを開いて次のように設定し、 実行 ボタンをクリックします:
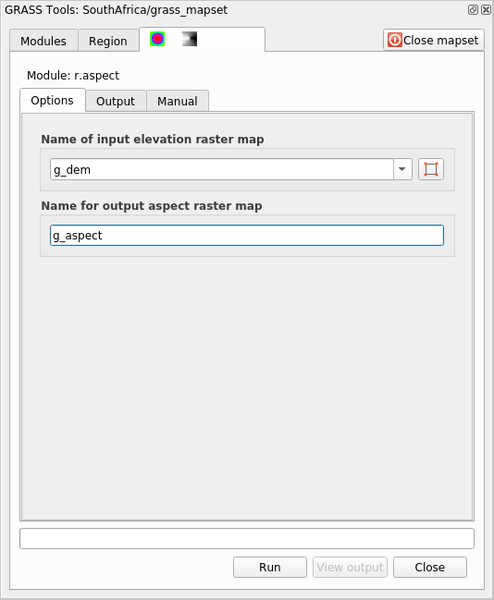
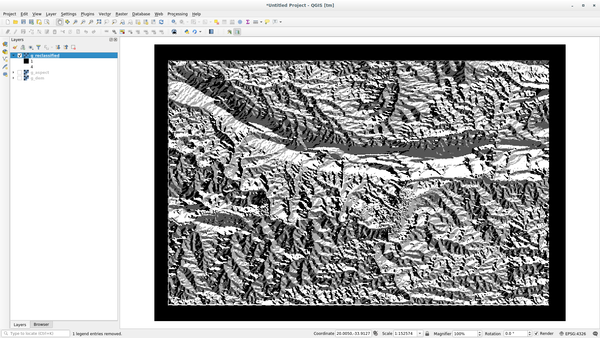
処理が終了したら 出力を見る をクリックし、結果のレイヤをキャンバスに読み込みます:
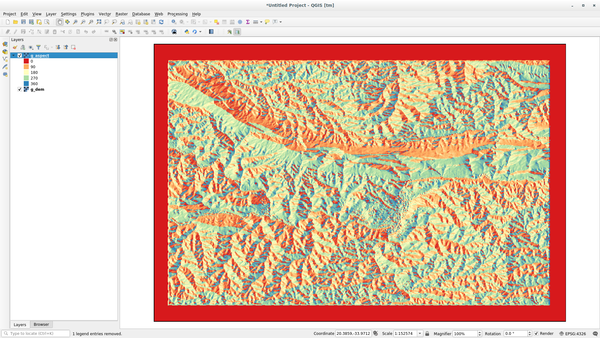
g_aspect レイヤは grass_mapset マップセット内に格納されているので、キャンバスからレイヤを削除してもいつでも再読み込みすることができます。
12.2.2. Follow Along: ラスタレイヤの基本的な統計情報を取得する
ラスタレイヤ g_dem の基本的な統計情報をいくつか知りたいと思います。
GRASSツール タブを開きます
grass_mapset マップセットから
g_demラスタレイヤを読み込みますモジュールリスト タブの フィルタ フィールドで r.info モジュールを検索してください
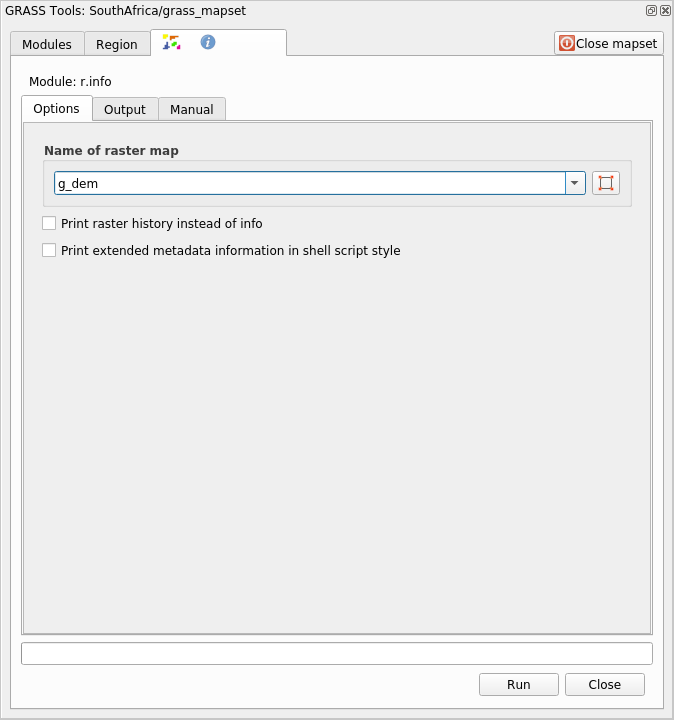
次のようにツールを設定し、実行 をクリックします:
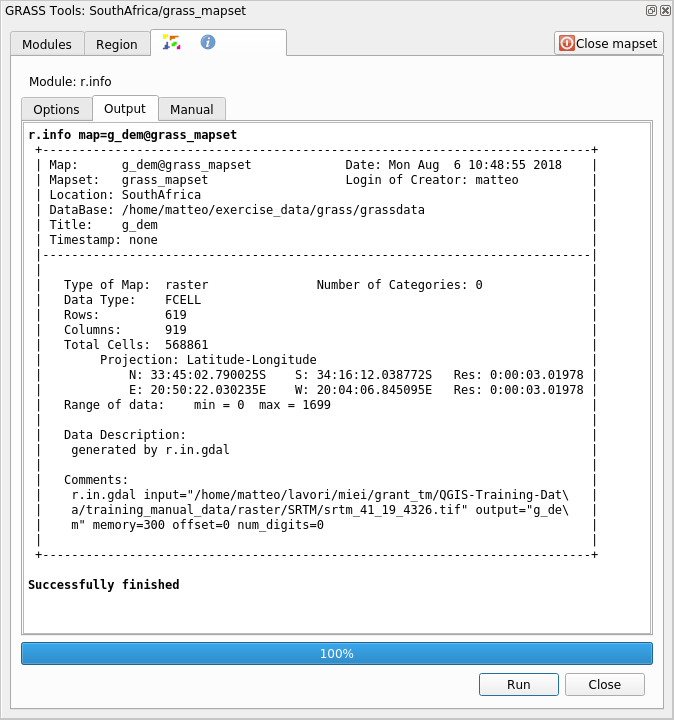
出力タブ内には、ファイルのパス、行数、列数など有用なラスタ情報が出力されているのがわかります。
12.2.3.  Follow Along: Reclass ツール
ラスタレイヤの再分類は非常に価値ある作業です。私たちは g_dem レイヤから g_aspect レイヤを作成したところです。その値域は0(北)から90(東)、180(南)、270(西)を経て、最後に360(再び北)までとなっています。 g_aspect レイヤを再分類して、具体的な 規則*(北 = 1, 東 = 2, 南 = 3, 西 = 4)に従って、4つの **カテゴリー* だけを持つようにすることができます。
Grass 再分類ツールは、定義された規則を含む txt ファイルを受け取ります。規則の書き方は非常に簡単で、GRASS マニュアルに非常に詳しい説明があります。
ちなみに
GRASSの各ツールには、それぞれ「マニュアル」タブがあります。使用するツールの説明をよく読んで、便利なパラメータを見逃さないようにしましょう。
g_aspectレイヤを読み込むか、作成していない場合は、 Follow Along: 傾斜方位地図を作る セクションに戻りましょう。r.reclass モジュールを モジュール タブの フィルタ フィールドで検索して探します
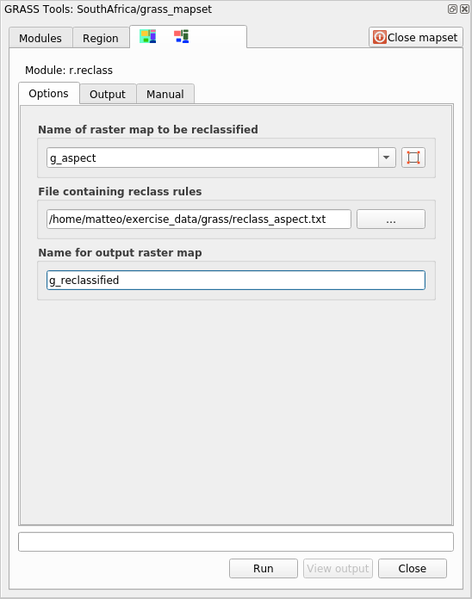
ツールを開き、次の図のように設定します。規則を含んでいるファイルは
exercise_data/grass/フォルダにreclass_aspect.txtという名前であります。実行 をクリックし、処理が終了するまで待ちます。
出力を見る をクリックすると、再分類されたラスタがキャンバスに読み込まれます
新しいレイヤは、4つの値(1、2、3、4)だけで構成され、管理も加工もしやすくなっています。
ちなみに
テキストエディタで reclass_aspect.txt を開き、規則を確認し、慣れることから始めてください。さらに、GRASS のマニュアルをよく読んでみてください:多くの異なる例が示されています。
12.2.4. Try Yourself 自分の規則で再分類する
Try to reclassify the g_dem layer into 3 new categories:
from 0 to 1000, new value = 1
from 1000 to 1400, new value = 2
from 1400 to the maximum raster value, new value = 3
答え
To discover the maximum value of the raster run the r.info tool: in the
console you will see that the maximum value is 1699.
You are now ready to write the rules.
Open a text editor and add the following rules:
0 thru 1000 = 1
1000 thru 1400 = 2
1400 thru 1699 = 3
Save the file as
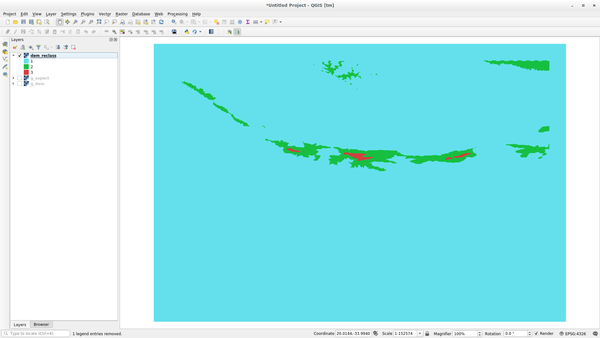
my_rules.txtfile and close the text editor.Run the
r.reclasstool: choose theg_demlayer and load the file containing the rules you just have saved.Click on Run and then on View Output. You can change the colors and the final result should look like the following picture:
12.2.5. Follow Along: Mapcalcツール
The Mapcalc tools is similar to the Raster Calculator of QGIS. You can perform mathematical operation on one or more raster layers and the final result will be a new layer with the calculated values.
The aim of the next exercise is to extract the values greater than 1000 from the
g_dem raster layer.
Look for the r.mapcalc module by searching for it in the Filter field of the Modules List tab.
ツールを起動します。
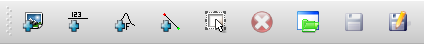
The Mapcalc dialog allows you to construct a sequence of analyses to be performed on a raster, or collection of rasters. You will use these tools to do so:
順番に:
Add map: Add a raster file from your current GRASS mapset.
Add constant value: Add a constant value to be used in functions, 1000 in this case
Add operator or function: Add an operator or function to be connected to inputs and outputs, we will use the operator
greater equals thanAdd connection: Connect elements. Using this tool, click and drag from the red dot on one item to the red dot on another item. Dots that are correctly connected to a connector line will turn gray. If the line or dot is red, it is not properly connected!
Select item: Select an item and move selected items.
Delete selected item: Removes the selected item from the current mapcalc sheet, but not from the mapset (if it is an existing raster)
Open: Open an existing file with the operation defined
Save: Save all the operation in a file
Save as: Save all the operations as a new file on the disk.
Using these tools, construct the following algorithm:
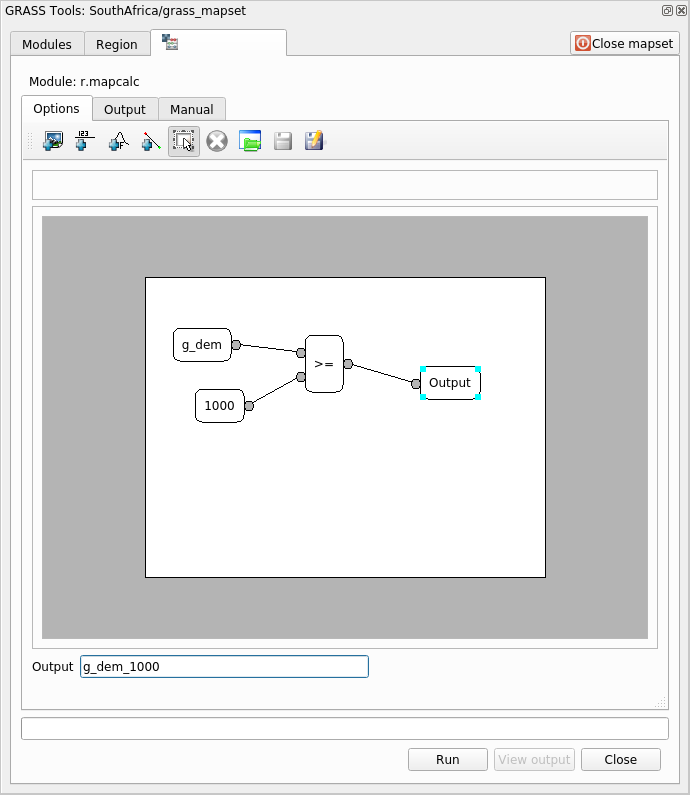
Click on Run and then on View output to see the output displayed in your map:
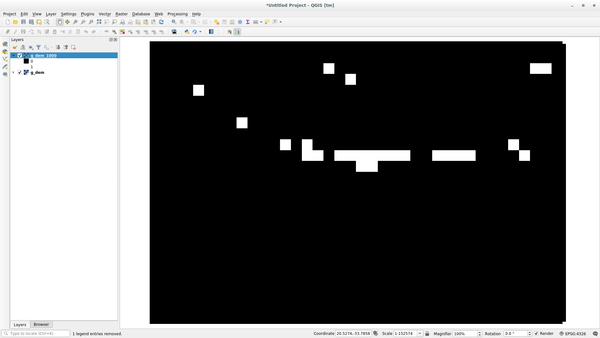
This shows all the areas where the terrain is higher than 1000 meters.
ちなみに
You can also save the formula you have created and load it in another QGIS project by clicking on the last button on the GRASS Mapcalc toolbar.
12.2.6. In Conclusion
このレッスンでは、GRASSが提供する多くのツールのうちのわずかしかカバーしていません。自分でGRASSの機能を探索するには GRASSツール ダイアログを開き、 モジュールリスト を下へスクロールします。より構造化されたアプローチがよければ モジュールツリー タブではツールが種類ごとに整理されています。