14.7. Lesson: 삼림 파라미터 계산
삼림 목록화 작업의 목표는 삼림 파라미터를 계측하는 것입니다. 지난 강의 예제에 이어서, 현장에서 수집한 목록 정보를 통해 먼저 삼림 전체의, 그 다음 이전에 디지털화한 수종경계의 파라미터를 계산할 것입니다.
이 강의의 목표: 전체 및 수종경계 수준의 삼림 파라미터를 계산하기.
14.7.1.  Follow Along: 목록화 결과 추가
현장 팀이 삼림에 나가 여러분이 제공한 정보를 바탕으로 모든 표본 조사구에서 삼림에 관한 정보를 수집했습니다.
Most often the information will be collected into paper forms in the field,
then typed to a spreadsheet. The sample plots information has been condensed
into a .csv file that can be easily open in QGIS.
Continue with the QGIS project from the lesson about designing the inventory,
you probably named it forest_inventory.qgs.
먼저 QGIS 프로젝트에 표본 조사구 측정값을 추가해봅시다.
메뉴에서 를 선택합니다.
Browse to the file
systematic_inventory_results.csvlocated inexercise_data/forestry/results/.Point coordinates 체크박스를 체크했는지 확인하십시오.
Set the fields for the coordinates to the X and Y fields.
OK 를 클릭하십시오.
When prompted, select ETRS89 / ETRS-TM35FIN as the CRS.
새 레이어의 Attribute table 을 열고 데이터를 살펴보십시오.
You can read the type of data that is contained in the sample plots measurements
in the text file legend_2012_inventorydata.txt located in the
exercise_data/forestry/results/ folder.
The systematic_inventory_results layer you just added is actually just
a virtual representation of the text information in the .csv file.
Before you continue, convert the inventory results to a real spatial dataset:
Right click on the
systematic_inventory_resultslayer.Browse to
exercise_data/forestry/results/folder.Name the file
sample_plots_results.shp.Add saved file to map 체크박스를 체크하십시오.
Remove the
systematic_inventory_resultslayer from your project.
14.7.2. Follow Along: 전체 삼림의 파라미터 계측
You can calculate the averages for this whole forest area from the inventory
results for the some interesting parameters, like the volume and the number
of stems per hectare. Since the systematic sample plots represent equal areas,
you can directly calculate the averages of the volumes and number of stems per
hectare from the sample_plots_results layer.
Basic statistics 도구를 통해 벡터 레이어가 담고 있는 항목의 평균값을 계산할 수 있죠.
Open .
Select
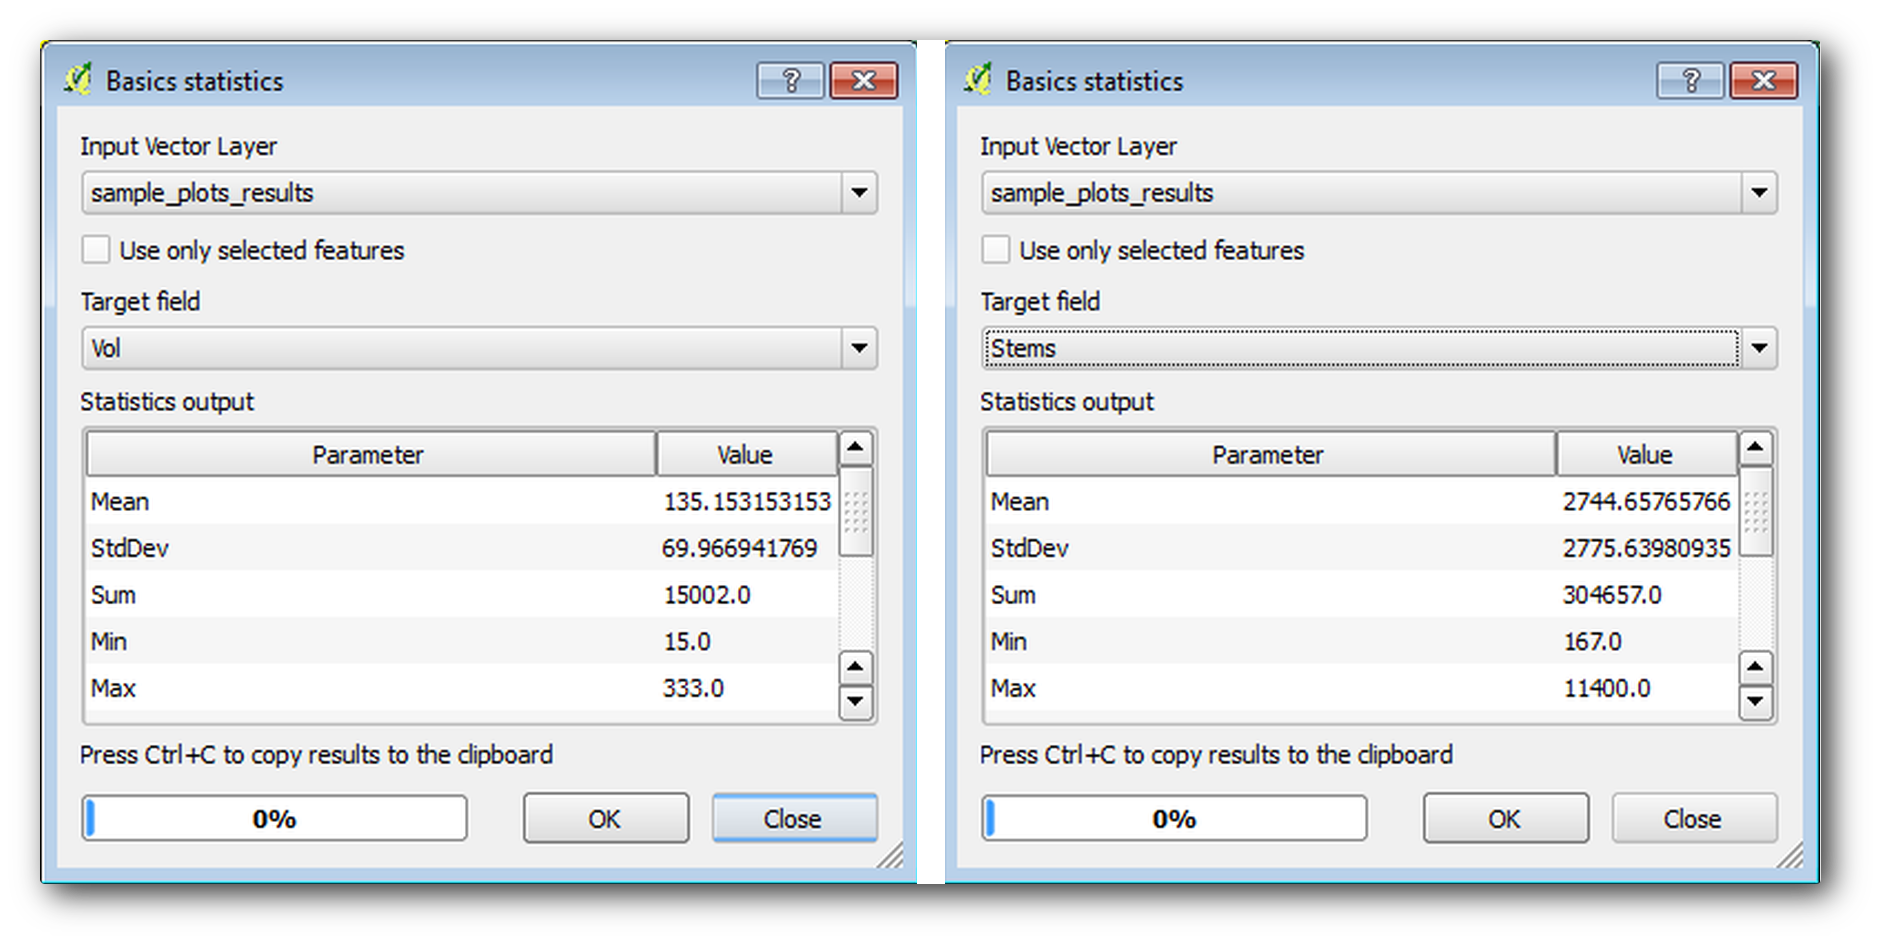
sample_plots_resultsas the Input Vector Layer.Select
Volas Target field.OK 를 클릭하십시오.
The average volume in the forest is 135.2 m3/ha.
You can calculate the average for the number of stems in the same way, 2745 stems/ha.
14.7.3. Follow Along: 수종경계의 파라미터 계측
이 체계적인 표본 조사구를 이용하면 여러분이 이전 강의에서 디지타이즈했던 각각의 수종경계의 계측값을 계산할 수 있습니다. 수종경계들 가운데 일부는 그 안에 위치한 표본 조사구가 없어 관련 정보를 얻을 수 없었습니다. 체계적인 목록화 작업을 계획했을 때 이를 위해 몇몇 추가 표본 조사구를 설계해서 현장 팀이 해당 추가 조사구를 측정하게 했을 수도 있습니다. 또는 나중에 현장 팀을 다시 보내 정보가 없는 수종경계를 조사하게 해서 수종경계 목록화 작업을 완성시킬 수도 있을 겁니다. 어쨌든, 계획된 표본 조사구만으로도 대부분의 수종경계에 대한 정보를 얻을 수 있습니다.
여러분이 해야 할 일은 각 수종경계 안에 위치한 표본 조사구들의 평균값을 구하는 것입니다. 상대적인 위치를 바탕으로 정보를 종합하고자 할 경우, 공간 결합(join) 작업을 수행해야 합니다.
메뉴에서 을 클릭하십시오.
Set
forest_stands_2012as the Target vector layer. The layer you want the results for.Set
sample_plots_resultsas the Join vector layer. The layer you want to calculate estimates from.Take summary of intersecting features 체크박스를 체크하십시오.
Mean 만 계산하도록 체크하십시오.
Name the result as
forest_stands_2012_results.shpand save it in theexercise_data/forestry/results/folder.마지막으로 Keep all records… 를 선택해서 어떤 수종경계가 정보를 얻지 못했는지 확인할 수 있도록 합니다.
OK 를 클릭하십시오.
대화 창이 뜨면 새 레이어를 프로젝트에 추가하도록 선택하십시오.
Join attributes by location 도구를 닫으십시오.
Open the Attribute table for forest_stands_2012_results
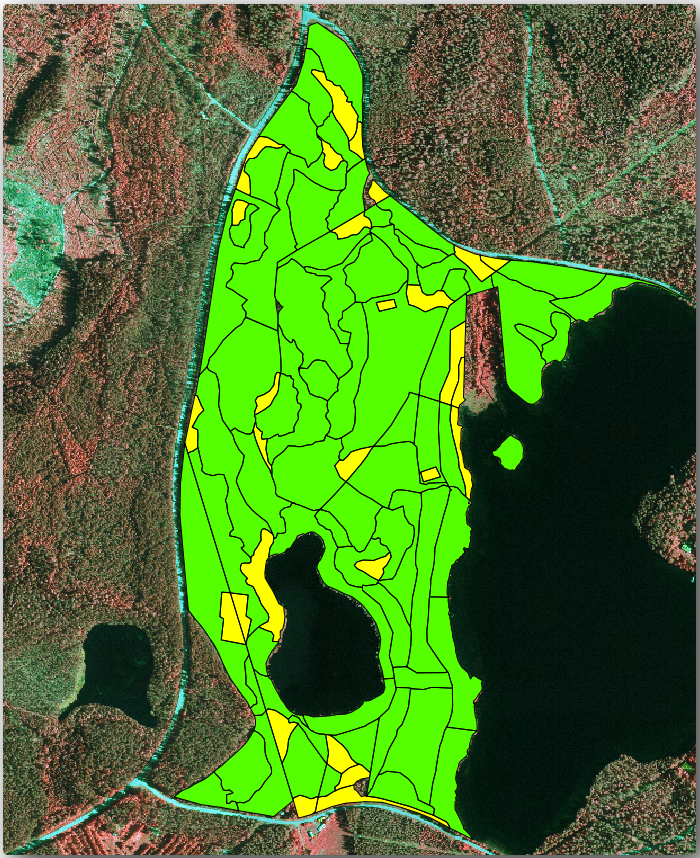
and review the results you got. Note that a number of forest stands have
NULL as the value for the calculations, those are the ones having no
sample plots. Select them all and view them in the map, they are some of the
smaller stands:
Lets calculate now the same averages for the whole forest as you did before,
only this time you will use the averages you got for the stands as the bases
for the calculation. Remember that in the previous situation, each sample plot
represented a theoretical stand of 80x80 m. Now you have to consider the
area of each of the stands individually instead. That way, again, the average
values of the parameters that are in, for example, m3/ha for the volumes are
converted to total volumes for the stands.
먼저 각 수종경계의 면적을 계산한 다음 각 수종경계의 전체 목재 부피와 수간 개수를 계산해야 합니다.
Attribute table 의 편집 모드를 활성화하십시오.
Field calculator 를 실행하십시오.
Create a new field called
area.Set the Output field type to
Decimal number (real).Set the Precision to
2.In the Expression box, write
$area / 10000. This will calculate the area of the forest stands in ha.OK 를 클릭하십시오.
이제 모든 수종경계에 대해 전체 목재 부피와 수간 개수의 계측값을 계산해봅시다.
Name the fields
s_volands_stem.이 항목들을 정수형으로 설정해도 되고, 실수형으로 설정해도 됩니다.
Use the expressions
"area" * "MEANVol"and"area" * "MEANStems"for total volumes and total stems respectively.입력을 완료하면 변경 사항을 저장하십시오.
편집 모드를 해제하십시오.
이전 단계에서 모든 표본 조사구의 면적은 동일했기 때문에 표본 조사구의 평균값을 계산하는 것만으로 충분했습니다. 이번 단계에서 계측값을 계산하기 위해서는, 수종경계의 목재 부피 또는 수간 개수의 합을 정보를 담고 있는 수종경계들의 면적의 합으로 나눠주어야 합니다.
In the Attribute table for the
forest_stands_2012_resultslayer, select all the stands containing information.Open .
Select the
forest_stands_2012_resultsas the Input layer.Select
areaas Field to calculate statistics on.Check the Selected features only
OK 를 클릭하십시오.
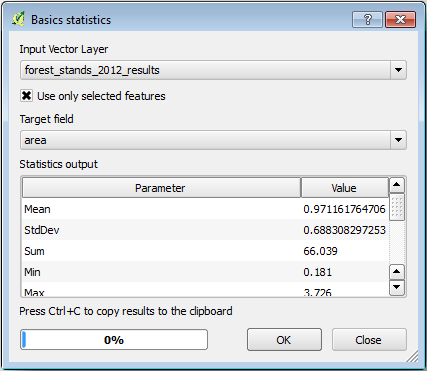
As you can see, the total sum of the stands’ areas is 66.04 ha.
Note that the area of the missing forest stands is only about 7 ha.
In the same way, you can calculate that the total volume for these stands is
8908 m3/ha and the total number of stems is 179594 stems.
표본 조사구의 정보를 그대로 이용하는 대신, 수종경계의 정보를 이용하면 다음 평균 계측값을 얻을 수 있습니다.
184.9 m3/haand2719 stems/ha.
Save your QGIS project, forest_inventory.qgs.
14.7.4. In Conclusion
여러분의 체계적인 표본 조사구의 정보를 통해, 먼저 삼림의 특성을 고려하지 않고 항공사진을 해석해 수종경계를 생성한 것을 이용하지 않은 채, 전체 삼림에 대한 계측값을 계산해보았습니다. 그리고 또 특정 수종경계에 대한 귀중한 정보도 얻었습니다. 향후 몇 년 간 이 정보를 사용해 삼림관리 계획을 수립할 수 있을 것입니다.
14.7.5. What’s Next?
다음 강의에서는, 먼저 LiDAR 데이터셋을 기반으로 음영기복도 배경을 생성한 다음 여러분이 방금 계산한 결과와 함께 사용해서 맵 프리젠테이션을 준비할 것입니다.