4.2. Lesson: ダイナミック印刷レイアウトを作成する
Now that you have learned to create a basic map layout we go a step further and create a map layout that adapts dynamically to our map extent and to the page properties, e.g. when you change the size of the page. Also, the date of creation will adapt dynamically.
4.2.1.  Follow Along: 動的地図キャンバスの作成
ESRI Shapefile形式のデータセット
protected_areas.shp、places.shp、rivers.shpおよびwater.shpを地図キャンバスにロードし、そのプロパティを自分の良いように修正します。After everything is rendered and symbolized to your liking, click the
 New Print Layout icon in the toolbar
or choose .
You will be prompted to choose a title for the new print layout.
New Print Layout icon in the toolbar
or choose .
You will be prompted to choose a title for the new print layout.ヘッダと南アフリカのスウェレンダム近くの地域の地図で構成される地図レイアウトを作成します。レイアウトのマージンは7.5 mmで、ヘッダの高さは36mmでなければなりません。
Create a map item called
main mapon the canvas and go to the Layout panel. Scroll down to the Variables section and find the Layout part. Here we set some variables you can use all over the dynamic print layout. Go to the Layout panel and scroll down to the Variables section. The first variable will define the margin. Press the button and type in the name
sw_layout_margin. Set the value to7.5. Press the button again and type in the name
sw_layout_height_header. Set the value to36.Now you are ready to create the position and the size of the map canvas automatically by means of the variables. Make sure that your map item is selected, go to the Item Properties panel, scroll down to and open the Position and Size section. Click the
 Data defined override for
X and from the Variables entry, choose
Data defined override for
X and from the Variables entry, choose
@sw_layout_margin.Click the
Data defined override
for Y, choose Edit... and type in the
formula:to_real(@sw_layout_margin) + to_real(@sw_layout_height_header)
You can create the size of the map item by using the variables for Width and Height. Click the
Data defined override
for Width and choose Edit ... again.
Fill in the formula:@layout_pagewidth - @sw_layout_margin * 2
Click the
Data defined override
for Height and choose Edit ....
Here fill in the formula:@layout_pageheight - @sw_layout_height_header - @sw_layout_margin * 2
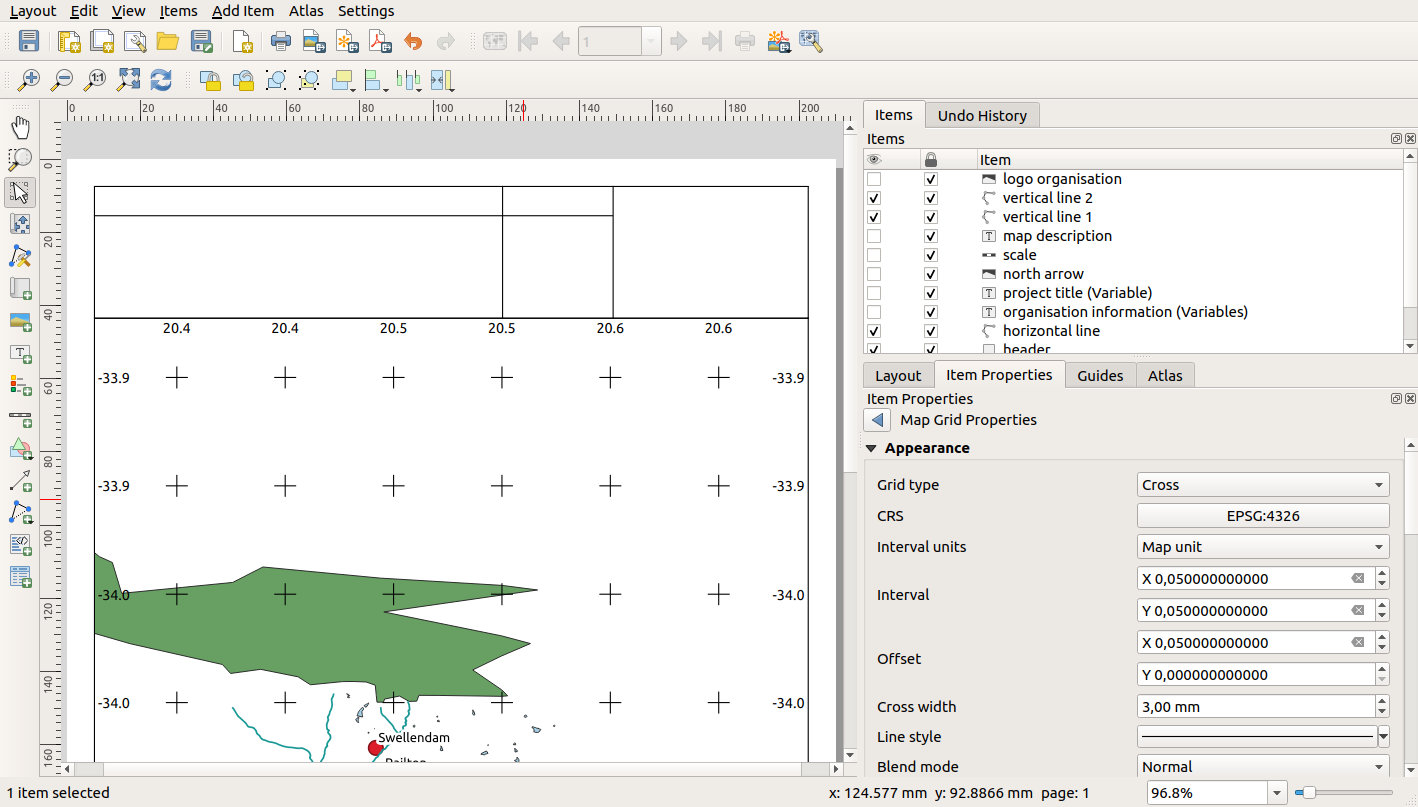
We will also create a grid containing the coordinates of the main canvas map extent. Go to Item Properties again and choose the Grids section. Insert a grid by clicking the
button.
Click on Modify grid ... and set the
Interval for X, Y and
Offset according to the map scale you chose in the
QGIS main canvas.
The Grid type Cross is very well suited
for our purposes.
4.2.2. Follow Along: 動的ヘッダを作成する
 図形追加 ボタンでヘッダを含む長方形を挿入します。 アイテム パネルに
 headerという名前を入力します。Again, go to the Item Properties and open the Position and Size section. Using
Data defined override,
choose the sw_layout_marginvariable for X as well as for Y. Width shall be defined by the expression:@layout_pagewidth - @sw_layout_margin * 2
and Height by the
sw_layout_height_headervariable.We will insert a horizontal line and two vertical lines to divide the header into different sections using the
 Add Node Item.
Create a horizontal line and two vertical lines and name them
Add Node Item.
Create a horizontal line and two vertical lines and name them
Horizontal line,Vertical line 1Vertical line 2.For the horizontal line:
Set X to the variable
sw_layout_marginSet the expression for Y to:
@sw_layout_margin + 8
Set the expression for Width to:
@layout_pagewidth - @sw_layout_margin * 3 - 53.5
For the first vertical line:
Set the expression for X to:
@layout_pagewidth - @sw_layout_margin * 2 - 53.5
Set Y to the variable
sw_layout_marginThe height must be the same as the header we created, so set Height to the variable
sw_layout_height_header.
The second vertical line is placed to the left of the first one.
Set the expression for X to:
@layout_pagewidth - @sw_layout_margin * 2 - 83.5
Set Y to the variable
sw_layout_marginThe height shall be the same as the other vertical line, so set Height to the variable
sw_layout_height_header.
以下の図は、動的レイアウトの構造を示しています。線によって作成された領域をいくつかの要素で埋めます。
4.2.3. Follow Along: 動的ヘッダのラベルを作成する
The title of your QGIS project can be included automatically. The title is set in the Project Properties. Insert a label with the
 Add Label button and
enter the name
Add Label button and
enter the name project title (variable). In the Main Properties of the Items Properties Panel enter the expression:[%@project_title%]
Set the position of the label.
For X, use the expression:
@sw_layout_margin + 3
For Y, use the expression:
@sw_layout_margin + 0.25
For Width, use the expression:
@layout_pagewidth - @sw_layout_margin *2 - 90
Enter
11.25for Height
Under Appearance set the Font size to 16 pt.
The second label will include a description of the map you created. Again, insert a label and name it
map description. In the Main Properties enter the textmap description. In the Main Properties we will also include:printed on: [%format_date(now(),'dd.MM.yyyy')%]
Here we used two
Date and Timefunctions (nowandformat_date).Set the position of the label.
For X, use the expression:
@sw_layout_margin + 3
For Y, use the expression:
@sw_layout_margin + 11.5
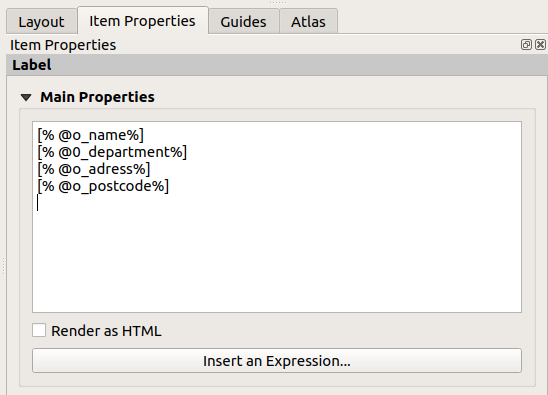
The third label will include information about your organisation. First we will create some variables in the Variables menu of the Item Properties. Go to the Layout menu, click the
button
each time and enter the names o_department,o_name,o_adressando_postcode. In the second row enter the information about your organisation. We will use these variables in the Main Properties section.In Main Properties enter:
[% @o_name %]
[% @o_department %]
[% @o_adress %]
[% @o_postcode %]
Set the position of the label.
For X, use the expression:
@layout_pagewidth - @sw_layout_margin - 49.5
For Y, use the expression:
@sw_layout_margin + 15.5
For Width, use
49.00For Height, use the expression:
@sw_layout_height_header - 15.5
4.2.4. Follow Along: 動的ヘッダに画像を追加する
Use the
 Add Picture button to place a picture
above your label
Add Picture button to place a picture
above your label organisation information. After entering the nameorganisation logodefine the position and size of the logo:For X, use the expression:
@layout_pagewidth - @sw_layout_margin - 49.5
For Y, use the expression:
@sw_layout_margin + 3.5
For Width, use
39.292For Height, use
9.583
To include a logo of your organisation you have to save your logo under your home directory and enter the path under .
Our layout still needs a north arrow. This will also be inserted by using
 Add North Arrow.
We will use the default north arrow.
Define the position:
Add North Arrow.
We will use the default north arrow.
Define the position:For X, use the expression:
@layout_pagewidth - @sw_layout_margin * 2 - 78
For Y, use the expression:
@sw_layout_margin + 9
For Width, use
21.027For Height, use
21.157
4.2.5. Follow Along: 動的ヘッダのスケールバーを作成する
To insert a scalebar in the header click on
 Add Scale Bar and place it in the rectangle
above the north arrow.
In Map under the Main Properties choose
your
Add Scale Bar and place it in the rectangle
above the north arrow.
In Map under the Main Properties choose
your main map(Map 1). This means that the scale changes automatically according to the extent you choose in the QGIS main canvas. Choose the Style Numeric. This means that we insert a simple scale without a scalebar. The scale still needs a position and size.For X, use the expression:
@layout_pagewidth - @sw_layout_margin * 2 - 78
For Y, use the expression:
@sw_layout_margin + 1
For Width, use
25For Height, use
8Place the
Reference pointin the center.
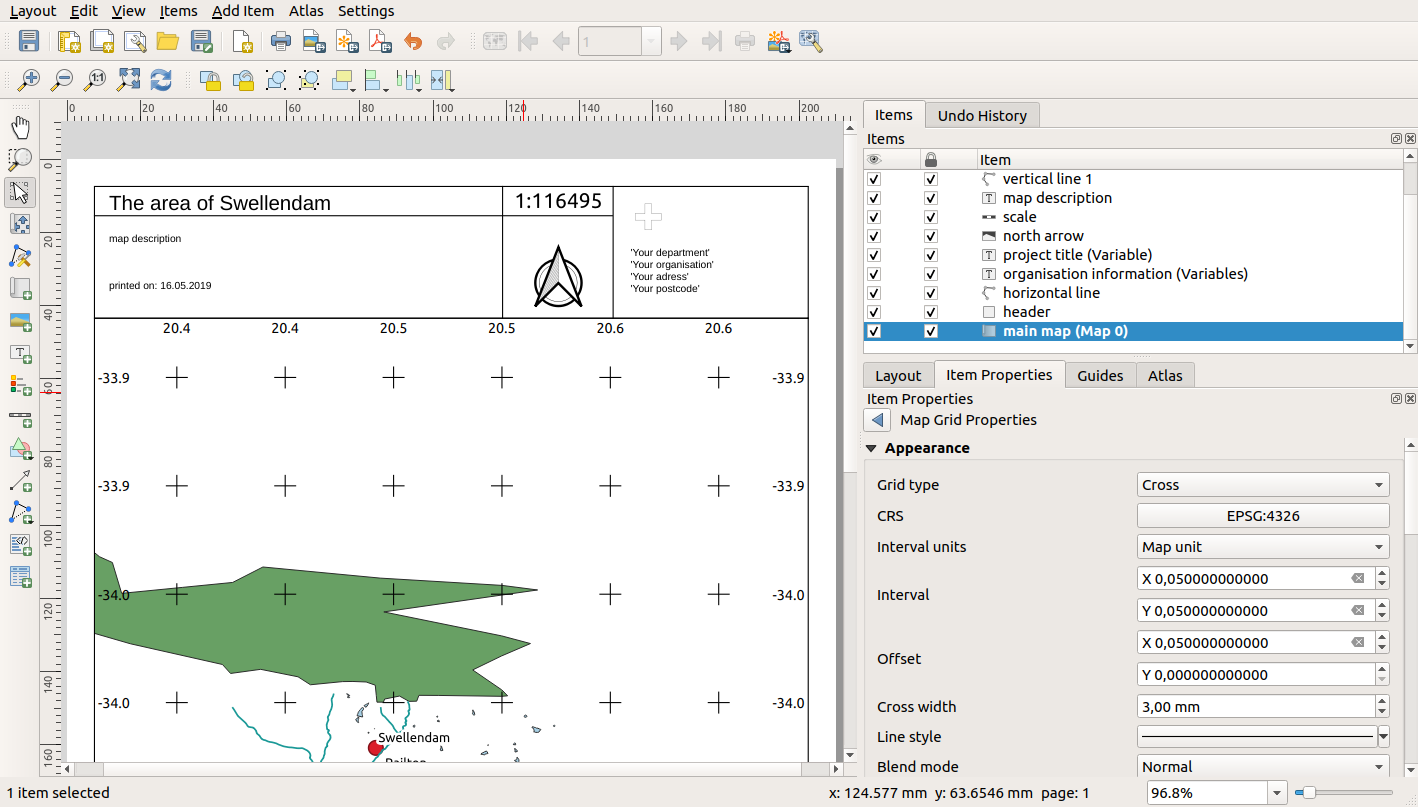
Congratulations! You have created your first dynamic map layout.
Take a look at the layout and check if everything looks the way you
want it!
The dynamic map layout reacts automatically when you change the
page properties.
For example, if you change the page size from DIN A4 to DIN A3, click
the  Refresh view button and the page design is
adapted.
Refresh view button and the page design is
adapted.
4.2.6. What's Next?
次のページでは、完成すべき課題が与えられます。これによって、これまでに学んだテクニックを実践できます。