17.4. Creating a Report
This section will help you set up a report in QGIS.
17.4.1. What is it?
By definition, a GIS report is a document containing information organized in a narrative way, containing maps, text, graphics, tables, etc. A report can be prepared ad hoc, periodic, recurring, regular, or as required. Reports may refer to specific periods, events, occurrences, subjects or locations.
In QGIS, a Report is an extension of a Layouts.
Reports allow users to output their GIS projects in a simple, quick and structured way.
A report can be created with or inside the .
Note
The maps in QGIS reports behave in the same way as maps in print layouts and atlases. We will concentrate on the specifics of QGIS reports. For details on map handling, see the sections on print layouts and atlases.
17.4.2. Get started
In the Layout Manager dialog a report can be created through New from template by selecting the dropdown option Empty Report and hitting the Create… button.
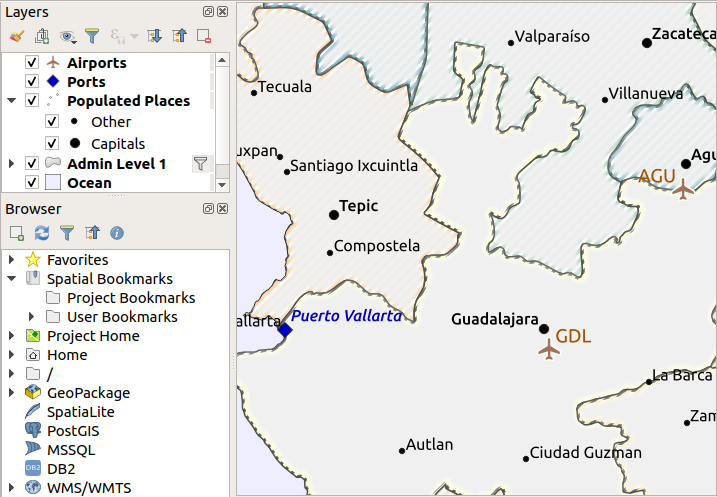
For this example, we use some administrative boundaries, populated places, ports and airports from the Natural Earth dataset (1:10M).
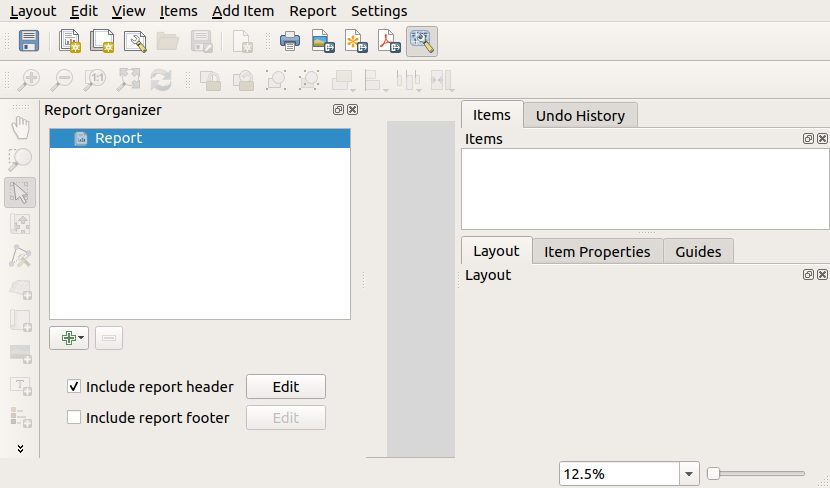
Using the command, we create a blank report. Initially, there is not much to look at – the dialog which is displayed looks much like the print layout designer, except for the Report Organizer panel to the left:
17.4.3. Layout Report Workspace
QGIS reports can consist of multiple, nested sections. In our new blank report we initially only have the main report section. The only options for this report section is Include report header and Include report footer. If we enable these options, a header will be included as the first page(s) (individual parts of reports can be multi-page if desired) in the report, and a footer will constitute the last page(s). Enable the header (Include report header), and hit the Edit button next to it:
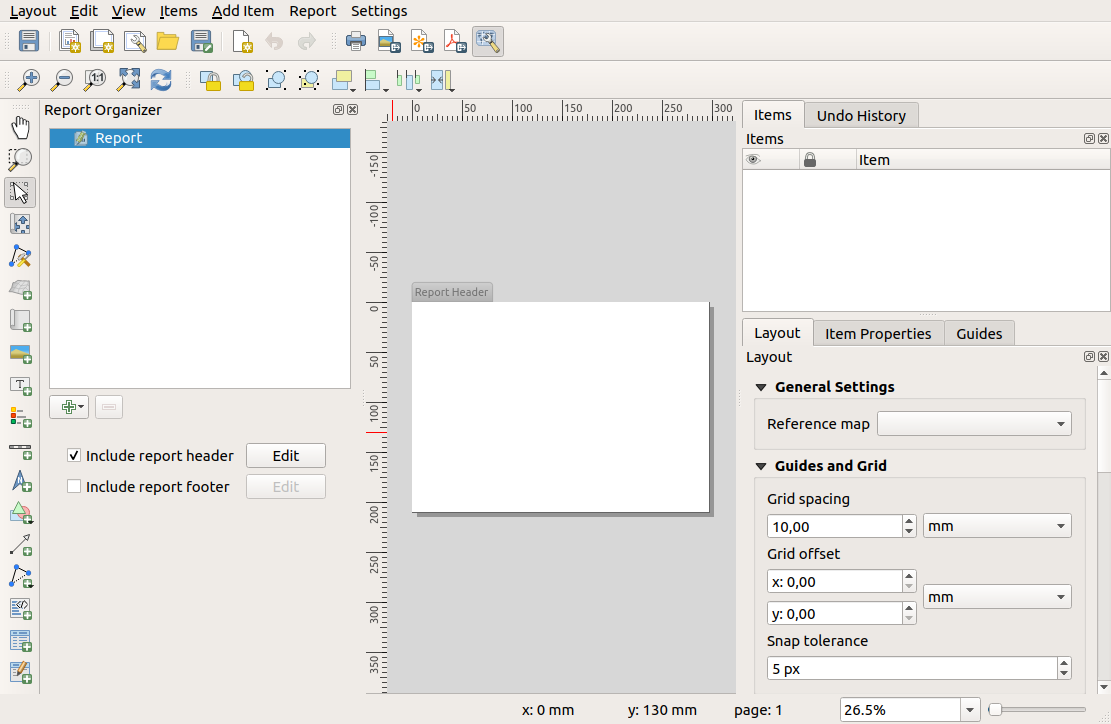
A few things happen as a result. Firstly, an edit pencil is shown next to Report in the Report Organizer, indicating that the report section is currently being edited in the designer. We also see a new page with a small Report Header title. The page has landscape orientation by default, but this (and other properties of the page) can be changed by right-clicking on the page and choosing . This will bring up the Item properties tab for the page, and page Size, Width, Height, and more can be specified.
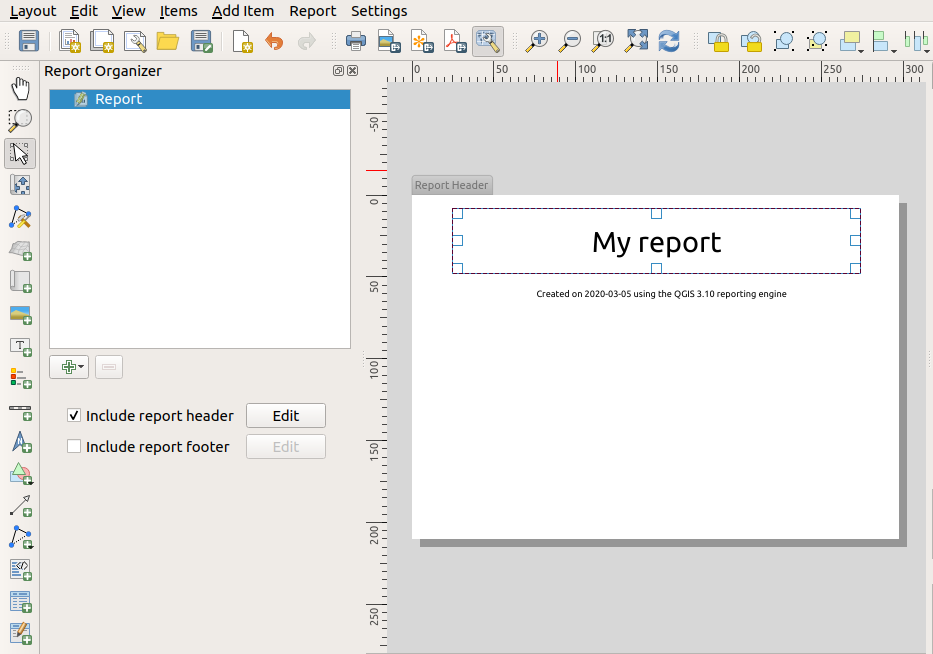
In QGIS reports, every component of the report is made up of individual layouts. They can be created and modified using the same tools as for standard print layouts – so you can use any desired combination of labels, pictures, maps, tables, etc. Let us add some items to our report header to demonstrate:
We will also create a simple footer for the report by checking the Include report footer option and hitting Edit.
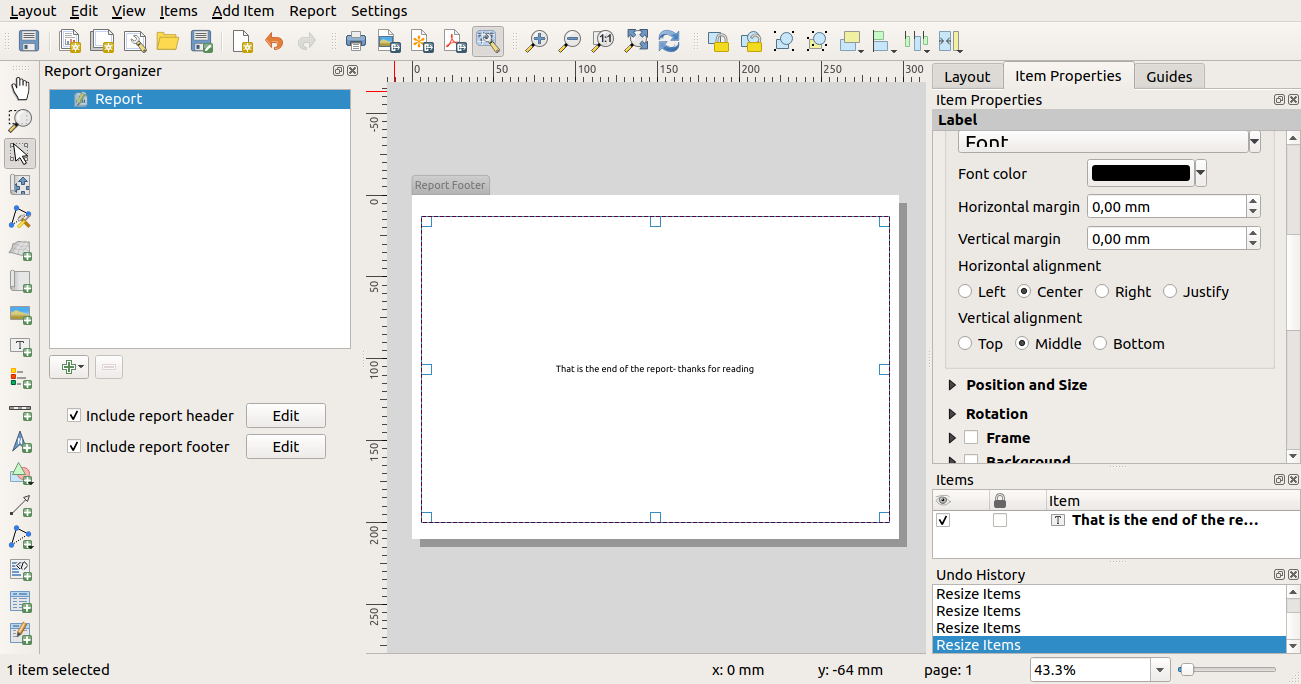
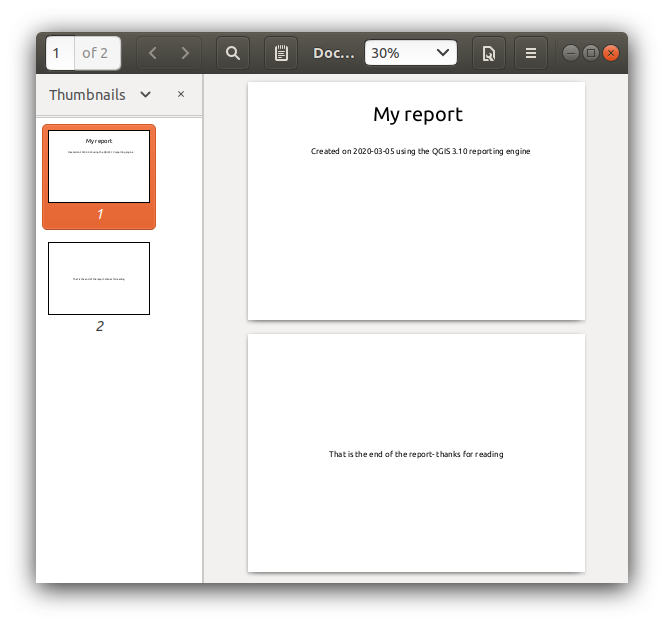
Before proceeding further, let us export this report and see what we get. Exporting is done from the menu – in this case we select to render the whole report to a PDF file. Here is the not-very-impressive result – a two page PDF consisting of our header and footer:
Let us make things more interesting.
By hitting the  Add Section button in the
Report Organizer, we are given a choice of new sections to
add to our report.
Add Section button in the
Report Organizer, we are given a choice of new sections to
add to our report.
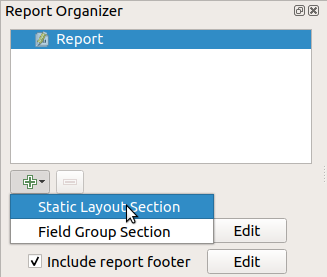
There are two options: Static Layout Section and Field Group Section.
The Add Static Layout Section is a single, static body layout. This can be used to embed static layouts mid-way through a report.
The Field Group Section repeats its body layout for every feature of a layer. The features are sorted by the selected grouping feature (with an option for ascending/descending sort). If a field group section has child sections (e.g. another field group section with a different field), then only features with unique values for the group feature are iterated over. This allows nested reports.
For now we will add a Field Group Section to our report. At its most basic level, you can think of a Field Group Section as the equivalent of a print atlas: you select a layer to iterate over, and the report will insert a section for each feature found. Selecting the new Field Group Section reveals a number of new related settings:
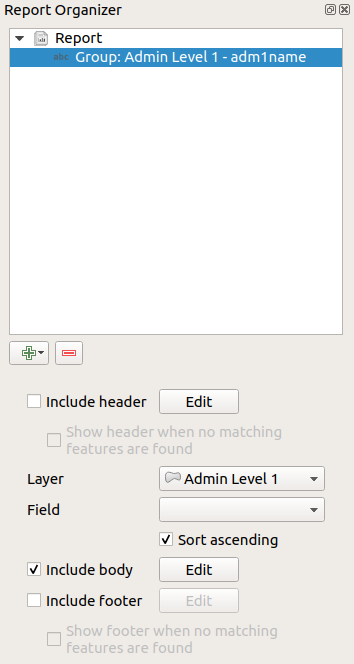
In this case we’ve setup our Field Group so that we iterate over all the states from the Admin Level 1 layer, using the values from the adm1name field. The same options to include header and footer are present, together with a new option to include a body for this section. We’ll do that, and edit the body:
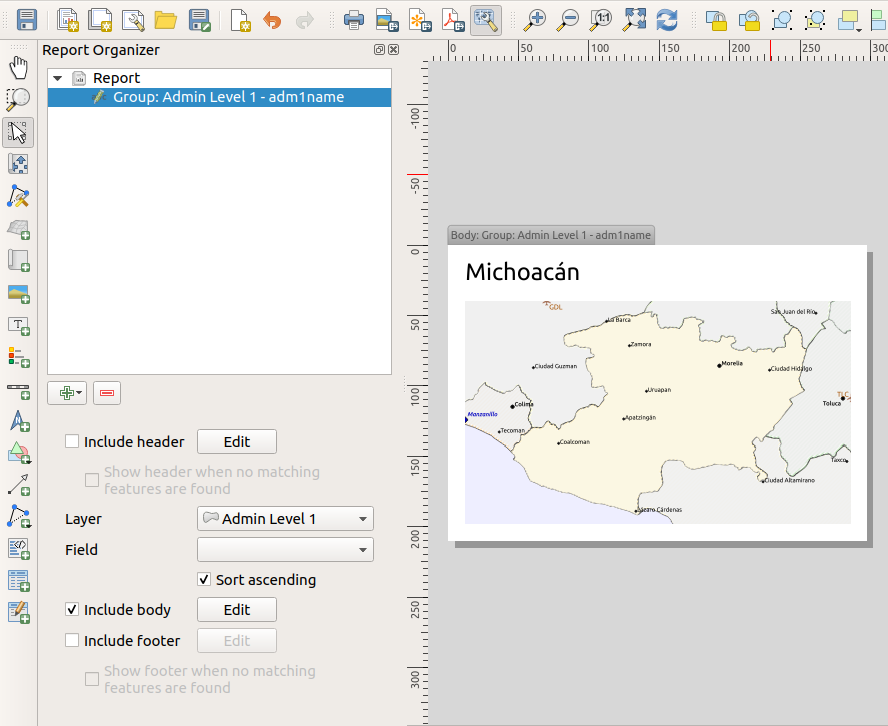
Our body now consists of a map and a label showing the name of the state. To include the name of the state, we selected and data defined the text under Main Properties with the help of Insert an Expression….
The result was the following expression (name is the name of the attribute in the Admin Level 1 layer that contains the name of the state):
[% "name" %]
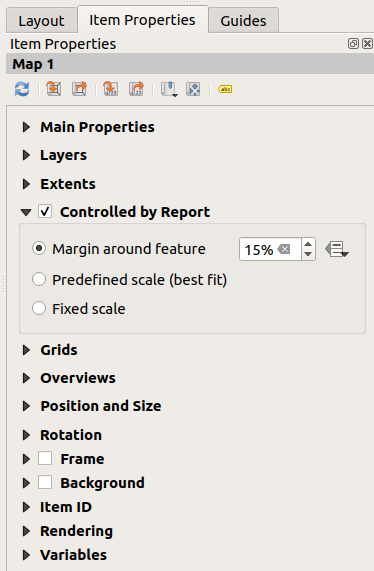
The map is set to follow the current report feature (enabled by checking Controlled by Report – just like a map item in an atlas will follow the current atlas feature when Controlled by Atlas is checked):
If we went ahead and exported our report now, we’d get something like this:
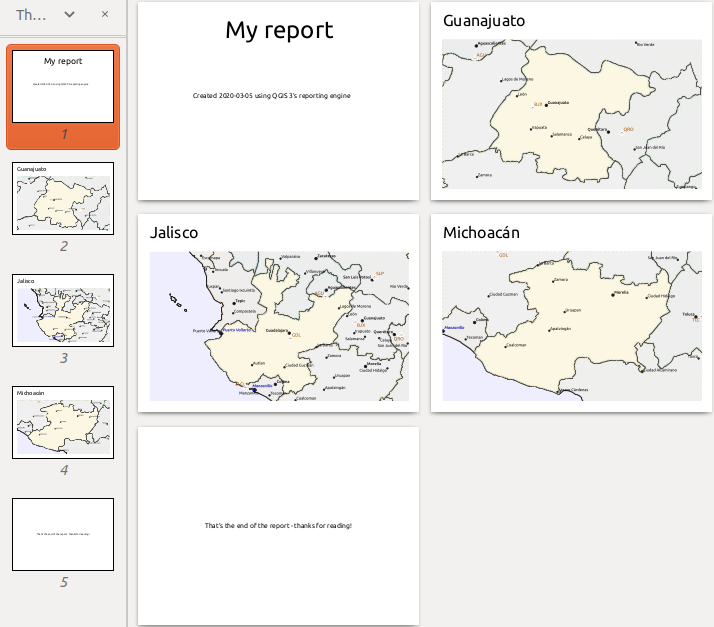
Fig. 17.62 The report header, a page for each state, and the report footer.
So more or less an atlas, but with a header and footer page.
Let us make things more interesting by adding a subsection to our
state group.
We do this by first selecting the Admin Level 1 field group in the
organizer, then hitting the Add Field button
and adding a new Field Group Section:
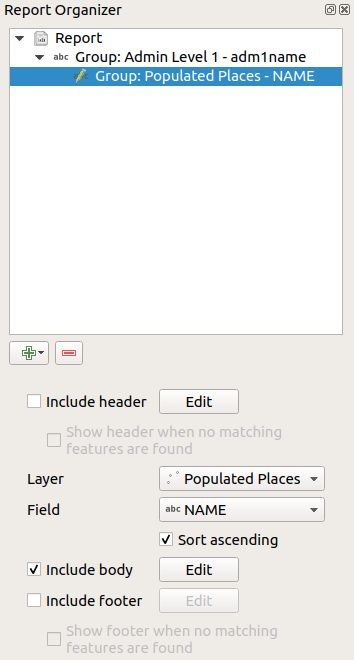
When iterating over the features of a Field Group Section,
the features will be filtered to match the defining field of its parent
group (adm1name in this case).
Here, the subsection we added will iterate over a
Populated Places layer, including a body section for each
place encountered.
The magic here is that the Populated Places layer has an
attribute with the same name as the defining field in the parent layer,
adm1name, tagging each place with the state it is contained
within (if you’re lucky your data will already be structured like this
– if not, run the
Join Attributes by Location
Processing algorithm and create your own field).
When we export this report, QGIS will grab the first state from the
Admin Level 1 layer, and then iterate over all the
Populated Places with a matching adm1name value.
Here’s what we get:
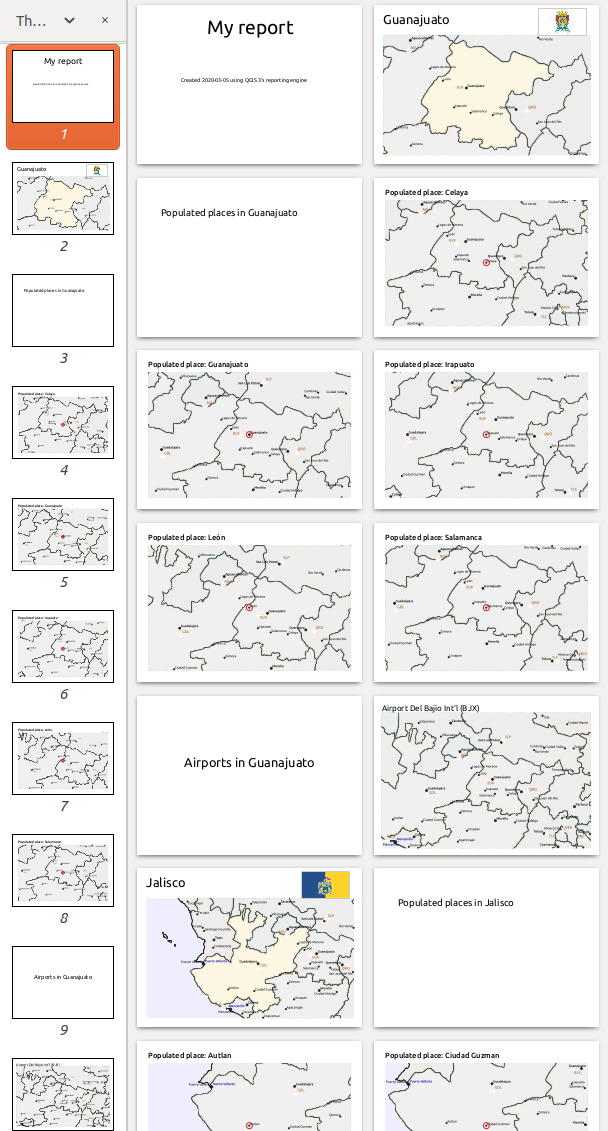
Here we created a basic body for the Populated Places group, including a map of the place and a table of some place attributes. So our report is now a report header, a page for the first state, followed by a page for every populated place within that state, then the rest of the states with their populated places, and finally the report footer. If we were to add a header for the Populated Places group, it would be included just before listing the populated places for each state, as shown in the illustration below.
Similarly, a footer for the Populated Places group would be inserted after the final place for each state is included.
In addition to nested subsections, subsections in a report can also be included consecutively. If we add a second subsection to the Admin Level 1 group for Airports, then (if the Airports layer has an attribute adm1name that can link it to the parent group) our report will first list ALL the populated places for each state, followed by all the airports within that state, before proceeding to the next state.
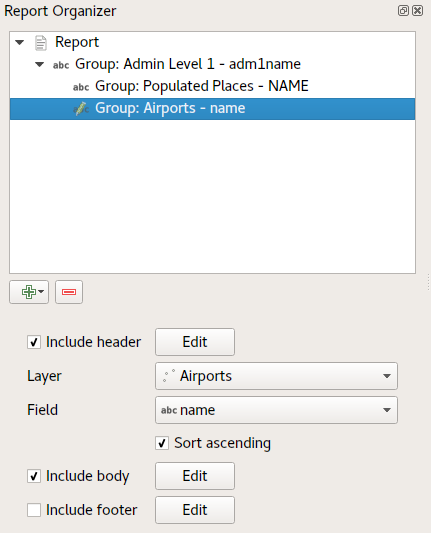
The key point here is that our Airports group is a subsection of the Admin Level 1 group – not the Populated Places group.
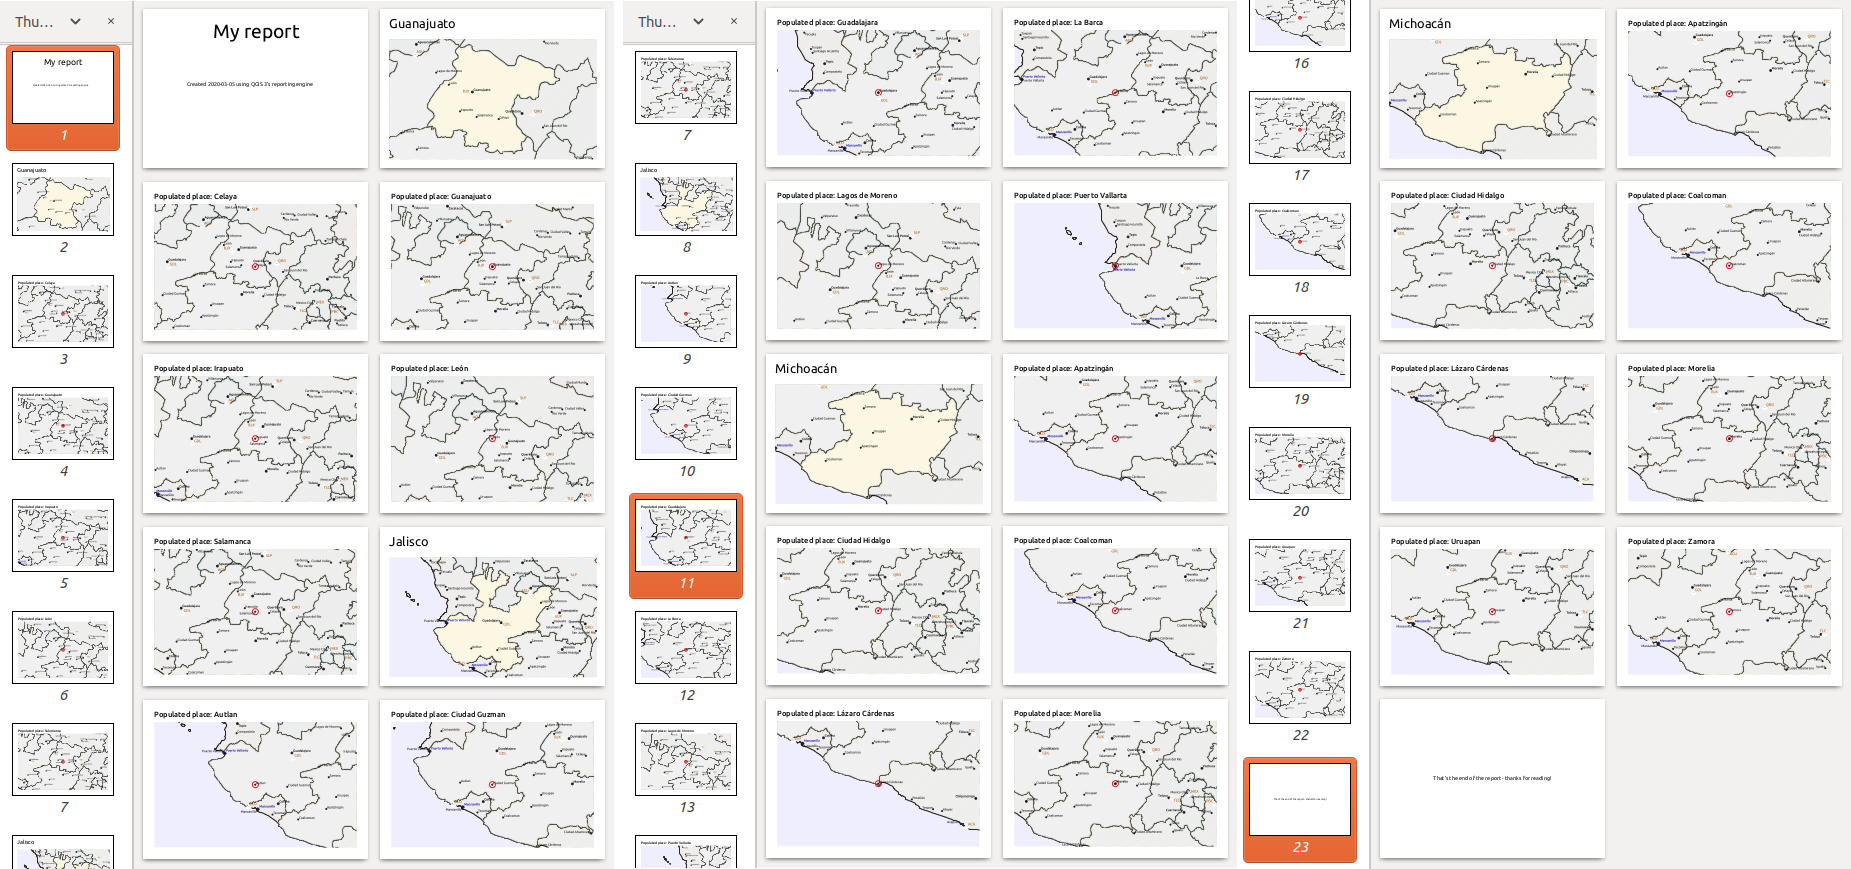
In this case our report would be structured like this (note that state flags have also been included - the procedure for adding feature specific pictures in this way is described below):
17.4.3.1. Including pictures in a report
Pictures can be quite useful in reports, and QGIS allows pictures in both the static and dynamic parts of a report. Pictures are added in the same way as for standard print layouts, and for the static report parts (and static pictures in dynamic parts) there is not more to it.
But if you want illustrations that are tailored to the report features, your layer must have an attribute that can be used to define the picture to include.
QGIS depends on absolute file names for images in reports.
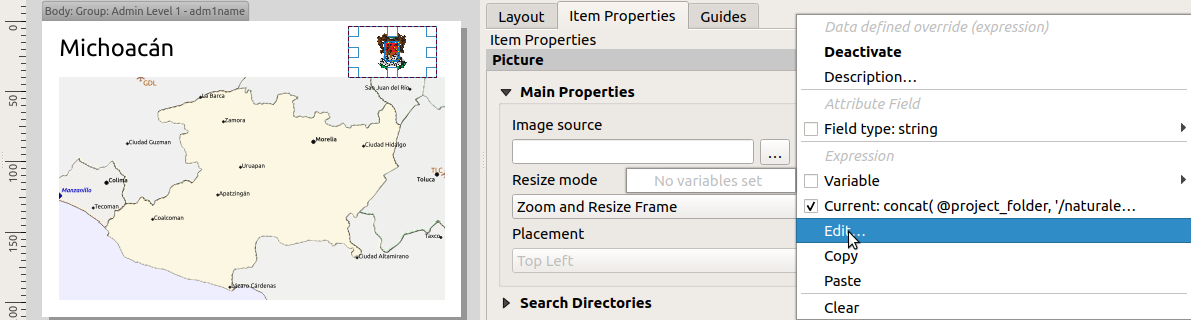
For dynamic pictures, you first add a picture to the body part
of the group, as usual.
In the Item properties of the picture, you set the
Image Source using the
 Data defined override button, and either
select an attribute that contains the absolute path of the
images or Edit… (to enter an expression that
generates the absolute image path).
Data defined override button, and either
select an attribute that contains the absolute path of the
images or Edit… (to enter an expression that
generates the absolute image path).
Below is an example expression that uses string concatenation to
specify the absolute path to the pictures, using the directory
where the project file is located @project_path) and an
attribute (adm1name) from which the file name is generated
(in this case by transforming the string in the adm1name
attribute to uppercase, and appending ‘_flag.png’):
concat(@project_folder, '/naturalearth/pictures/' ,
       upper("adm1name"), '_flag.png')
This means that the pictures are located in the
naturalearth/pictures subdirectory of the project file directory.
17.4.3.2. Highlighting the current report feature in a map
In the above report, the report features are emphasized in the
maps using highlighting (state) and circles (populated places).
To emphasize the report features in the maps (apart from placing
them at the centre of the maps), you must data define the style using
a comparison between its @id and the @atlas_featureid, as
for atlases.
For instance, if you would like to use a thicker line / border for the report feature than the other features you can data define the line width:
if($id=@atlas_featureid, 2.0, 0.1)
The report feature will get a 2 units wide polygon outline, while all other features will get a 0.1 units wide line. It is also possible to data define the colour (non-transparent dark magenta for the report feature and semi-transparent light gray for the other features):
if($id=@atlas_featureid, '#FF880088', '#88CCCCCC')
17.4.3.3. More level 1 groups
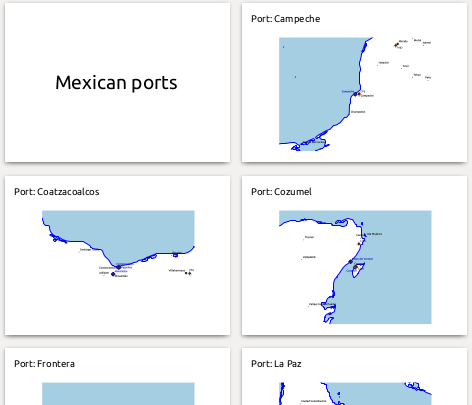
Combining nested and consecutive sections, together with section headers and footers allows for tons of flexibility. For instance, in the below report we add another field group as a child of the main report for the :guilabel`Ports` layer. Now, after listing the states together with their populated places and airports, we’ll get a summary list of all the ports in the region:
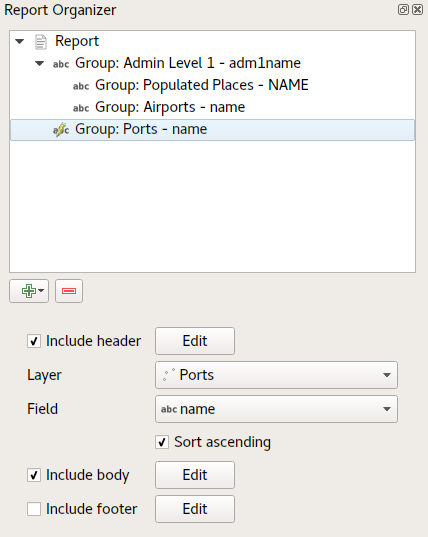
This results in the last part of our report exporting as:
17.4.4. Export settings
When you export a report (), you will be asked for a file name, and then you get the opportunity to tune the export settings to get the most appropriate output.
As you see, reports in QGIS are extremely powerful and flexible!
Note
The current information was adapted from a North Road blog, Exploring Reports in QGIS 3.0 - the Ultimate Guide!