중요
번역은 여러분이 참여할 수 있는 커뮤니티 활동입니다. 이 페이지는 현재 59.26% 번역되었습니다.
17.5. 더 많은 알고리즘과 데이터 유형
참고
이 수업에서는 알고리즘 3개를 더 실행해보면서 다른 입력 유형을 사용하는 방법과 지정한 폴더에 출력물을 자동으로 저장하도록 환경설정하는 방법을 배워보겠습니다.
이 수업에는 테이블과 폴리곤 레이어가 필요합니다. 테이블에 저장된 좌표를 기반으로 포인트 레이어를 생성한 다음, 각 폴리곤 내부에 위치하는 포인트의 개수를 알아낼 것입니다. 이번 수업에 해당하는 QGIS 프로젝트를 열면, X와 Y 좌표를 담고 있는 테이블을 찾을 수 있지만 폴리곤 레이어를 찾을 수는 없을 겁니다. 걱정하지 마십시오. 공간 처리 알고리즘을 통해 폴리곤 레이어를 생성할 것입니다.
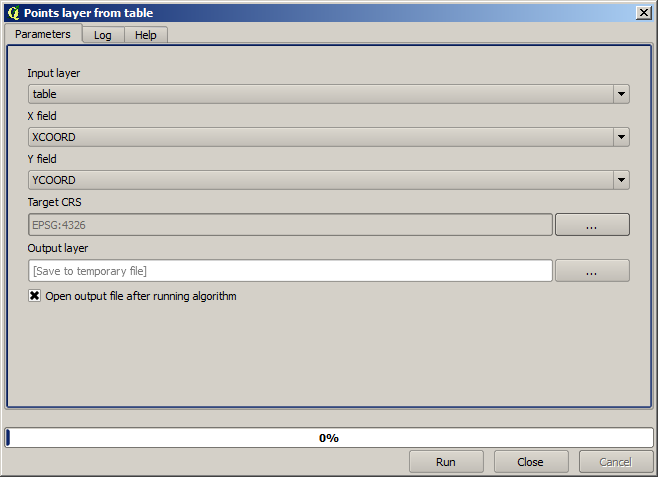
The first thing we are going to do is to create a points layer from the coordinates in the table, using the Create points layer from table algorithm. You now know how to use the search box, so it should not be hard for you to find it. Double-click on it to run it and get to its following dialog.
이전 수업에서와 마찬가지로 이 알고리즘은 산출물 하나를 생성하는데, 입력 파라미터는 3개입니다.
Table : 좌표를 저장하고 있는 테이블입니다. 여기에 수업 데이터에서 찾은 테이블을 선택해야 합니다.
X and Y fields: these two parameters are linked to the first one. The corresponding selector will show the name of those fields that are available in the selected table. Select the
XCOORDfield for the X parameter, and theYCOORDfield for the Y parameter.CRS : 이 알고리즘은 레이어를 입력받지 않으므로, 입력 레이어를 따라 산출 레이어에 좌표계를 할당할 수 없습니다. 그 대신, 사용자가 테이블의 좌표가 사용하는 좌표계를 직접 선택하도록 합니다. 오른쪽 버튼을 클릭해서 QGIS CRS 선택기를 열고, 산출물 좌표계로 EPSG:4326 을 선택하십시오. 이 좌표계가 테이블에 저장된 좌표의 좌표계이기 때문에 해당 좌표계를 선택하는 것입니다.
대화창이 다음과 같이 보여야 합니다.
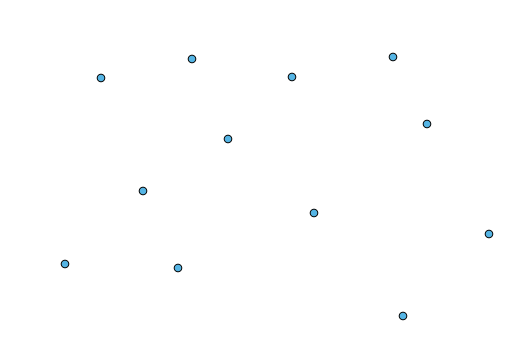
Now press the Run button to get the following layer (you may need to zoom full to reenter the map around the newly created points):
The next thing we need is the polygon layer. We are going to create a regular grid of polygons using the Create grid algorithm, which has the following parameters dialog.
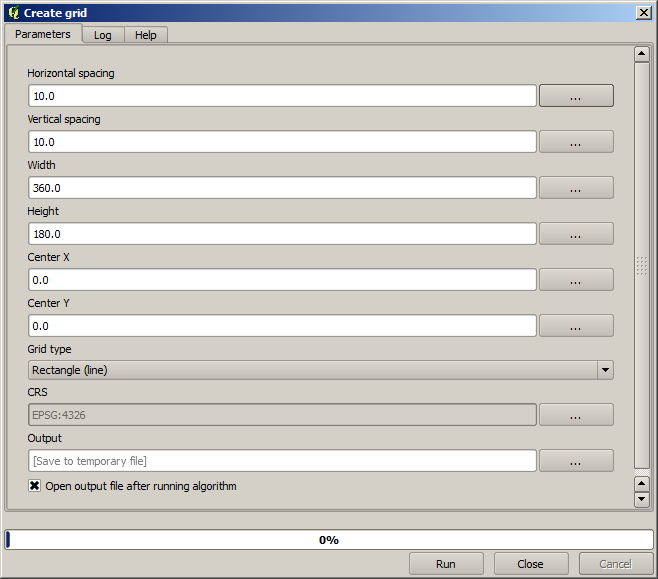
경고
이 옵션들은 QGIS 최신 버전에서 더 단순화되었습니다. X와 Y의 최대/최소값을 입력하면 됩니다. (추천 값 : -5.696226, -5.695122, 40.24742, 40.248171)
그리드를 생성하는 데 필요한 입력값이 모두 숫자입니다. 숫자 값을 입력해야 할 경우, 두 가지 옵션이 있습니다. 해당 란에 직접 입력하든지, 또는 오른쪽에 있는 버튼을 클릭해서 다음 그림과 같은 대화창을 불러오면 됩니다.
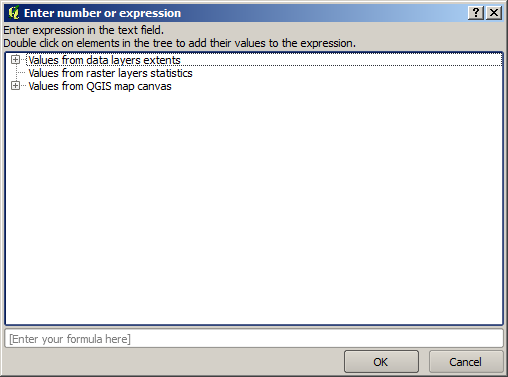
이 대화창은 간단한 계산기를 포함하고 있어서, 11 * 34.7 + 4.6 같은 표현식을 입력하면 결과를 계산해서 파라미터 대화창의 해당 텍스트 란에 입력해줍니다. 또, 여러분이 쓸 수 있는 상수 및 다른 레이어에서 나온 값들도 담고 있습니다.
이 경우 입력 포인트 레이어의 범위를 모두 포함하는 그리드를 생성하려고 하므로, 포인트 레이어의 좌표를 이용해서 그리드 생성 알고리즘이 필요로 하는 파라미터들인 그리드의 중심 좌표 및 너비와 높이를 계산해야 합니다. 여러분의 수학 지식을 응용해서 입력 포인트 레이어에서 나온 상수 및 계산기 대화창을 통해 직접 계산해보십시오.
Select Rectangles (polygons) in the Grid type field.
이전 알고리즘과 마찬가지로, 여기에도 좌표계를 입력해야 합니다. 이전과 동일하게 target CRS 에 EPSG:4326 을 선택하십시오.
이제 파라미터 대화창이 다음과 같이 보여야 합니다.
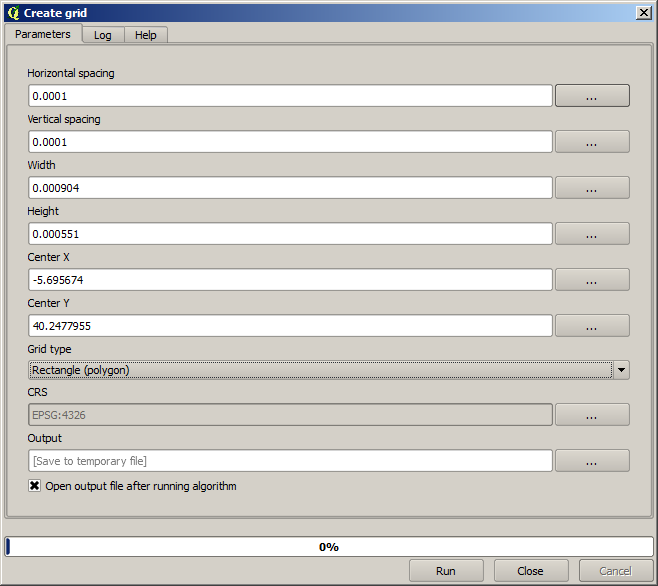
(Better add one spacing on the width and height: Horizontal spacing: 0.0001, Vertical spacing: 0.0001, Width: 0.001004, Height: 0.000651, Center X: -5.695674, Center Y: 40.2477955)
The case of X center is a bit tricky, see: -5.696126+(( -5.695222+ 5.696126)/2)
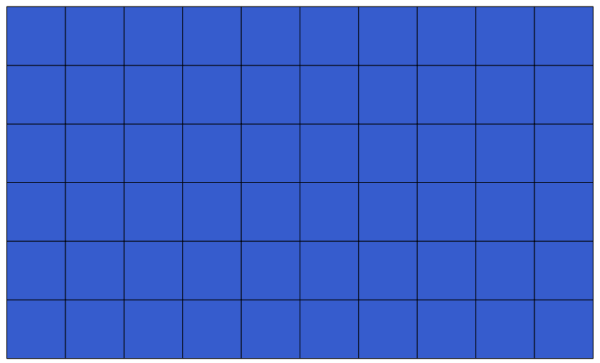
Press Run and you will get the graticule layer.
The last step is to count the points in each one of the rectangles of that graticule. We will use the Count points in polygons algorithm.
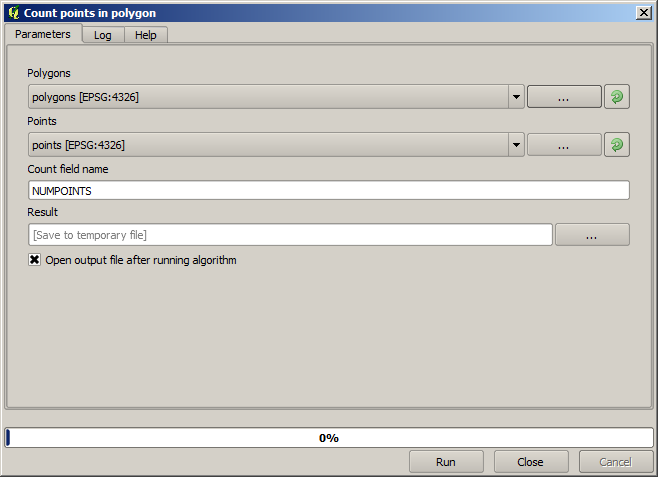
이제 우리가 찾던 결과를 보게 되었습니다.
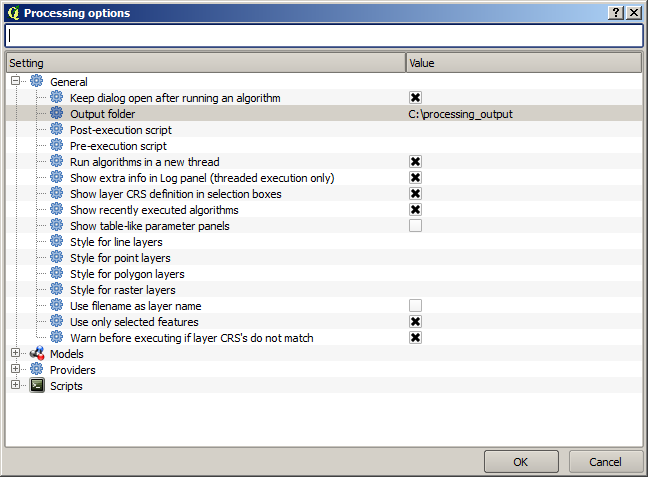
이 수업을 끝내기 전에, 여러분이 고집스럽게 사용자 데이터를 저장하고자 할 경우 더 쉽게 설정할 수 있는 방법이 있습니다. 사용자가 모든 산출물 파일을 어떤 지정한 폴더에 저장하고자 할 경우, 매번 폴더 경로를 입력할 필요가 없습니다. 대신 메뉴에서 항목을 선택하십시오. 다음 환경설정 대화창이 나타날 것입니다.
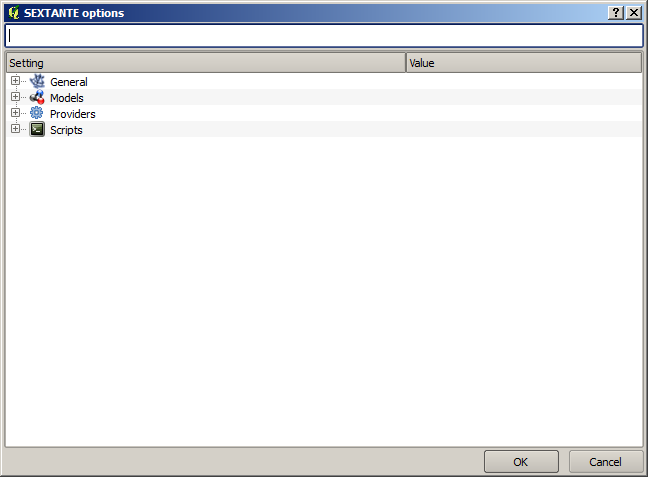
In the Output folder entry that you will find in the General group, type the path to your destination folder.
Now when you run an algorithm, just use the filename instead of the full path. For instance, with the configuration shown above, if you enter graticule.shp as the output path for the algorithm that we have just used, the result will be saved in D:processing_outputgraticule.shp. You can still enter a full path in case you want a result to be saved in a different folder.
Try yourself the Create grid algorithm with different grid sizes, and also with different types of grids.