重要
翻訳は あなたが参加できる コミュニティの取り組みです。このページは現在 64.71% 翻訳されています。
14.9. レッスン: 地図プレゼンテーション
以前のレッスンでは、GISプロジェクトとして古い森林調査をインポートし、それを現在の状況に更新し、森林調査を設計し、フィールドワークの地図を作成し、フィールド測定から森林のパラメーターを算出しました。
GISプロジェクトの結果で地図を作成することはしばしば重要です。森林調査の結果を提示する地図によって、特定の数字を見なくても、結果が何であるか誰にでも一目でわかりやすくなるでしょう。
このレッスンの目標: 調査結果を提示する地図を、陰影起伏ラスターを背景に使用して作成します。
14.9.1. ★☆☆ (初級レベル) 理解しよう: 地図データを準備する
Open the QGIS project from the parameters calculations lesson, forest_inventory.qgs.
Keep at least the following layers:
forest_stands_2012_results.basic_map.rautjarvi_aerial.lakes(if you don't have it, add it from theexercise_data\forestry\folder).
You are going to present the average volumes of your forest stands in a map.
If you open the Attribute table for the forest_stands_2012_results
layer, you can see the NULL values for the stands without information.
To be able to get also those stands into your symbology you should change the
NULL values to, for example, -999, knowing that those negative
numbers mean there is no data for those polygons.
For the forest_stands_2012_results layer:
属性テーブル を開き編集を可能にします。
Select the polygons with
NULLvalues.Use the calculator to update the values of the
MEANVolfield to-999only for the selected features.編集を無効にし、変更を保存します。
今、保存されたスタイルをこのレイヤーに使用できます。
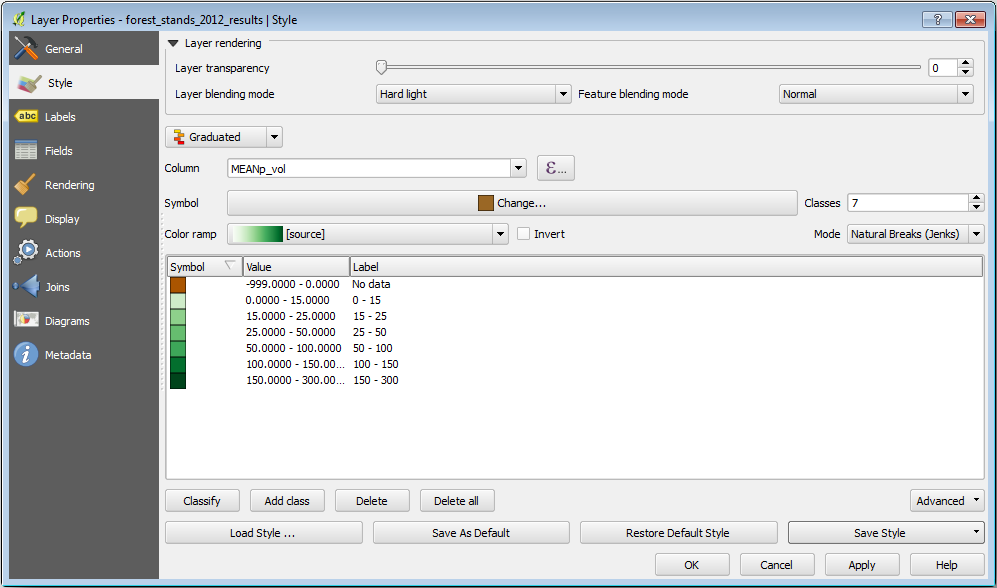
シンボロジ タブに移動します。
。
Select the
forest_stands_2012_results.qmlfrom theexercise_data\forestry\results\folder.OK をクリックします。
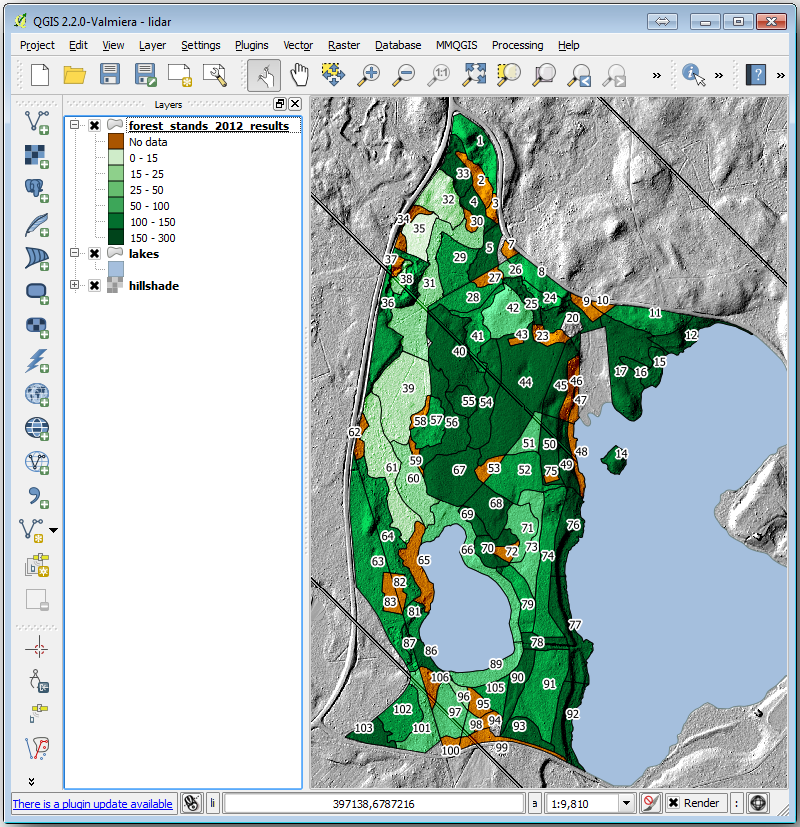
地図は次のようになります。
14.9.2. ★☆☆ (初級レベル) 自分でやってみよう: さまざまなブレンドモードを試す
読み込んだスタイル:
is using the Hard light mode for the Layer blending mode. Note that the different modes apply different filters combining the underlying and overlying layers, in this case the hillshade raster and your forest stands are used. You can read about these modes in the User Guide.
異なるモードで試してみて、地図の違いを見てください。それから、より好きな方を最終的な地図として選択してください。
14.9.3. ★☆☆ (初級レベル) 自分でやってみよう: レイアウトテンプレートを使って地図の結果を作る
Use a template prepared in advanced to present the results. The template
forest_map.qpt is located in the exercise_data\forestry\results\
folder. Load it using the dialog.
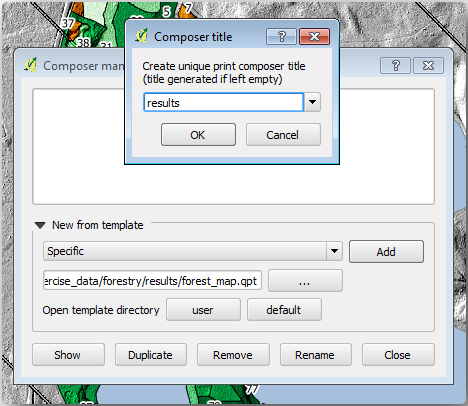
印刷レイアウトを開き、最終的なマップを編集して納得のいく仕上がりにします。
使用している地図テンプレートは、これと同じ地図を提供します:
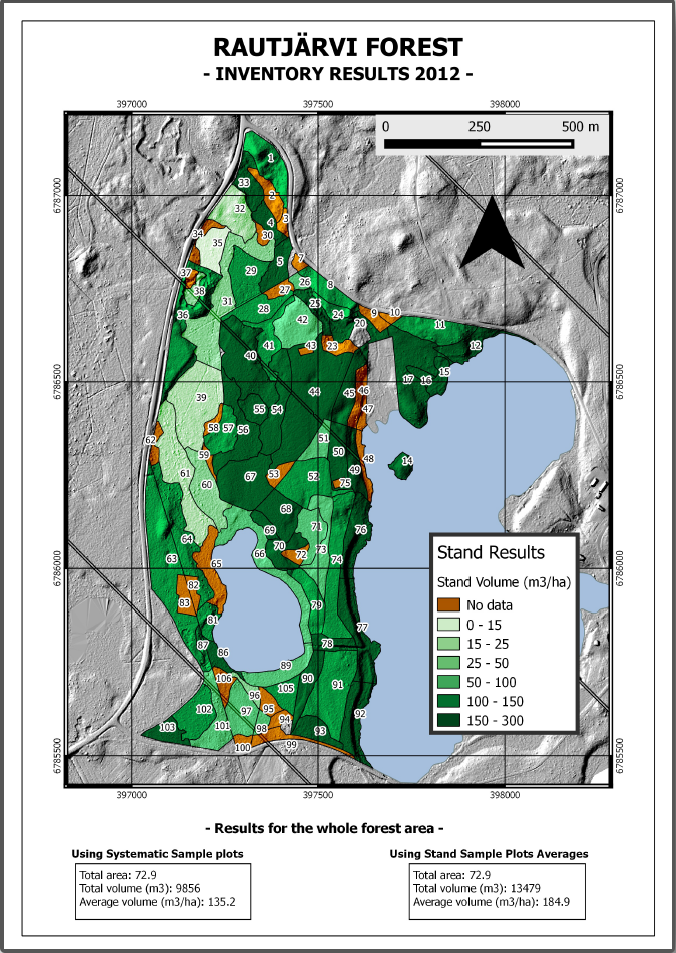
将来の参照のためQGISプロジェクトを保存します。
14.9.4. 結論
このモジュールを通して、基本的な森林調査を計画し、QGISで提示する方法を見てきました。アクセスできるさまざまなツールでさらに多くの森林の分析が可能ですが、このマニュアルがご自身が必要とする結果を達成する方法を探るための良い出発点になればと思います。