Importante
A tradução é um esforço comunitário você pode contribuir. Esta página está atualmente traduzida em 50.00%.
14.9. Lesson: Map Presentation
Nas lições anteriores você importou um antigo inventário de floresta como um projeto SIG, atualizou para a situação atual, desenhou o inventário florestal, criou mapas para campos de trabalho e calculou parâmetros da floresta a partir de medidas de campo.
A menudo es importante crear mapas con los resultados de un proyecto SIG. Una presentación de los resultados del mapa del inventario forestal facilitará a cualquiera el tener una buena idea de cuales son los resultados a simple vista, sin mirar números específicos.
El objetivo de esta lección: Crear un mapa para presentar los resultados de inventario utilizando un ráster de sombreado de relieve como fondo.
14.9.1. ★☆☆ Follow Along: Preparing the Map Data
Open the QGIS project from the parameters calculations lesson, forest_inventory.qgs.
Keep at least the following layers:
forest_stands_2012_results.basic_map.rautjarvi_aerial.lakes(if you don’t have it, add it from theexercise_data\forestry\folder).
You are going to present the average volumes of your forest stands in a map.
If you open the Attribute table for the forest_stands_2012_results
layer, you can see the NULL values for the stands without information.
To be able to get also those stands into your symbology you should change the
NULL values to, for example, -999, knowing that those negative
numbers mean there is no data for those polygons.
For the forest_stands_2012_results layer:
Abre la Attribute table y activa la edición.
Select the polygons with
NULLvalues.Use the calculator to update the values of the
MEANVolfield to-999only for the selected features.Desactiva la edición y guarda los cambios.
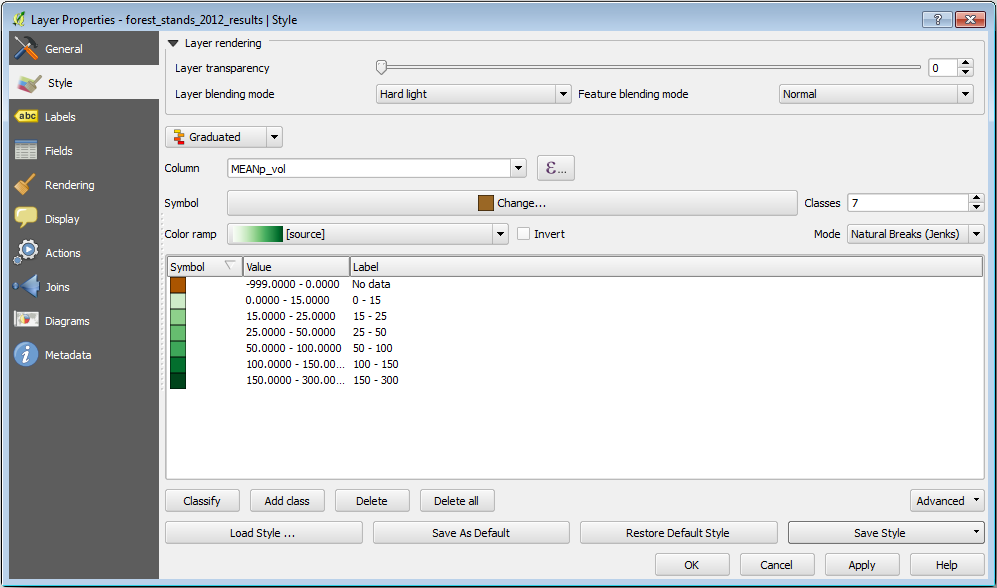
Ahora puedes utilizar un estilo guardado para esa capa:
Vá para a guia Simbologia.
Clique em .
Select the
forest_stands_2012_results.qmlfrom theexercise_data\forestry\results\folder.Haz clic en Aceptar.
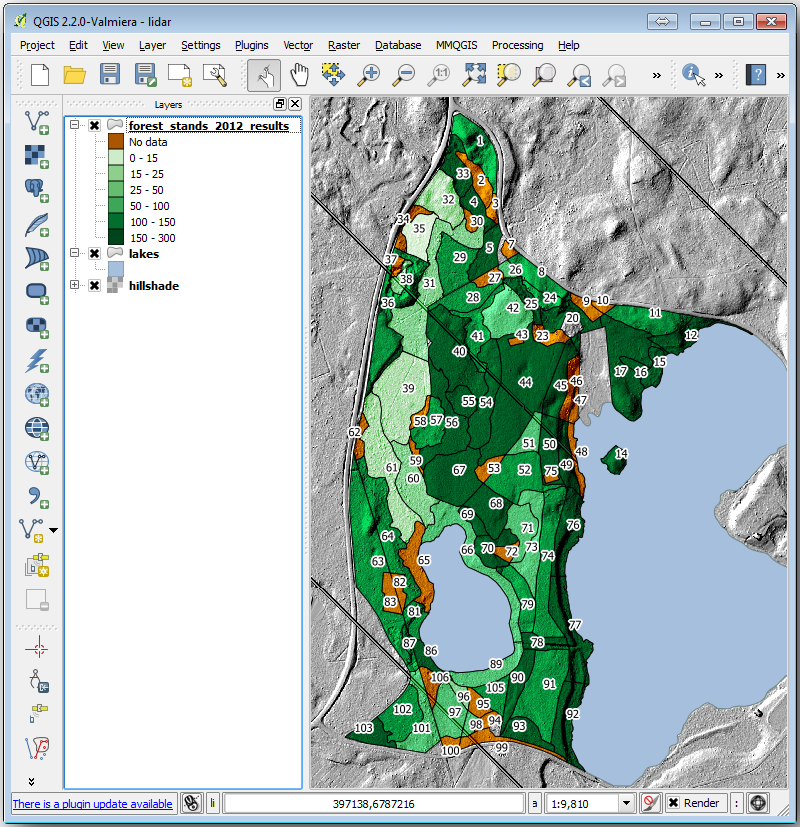
Tu mapa se parecerá a este:
14.9.2. ★☆☆ Try Yourself: Try Different Blending Modes
El estilo que has cargado:
is using the Hard light mode for the Layer blending mode. Note that the different modes apply different filters combining the underlying and overlying layers, in this case the hillshade raster and your forest stands are used. You can read about these modes in the User Guide.
Prueba modos diferentes y observa las diferencias en tu mapa. Luego elige el que más te guste para el mapa final.
14.9.3. ★☆☆ Try Yourself: Using a Layout Template to Create the Map result
Use a template prepared in advanced to present the results. The template
forest_map.qpt is located in the exercise_data\forestry\results\
folder. Load it using the dialog.
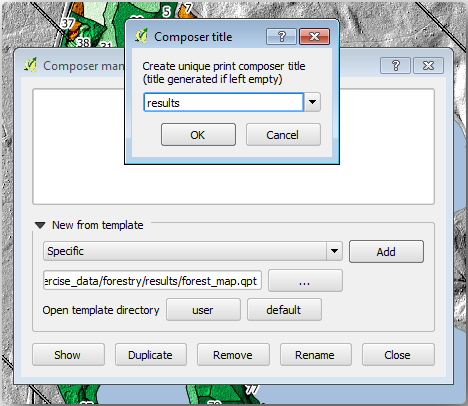
Abra o layout de impressão e edite o mapa final para obter um resultado com que você fique satisfeito.
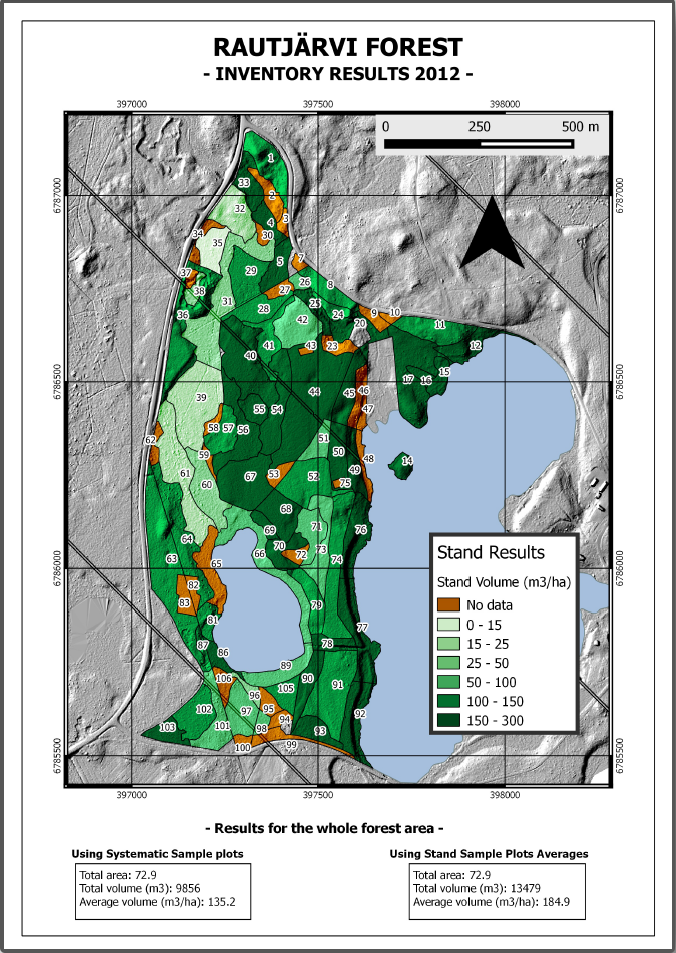
La plantilla de mapa que estás utilizando dará un mapa similar a este:
Guarda tu proyecto QGIS para futuras referencias.
14.9.4. In Conclusion
A través de este módulo has visto cómo un inventario forestal básico puede ser planificado y presentado con QGIS. Muchos más análisis forestales son posibles con la variedad de herramientas a las que tienes acceso, pero afortunadamente este manual te ha dado un buen punto de inicio para explorar cómo podrías conseguir los resultados específicos que necesites.