Important
Traducerea este un efort al comunității, la care puteți să vă alăturați. În prezent, această pagină este tradusă 47.06%.
14.9. Lesson: Map Presentation
În lecțiile anterioare ați importat, sub formă de proiect GIS, un vechi inventar de pădure, l-ați actualizat, ați proiectat un inventar, ați creat hărți pentru munca de teren și ați calculat parametrii pădurii folosind măsurătorile din teren.
Adesea, pentru a prezenta rezultatele, este importantă crearea de hărți, în cadrul unui proiect GIS. O hartă care prezintă inventarul forestier va facilita înțelegerea acestuia dintr-o simplă privire, fără analiza detaliată a cifrelor.
Scopul acestei lecții: De a crea o hartă care să prezinte rezultatele inventarerii, folosind ca fundal un raster al reliefului umbrit.
14.9.1. ★☆☆ Follow Along: Preparing the Map Data
Open the QGIS project from the parameters calculations lesson, forest_inventory.qgs.
Keep at least the following layers:
forest_stands_2012_results.basic_map.rautjarvi_aerial.lakes(if you don’t have it, add it from theexercise_data\forestry\folder).
You are going to present the average volumes of your forest stands in a map.
If you open the Attribute table for the forest_stands_2012_results
layer, you can see the NULL values for the stands without information.
To be able to get also those stands into your symbology you should change the
NULL values to, for example, -999, knowing that those negative
numbers mean there is no data for those polygons.
For the forest_stands_2012_results layer:
Deschideți Tabela sa de Atribute și activați editarea.
Select the polygons with
NULLvalues.Use the calculator to update the values of the
MEANVolfield to-999only for the selected features.Dezactivați editarea și salvați modificările.
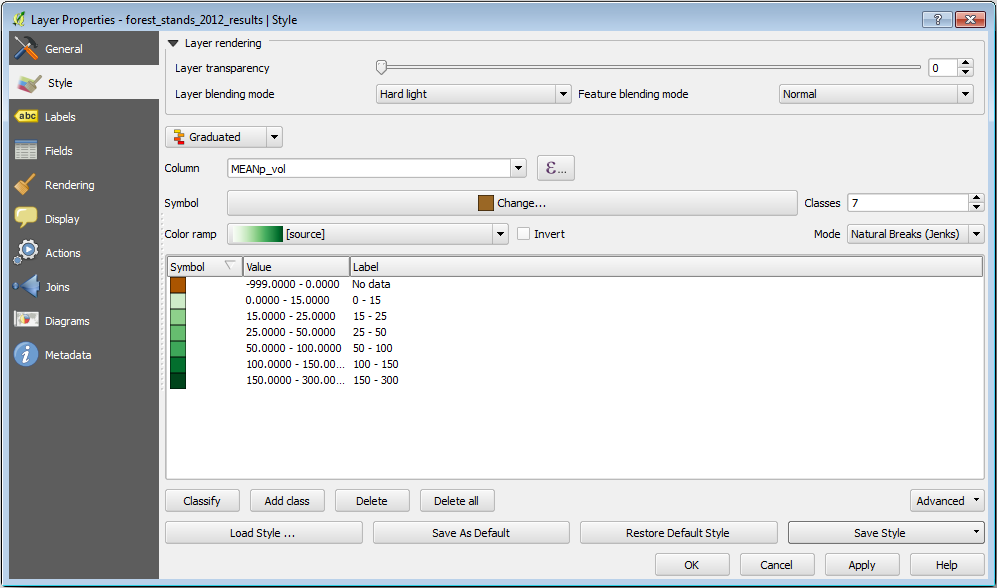
Acum puteți un stil implicit pentru acest strat:
Mergeți la fila Simbologiei.
Click on .
Select the
forest_stands_2012_results.qmlfrom theexercise_data\forestry\results\folder.Clic pe OK
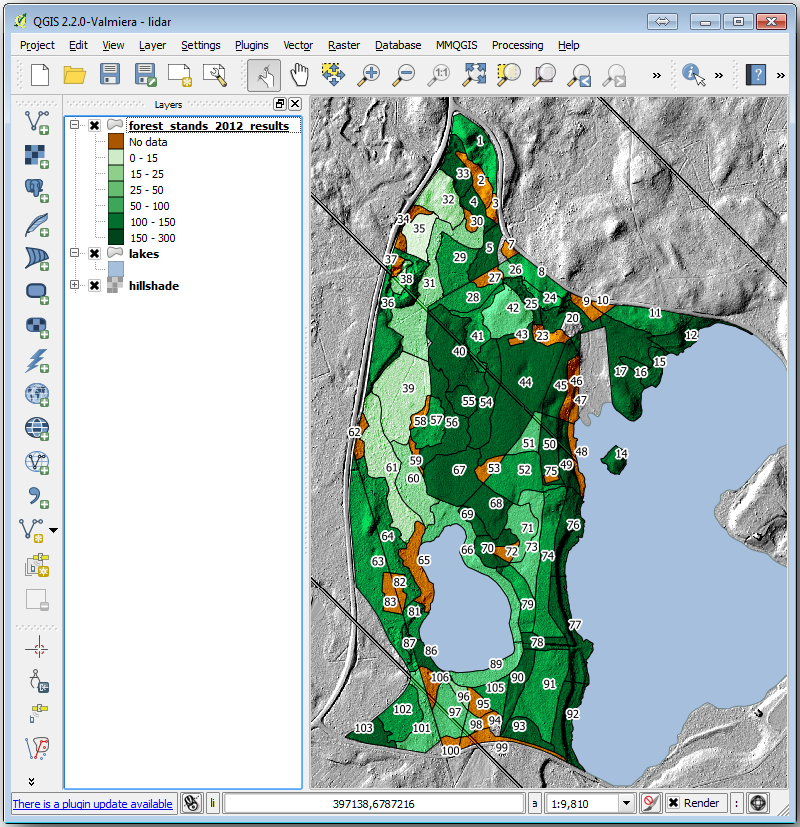
Harta dvs. va arăta în felul următor:
14.9.2. ★☆☆ Try Yourself: Try Different Blending Modes
Stilul pe care l-ați încărcat:
is using the Hard light mode for the Layer blending mode. Note that the different modes apply different filters combining the underlying and overlying layers, in this case the hillshade raster and your forest stands are used. You can read about these modes in the User Guide.
Încercați în diverse moduri și observați diferențele în hartă. Apoi, stabiliți unul care vă place cel mai mult pentru harta finală.
14.9.3. ★☆☆ Try Yourself: Using a Layout Template to Create the Map result
Use a template prepared in advanced to present the results. The template
forest_map.qpt is located in the exercise_data\forestry\results\
folder. Load it using the dialog.
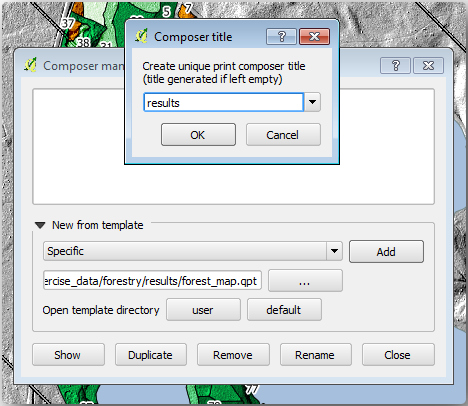
Open the print layout and edit the final map to get a result you are happy with.
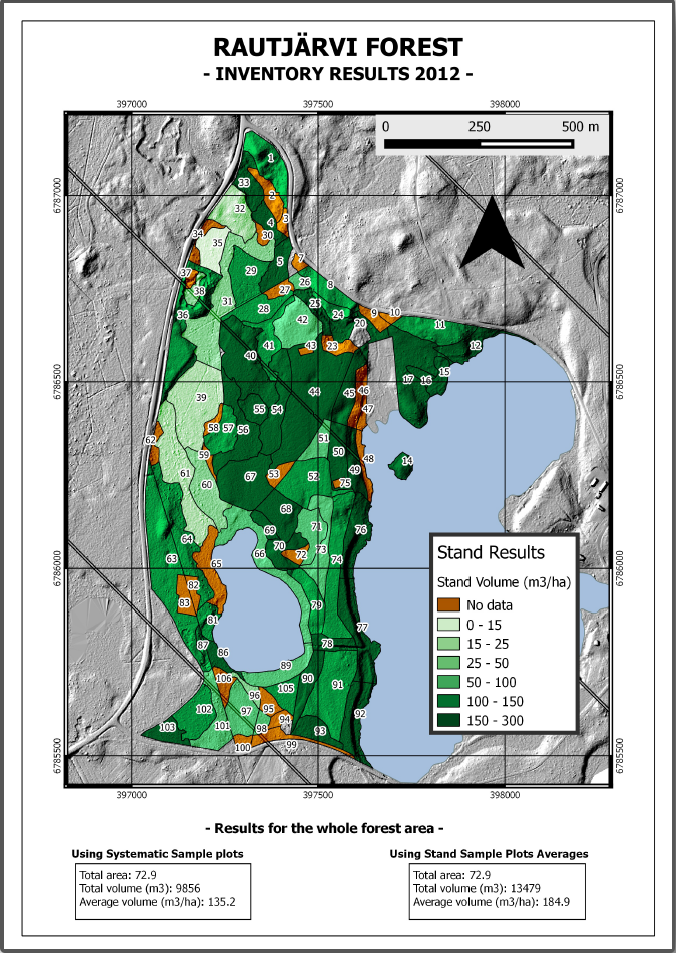
Șablonul hărții pe care îl utilizați vă va oferi o hartă similară cu aceasta:
Salvați proiectul dumneavoastră QGIS ca referință pentru viitor.
14.9.4. În concluzie
Prin intermediul acestui modul ați văzut cum poate fi planificat și prezentat un inventar forestier de bază în QGIS. Mult mai multe analize forestiere sunt posibile în varietatea de instrumente pe care le puteți accesa, dar sperăm că acest manual va oferit un bun punct de plecare pentru a explora noi modalități de obținere a rezultatelor dorite.