` `
Dialoogvenster Raster-eigenschappen
To view and set the properties for a raster layer, double click on the layer name in the map legend, or right click on the layer name and choose Properties from the context menu. This will open the Raster Layer Properties dialog (see figure_raster_properties).
Het dialoogvenster bevat verschillende tabbladen:
- General
- Style
- Transparency
- Pyramids
- Histogram
- Metadata
- Legend
Raster Layers Properties Dialog
Tip
Live bijwerken renderen
Het Paneel Laag opmaken verschaft u enkele algemene mogelijkheden van het dialoogvenster Laageigenschappen en is een goed modeless widget dat u kunt gebruiken om de configuratie van de stijlen van de laag te versnellen en automatisch uw wijzigingen in het kaartvenster te bekijken.
Notitie
Omdat eigenschappen (symbologie, label, acties, standaard waarden, formulieren...) van ingebedde lagen (zie Projecten in een project) uit het originele projectbestand worden opgehaald en om wijzigingen die dit gedrag zouden kunnen beschadigen te vermijden, is het dialoogvenster Laageigenschappen voor deze lagen niet beschikbaar gemaakt.
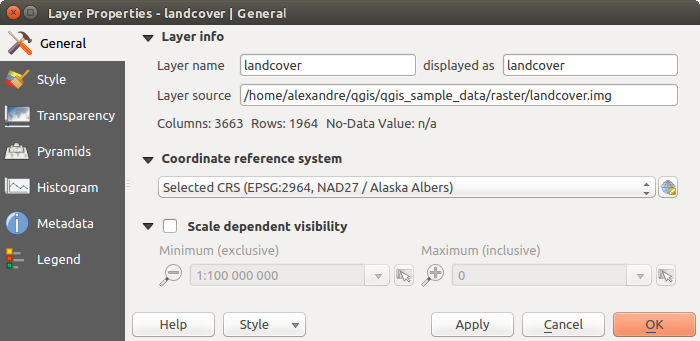
General Properties
Layer Info
The General tab displays basic information about the selected raster, including the layer source path, the display name in the legend (which can be modified), and the number of columns, rows and no-data values of the raster.
Coordinate Reference System
Displays the layer’s Coordinate Reference System (CRS) as a PROJ.4 string. You
can change the layer’s CRS, selecting a recently used one in the drop-down list
or clicking on  Select CRS button (see Keuze Coördinaten ReferentieSysteem).
Use this process only if the CRS applied to the layer is a wrong one or if none
was applied. If you wish to reproject your data into another CRS, rather use
layer reprojection algorithms from Processing or Save it into another
layer.
Select CRS button (see Keuze Coördinaten ReferentieSysteem).
Use this process only if the CRS applied to the layer is a wrong one or if none
was applied. If you wish to reproject your data into another CRS, rather use
layer reprojection algorithms from Processing or Save it into another
layer.
Scale dependent visibility
U kunt de schaal Maximum (inclusief) en Minimum (exclusief) instellen, wat een bereik van schalen definieert waarin de laag zichtbaar zal zijn. Buiten dit bereik is hij verborgen. De knop  Op huidige schaal kaartvenster instellen helpt u de schaal van het huidige kaartvenster te gebruiken als grens voor de zichtbaarheid van het bereik. Bekijk Schaalafhankelijk renderen voor meer informatie.
Style Properties
Enkelbands renderen
QGIS biedt vier verschillende Typen rendering. De renderer die wordt gekozen is afhankelijk van het gegevenstype.
- Multiband color - if the file comes as a multiband with several bands (e.g., used with a satellite image with several bands)
- Paletted - if a single band file comes with an indexed palette (e.g., used with a digital topographic map)
- Singleband gray - (one band of) the image will be rendered as gray; QGIS will choose this renderer if the file has neither multibands nor an indexed palette nor a continuous palette (e.g., used with a shaded relief map)
- Singleband pseudocolor - this renderer is possible for files with a continuous palette, or color map (e.g., used with an elevation map)
Multiband color
With the multiband color renderer, three selected bands from the image will be rendered, each band representing the red, green or blue component that will be used to create a color image. You can choose several Contrast enhancement methods: ‘No enhancement’, ‘Stretch to MinMax’, ‘Stretch and clip to MinMax’ and ‘Clip to min max’.
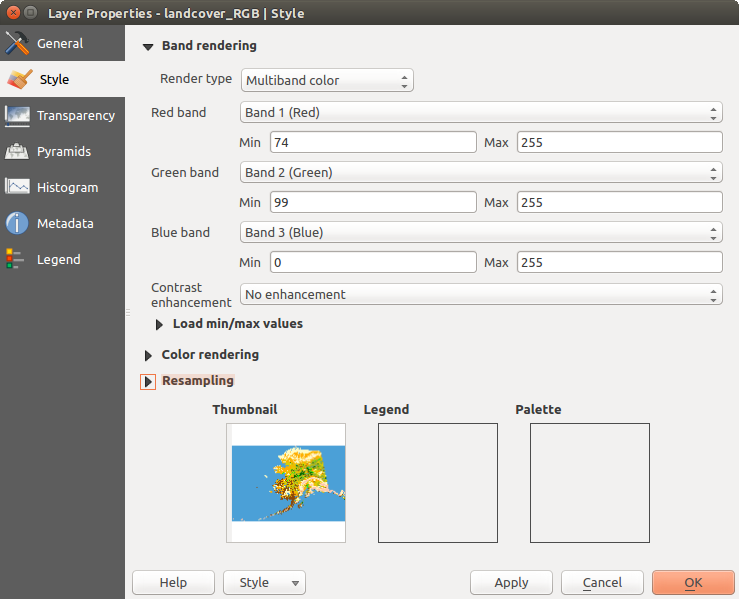
Raster Style - Multiband color rendering
This selection offers you a wide range of options to modify the appearance
of your raster layer. First of all, you have to get the data range from your
image. This can be done by choosing the Extent and pressing
[Load]. QGIS can  Estimate (faster) the
Min and Max values of the bands or use the
Estimate (faster) the
Min and Max values of the bands or use the
 Actual (slower) Accuracy.
Now you can scale the colors with the help of the Load min/max values
section. A lot of images have a few very low and high data. These outliers can be
eliminated using the Cumulative count cut setting.
The standard data range is set from 2% to 98% of the data values and can be adapted
manually. With this setting, the gray character of the image can disappear.
With the scaling option Min/max, QGIS creates a color
table with all of the data included in the original image (e.g., QGIS creates
a color table with 256 values, given the fact that you have 8 bit bands).
You can also calculate your color table using the Mean
+/- standard deviation x  .
Then, only the values within the standard deviation or within multiple standard deviations
are considered for the color table. This is useful when you have one or two cells
with abnormally high values in a raster grid that are having a negative impact on
the rendering of the raster.
.
Then, only the values within the standard deviation or within multiple standard deviations
are considered for the color table. This is useful when you have one or two cells
with abnormally high values in a raster grid that are having a negative impact on
the rendering of the raster.
All calculations can also be made for the Current extent.
Tip
Het tonen van een enkel- of multiband raster
If you want to view a single band of a multiband image (for example, Red), you might think you would set the Green and Blue bands to “Not Set”. But this is not the correct way. To display the Red band, set the image type to ‘Singleband gray’, then select Red as the band to use for Gray.
Paletted
Dit is de standaard renderoptie voor enkelbands bestanden waarin al een kleurentabel is opgenomen, waarbij elk pixelwaarde wordt toegewezen aan een bepaalde kleur. In dat geval wordt het palet automatisch gerenderd. Als u de aan bepaalde waarden toegekende kleuren wilt wijzigen, klik dan eenvoudigweg op de kleur en het dialoogvenster Selecteer kleur verschijnt. Ook is het in QGIS mogelijk een label toe te wijzen aan de kleurwaarden. Het label verschijnt dan in de legenda van de rasterlaag.
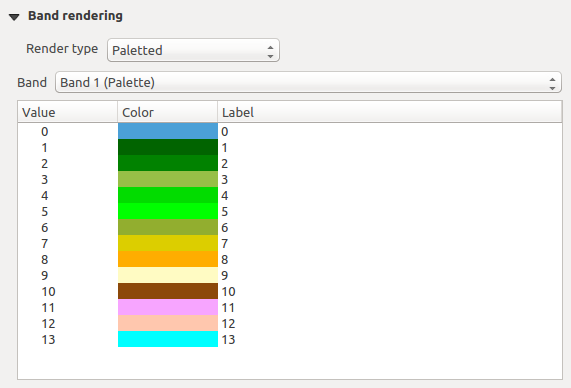
Raster Style - Paletted Rendering
Contrastverhoging
Notitie
Als een raster van GRASS wordt toegevoegd, zal de optie Contrastverbetering altijd automatisch op stretch tot min max gezet worden, ook al is er, onder algemene instellingen van QGIS, gekozen voor een andere waarde.
Singleband gray
This renderer allows you to render a single band layer with a Color gradient:
‘Black to white’ or ‘White to black’. You can define a Min
and a Max value by choosing the Extent first and
then pressing [Load]. QGIS can Estimate (faster)
the Min and Max values of the bands or use the
Actual (slower) Accuracy.
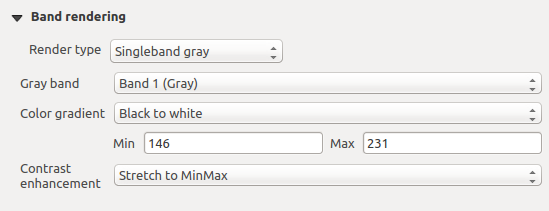
Raster Style - Singleband gray rendering
With the Load min/max values section, scaling of the color table
is possible. Outliers can be eliminated using the Cumulative
count cut setting.
The standard data range is set from 2% to 98% of the data values and can
be adapted manually. With this setting, the gray character of the image can disappear.
Further settings can be made with Min/max and
Mean +/- standard deviation x .
While the first one creates a color table with all of the data included in the
original image, the second creates a color table that only considers values
within the standard deviation or within multiple standard deviations.
This is useful when you have one or two cells with abnormally high values in
a raster grid that are having a negative impact on the rendering of the raster.
Singleband pseudocolor
Dit is een renderoptie voor enkelbands-bestanden, inclusief een doorlopend palet. U kunt hier ook individuele kleurenkaarten maken voor de enkele banden.
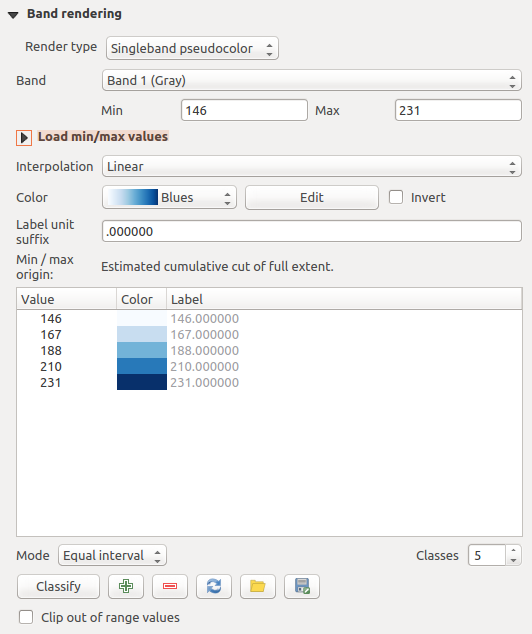
Raster Style - Singleband pseudocolor rendering
Three types of color interpolation are available:
- Discrete
Lineair
- Exact
In the left block, the button  Add values manually adds a value
to the individual color table. The button
Add values manually adds a value
to the individual color table. The button  Remove selected row
deletes a value from the individual color table, and the
Remove selected row
deletes a value from the individual color table, and the
 Sort colormap items button sorts the color table according
to the pixel values in the value column. Double clicking on the value column
lets you insert a specific value. Double clicking on the color column opens the dialog
Change color, where you can select a color to apply on that value.
Further, you can also add labels for each color, but this value won’t be displayed
when you use the identify feature tool.
You can also click on the button
Sort colormap items button sorts the color table according
to the pixel values in the value column. Double clicking on the value column
lets you insert a specific value. Double clicking on the color column opens the dialog
Change color, where you can select a color to apply on that value.
Further, you can also add labels for each color, but this value won’t be displayed
when you use the identify feature tool.
You can also click on the button  Load color map from band,
which tries to load the table from the band (if it has any). And you can use the
buttons
Load color map from band,
which tries to load the table from the band (if it has any). And you can use the
buttons  Load color map from file or
  Export color map to file to load an existing color table or to save the
defined color table for other sessions.
Export color map to file to load an existing color table or to save the
defined color table for other sessions.
In the right block, Generate new color map allows you to create newly
categorized color maps. For the Classification mode  ‘Equal interval’, you only need to select the number of classes
and press the button Classify. You can invert the colors
of the color map by clicking the
‘Equal interval’, you only need to select the number of classes
and press the button Classify. You can invert the colors
of the color map by clicking the  Invert
checkbox. In the case of the Mode ‘Continuous’, QGIS creates
classes automatically depending on the Min and Max.
Defining Min/Max values can be done with the help of the Load min/max values section.
A lot of images have a few very low and high data. These outliers can be eliminated
using the Cumulative count cut setting. The standard
data range is set from 2% to 98% of the data values and can be adapted manually.
With this setting, the gray character of the image can disappear.
With the scaling option Min/max, QGIS creates a color
table with all of the data included in the original image (e.g., QGIS creates a
color table with 256 values, given the fact that you have 8 bit bands).
You can also calculate your color table using the Mean +/-
standard deviation x .
Then, only the values within the standard deviation or within multiple standard deviations
are considered for the color table.
Invert
checkbox. In the case of the Mode ‘Continuous’, QGIS creates
classes automatically depending on the Min and Max.
Defining Min/Max values can be done with the help of the Load min/max values section.
A lot of images have a few very low and high data. These outliers can be eliminated
using the Cumulative count cut setting. The standard
data range is set from 2% to 98% of the data values and can be adapted manually.
With this setting, the gray character of the image can disappear.
With the scaling option Min/max, QGIS creates a color
table with all of the data included in the original image (e.g., QGIS creates a
color table with 256 values, given the fact that you have 8 bit bands).
You can also calculate your color table using the Mean +/-
standard deviation x .
Then, only the values within the standard deviation or within multiple standard deviations
are considered for the color table.
Het renderen van kleuren
Voor elke Bandrendering is een Kleurrendering mogelijk.
U kunt ook speciale effecten voor renderen voor uw rasterbestand(en) bereiken met behulp van de Meng-modi (zie Meng-modi).
Verdere instellingen kunnen worden gemaakt in het aanpassen van de Helderheid, de Saturatie en het Contrast. U kunt ook een optie Grijstinten gebruiken, waar u kunt kiezen uit ‘Lichtsterkte van’, ‘Helderheid van’ en ‘Gemiddelde van’. Voor een kleurnuance in de kleurentabel kunt u de ‘Sterkte’ aanpassen.
Resampling
De optie Resample verschijnt als u in- en uitzoomt in een afbeelding. Modi voor Resample kunnen het uiterlijk van de kaart optimaliseren. Zij berekenen een nieuwe matrix voor grijswaarden door middel van een geometrische transformatie.
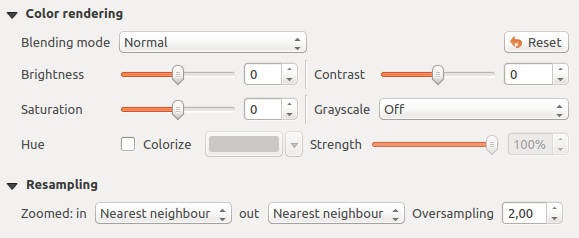
Raster Style - Color rendering and Resampling settings
Bij het toepassen van de methode ‘Dichtstbijzijnde buur’ kan de kaart een gepixelde structuur hebben bij het inzoomen. Dit uiterlijk kan worden verbeterd door de methoden ‘Bilineair’ of ‘Kubisch’ te gebruiken, wat scherpe objecten vervaagt. Het effect is een gladdere afbeelding. Deze methode kan bijvoorbeeld worden toegepast bij digitale topografische rasterkaarten.
At the bottom of the Style tab, you can see a thumbnail of the layer, its legend symbol, and the palette.
Eigenschappen voor transparantie
QGIS has the ability to display each raster layer at a different transparency level.
Use the transparency slider  to indicate to what extent the underlying layers
(if any) should be visible though the current raster layer. This is very useful
if you like to overlay more than one raster layer (e.g., a shaded relief map
overlayed by a classified raster map). This will make the look of the map more
three dimensional.
to indicate to what extent the underlying layers
(if any) should be visible though the current raster layer. This is very useful
if you like to overlay more than one raster layer (e.g., a shaded relief map
overlayed by a classified raster map). This will make the look of the map more
three dimensional.
Daarnaast kunt u aangeven welke rasterwaarde als Geen data behandeld moet worden in de optie Extra waarde ‘Geen data’.
An even more flexible way to customize the transparency can be done in the Custom transparency options section. The transparency of every pixel can be set here.
As an example, we want to set the water of our example raster file landcover.tif to a transparency of 20%. The following steps are necessary:
- Load the raster file landcover.tif.
- Open the Properties dialog by double-clicking on the raster name in the legend, or by right-clicking and choosing Properties from the pop-up menu.
- Select the Transparency tab.
- From the Transparency band drop-down menu, choose ‘None’.
Klik op
Voeg handmatig waarden toe. Een nieuwe rij zal worden toegevoegd aan de Transparantie pixellijst.- Enter the raster value in the ‘From’ and ‘To’ column (we use 0 here), and adjust the transparency to 20%.
- Press the [Apply] button and have a look at the map.
You can repeat steps 5 and 6 to adjust more values with custom transparency.
Het is eenvoudig om een aangepaste transparantie op te zetten, maar dit is aardig wat werk. De knop  Naar bestand exporteren geeft dan ook de mogelijkheid om de Transparantie pixellijst op te slaan naar een bestand. De knop Uit bestand importeren laadt de lijst van de transparantie weer en past die toe op de huidige rasterlaag.
Eigenschappen voor piramiden
Rasterlagen met een hoge resolutie, kunnen het navigeren binnen QGIS langzaam maken. Door het aanmaken van kopieën met lagere resolutie (piramiden), kan de uitvoering van QGIS aanzienlijk worden verbeterd, aangezien QGIS de kopie met de meest geschikte resolutie selecteert voor elk zoomniveau.
U moet schrijfrechten hebben voor de map waarin de originele rastergegevens zijn opgeslagen om piramiden te bouwen.
Selecteer, uit de lijst Resoluties, resoluties waarvoor u piramiden wilt maken door erop te klikken.
Indien u ‘Intern (indien mogelijk)’ kiest uit het keuzemenu Overzichtsindeling, probeert QGIS intern piramiden te bouwen.
Notitie
Onthoud dat het bouwen van piramiden de originele databestanden kan veranderen en dat intern aangemaakte piramiden niet meer verwijderd kunnen worden. Het is dan ook altijd verstandig om van het origineel, zonder piramiden, eerst een kopie te maken en te bewaren.
Indien u kiest voor Extern en Extern (Erdas Imagine) zullen de piramiden worden gemaakt in een bestand naast het originele raster met dezelfde naam en de extensie .ovr.
Verschillende Methoden voor resamplen kunnen worden gebruikt om piramiden te berekenen:
‘Dichtstbijzijnde buur’
Gemiddelde
- Gauss
Kubisch
Modus
Geen
Finally, click [Build pyramids] to start the process.
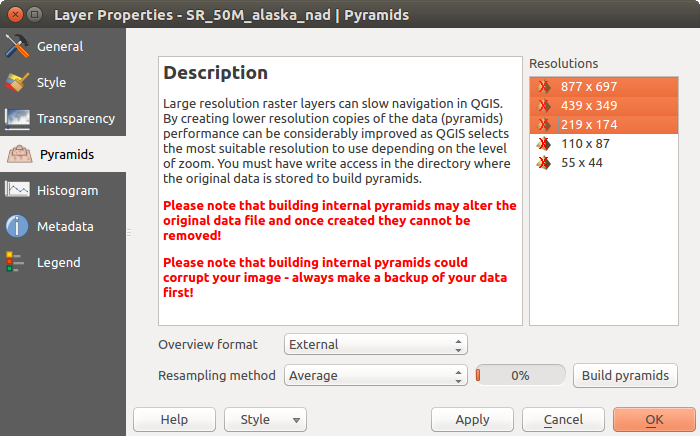
Rasterpiramiden
Eigenschappen voor Histogram
The Histogram tab allows you to view the distribution of the bands
or colors in your raster. The histogram is generated automatically when you open the
Histogram tab. All existing bands will be displayed together. You
can save the histogram as an image with the button.
With the Visibility option in the  Prefs/Actions menu,
you can display histograms of the individual bands. You will need to select the option
Show selected band.
The Min/max options allow you to ‘Always show min/max markers’, to ‘Zoom
to min/max’ and to ‘Update style to min/max’.
With the Actions option, you can ‘Reset’ and ‘Recompute histogram’ after
you have chosen the Min/max options.
Prefs/Actions menu,
you can display histograms of the individual bands. You will need to select the option
Show selected band.
The Min/max options allow you to ‘Always show min/max markers’, to ‘Zoom
to min/max’ and to ‘Update style to min/max’.
With the Actions option, you can ‘Reset’ and ‘Recompute histogram’ after
you have chosen the Min/max options.
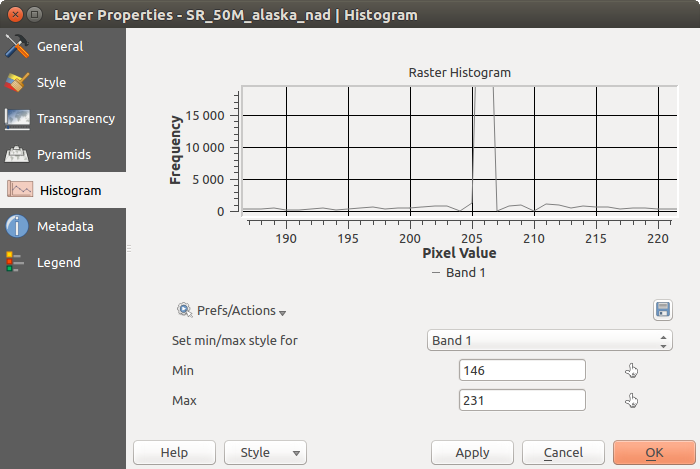
Raster Histogram
Eigenschappen voor Metadata
The Metadata tab displays a wealth of information about the raster layer, including statistics about each band in the current raster layer. From this tab, entries may be made for the Description, Attribution, MetadataUrl and Properties. In Properties, statistics are gathered on a ‘need to know’ basis, so it may well be that a given layer’s statistics have not yet been collected.
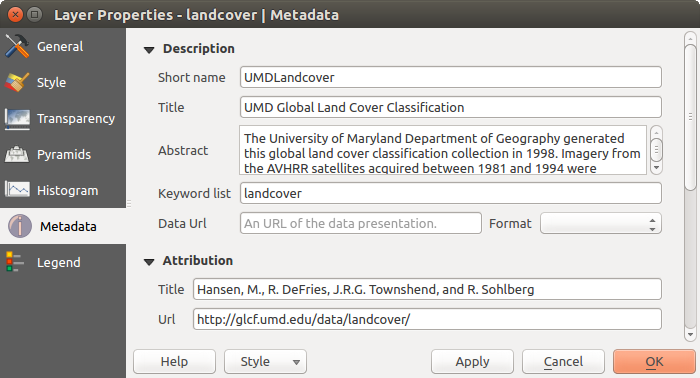
Raster Metadata
Eigenschappen voor Legenda
The Legend tab provides you with a list of widgets you can embed within the layer tree in the Layers panel. The idea is to have a way to quickly access some actions that are often used with the layer (setup transparency, filtering, selection, style or other stuff...).
Standaard verschaft QGIS het widget voor transparantie, maar dit kan worden uitgebreid door plug-ins die hun eigen widgets registreren en aangepaste acties toewijzen aan de lagen die zij beheren.