` `
The toolbox
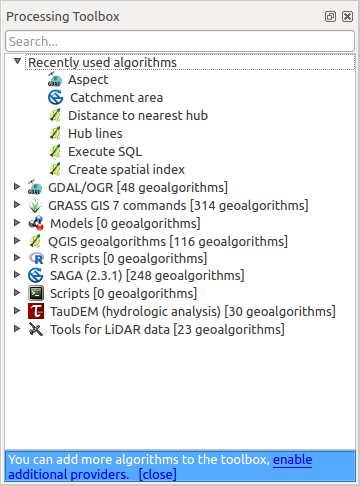
The Toolbox is the main element of the processing GUI, and the one that you are more likely to use in your daily work. It shows the list of all available algorithms grouped in different blocks, and it is the access point to run them, whether as a single process or as a batch process involving several executions of the same algorithm on different sets of inputs.
Processing - Toolbox
The toolbox contains all the available algorithms, divided into so-called “Providers”.
Providers can be (de)activated in the settings dialog. A label in the bottom part of the toolbox will remind you of that whenever there are inactive providers. Use the link in the label to open the settings window and set up providers. We will discuss the settings dialog later in this manual.
By default, only providers that do not rely on third-party applications (that is, those that only require QGIS elements to be run) are active. Algorithms requiring external applications might need additional configuration. Configuring providers is explained in a later chapter in this manual.
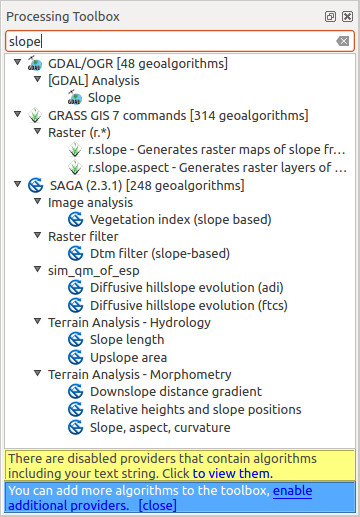
In the upper part of the toolbox, you will find a text box. To reduce the number of algorithms shown in the toolbox and make it easier to find the one you need, you can enter any word or phrase on the text box. Notice that, as you type, the number of algorithms in the toolbox is reduced to just those that contain the text you have entered in their names.
If there are algorithms that match your search but belong to a provider that is not active, an additional label will be shown in the lower part of the toolbox.
Processing - Toolbox geeft de resultaten weer
If you click on the link in that label, the list of algorithms will also include those from inactive providers, which will be shown in light gray. A link to active each inactive provider is also shown.

Processing - Toolbox geeft de resultaten weer
To execute an algorithm, just double-click on its name in the toolbox.
Het dialoogvenster Algoritme
Once you double-click on the name of the algorithm that you want to execute, a dialog similar to that in the figure below is shown (in this case, the dialog corresponds to the ‘Polygon centroids’ algorithm).

Dialoogvenster Parameters
Dit dialoogvenster wordt gebruikt om de waarden voor de invoer in te stellen die het algoritme nodig heeft om te worden uitgevoerd. Het geeft een lijst weer met waarden voor de invoer en parameters voor de configuratie die moeten worden ingesteld. Het heeft natuurlijk een andere inhoud, afhankelijk van de vereisten van het algoritme om te worden uitgevoerd, en wordt automatisch gemaakt, gebaseerd op deze vereisten.
Hoewel het aantal en type parameters afhankelijk is van de karakteristieken van het algoritme, is de structuur voor alle ongeveer hetzelfde. De parameters in de tabel kunnen van een van de volgende types zijn.
Een rasterlaag, om te selecteren uit een lijst van al dergelijke lagen die beschikbaar zijn (momenteel geopend zijn) in QGIS. De selectie bevat ook een knop aan de rechterkant om u bestandsnamen te laten selecteren die lagen vertegenwoordigen die momenteel niet geladen zijn in QGIS.
Een vectorlaag, om te selecteren uit een lijst van alle beschikbare vectorlagen in QGIS. Lagen die niet zijn geladen in QGIS kunnen ook worden geselecteerd, net als in het geval van rasterlagen, maar alleen als het algoritme geen tabelveld vereist uit de attributentabel van de laag. In dat geval kunnen alleen geopende lagen worden geselecteerd, omdat zij geopend moeten zijn om de lijst met beschikbare veldnamen op te kunnen halen.
U zult een knop voor doorlopen zien bij elke vectorlaag om te selecteren, zoals weergegeven in de afbeelding hieronder.
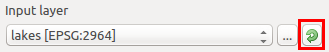
Knop Vector-iteratie
Als het algoritme er verscheidene van bevat, zult u in staat zijn er slechts één van te schakelen. Als de knop die correspondeert met een vectorinvoer wordt geschakeld, zal het algoritme iteratief worden uitgevoerd op elk van zijn objecten, in plaats van slechts één keer voor de gehele laag, net zoveel uitvoer producerend als het aantal keren dat het algoritme wordt uitgevoerd. Dit maakt het mogelijk het proces te automatiseren als alle objecten in een laag afzonderlijk moeten worden verwerkt.
Een tabel, om te selecteren uit een lijst van alle beschikbare in QGIS. Niet ruimtelijke tabellen worden in QGIS geladen als vectorlagen en worden in feite ook als zodanig behandeld door het programma. Momenteel is de lijst van beschikbare tabellen, die u zult zien bij het uitvoeren van een algoritme dat één ervan nodig heeft, beperkt tot tabellen die afkomstig zijn uit bestanden in dBase (.dbf) of indelingen van Comma-Separated Values (.csv).
Een optie, om te kiezen uit een selectielijst met mogelijke opties.
A numerical value, to be introduced in a spin box. You will find a button by its side. Clicking on it, you will open the expression builder that allows you to enter a mathematical expression, so you can use it as a handy calculator. Some useful variables related to data loaded into QGIS can be added to your expression, so you can select a value derived from any of these variables, such as the cell size of a layer or the northernmost coordinate of another one.
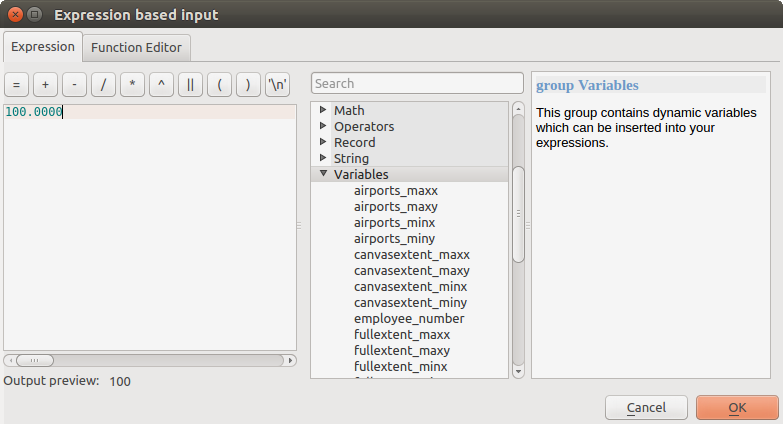
Op expressie gebaseerde invoer
Een bereik, met waarden min en max die moeten worden ingevoerd in twee tekstvakken.
Een tekst-tekenreeks, om te worden ingevoerd in een tekstvak.
Een veld, om te kiezen uit de attributentabel van een vectorlaag of één enkele tabel, geselecteerd in een andere parameter.
A coordinate reference system. You can type the EPSG code directly in the text box, or select it from the CRS selection dialog that appears when you click on the button on the right-hand side.
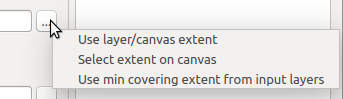
An extent, to be entered by four numbers representing its xmin, xmax, ymin, ymax limits. Clicking on the button on the right-hand side of the value selector, a pop-up menu will appear, giving you three options:
- to select the value from a layer or the current canvas extent,
- to define it by dragging directly onto the map canvas, or
- to use the minimum coverage from all input layers.
Bereikselectie
Als u de eerste optie selecteert, zult u een venster zoals het volgende zien.
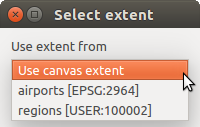
Bereik-lijst
Als u de tweede optie selecteert, zal het venster Parameters zichzelf verbergen, zodat u kunt klikken en slepen in het kaartvenster. Als u de geselecteerde rechthoek heeft gedefinieerd zal het dialoogvenster opnieuw verschijnen en de waarden bevatten in het tekstvak voor het bereik.
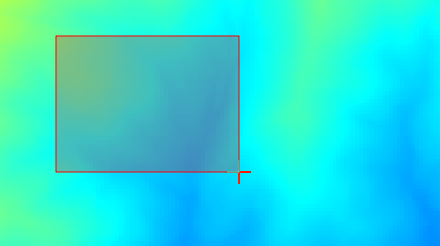
Bereik slepen
A list of elements (whether raster layers, vector layers or tables), to select from the list of such layers available in QGIS. To make the selection, click on the small button on the left side of the corresponding row to see a dialog like the following one.
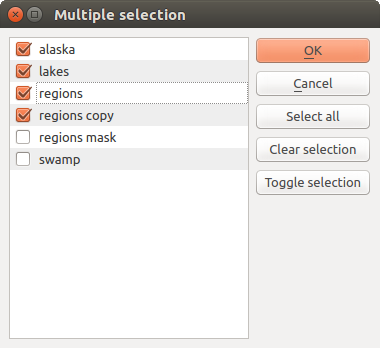
Meervoudige selecties
Een kleine tabel om te worden bewerkt door de gebruiker. Deze worden gebruikt om parameters te definiëren zoals tabellen voor opzoeken of samengevouwde kernen, naast andere.
Klik op de knop aan de rechterkant om de tabel te zien en de waarden ervan te bewerken.
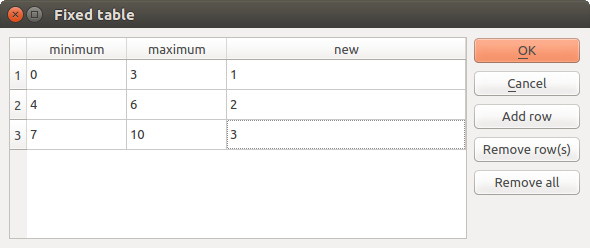
Vaste tabel
Afhankelijk van het algoritme kan het aantal rijen, al dan niet, worden aangepast met de knoppen aan de rechterkant van het venster.
Naast de tab Parameters zult u ook een andere tab zien, genaamd Log. Informatie die wordt verschaft door het algoritme gedurende de uitvoering ervan wordt in deze tab weggeschreven, en stelt u in staat de uitvoering te volgen en in de gaten te houden en meer details te verkrijgen over het algoritme als het wordt uitgevoerd. Onthoud dat niet alle algoritmen informatie naar deze tab wegschrijven, en veel ervan zouden geluidloos kunnen worden uitgevoerd, zonder enige uitvoer te produceren anders dan de uitvoerbestanden.
Aan de rechterkant van het dialoogvenster ziet u een korte beschrijving van het algoritme, wat u zal helpen het doel ervan te begrijpen en de basisideeën erachter. Als een dergelijke beschrijving niet beschikbaar is zal het paneel met de beschrijving niet worden weergegeven.
Some algorithms might have a more detailed help file, which might include description of every parameter it uses, or examples. In that case, you will find a Help tab in the parameters dialog.
Een opmerking over projecties
Algorithms that are run from the processing framework — this is also true for most of the external applications whose algorithms are exposed through it — do not perform any reprojection on input layers and assume that all of them are already in a common coordinate system and ready to be analyzed. Whenever you use more than one layer as input to an algorithm, whether vector or raster, it is up to you to make sure that they are all in the same coordinate system.
Note that, due to QGIS’s on-the-fly reprojecting capabilities, although two layers might seem to overlap and match, that might not be true if their original coordinates are used without reprojecting them onto a common coordinate system. That reprojection should be done manually, and then the resulting files should be used as input to the algorithm. Also, note that the reprojection process can be performed with the algorithms that are available in the processing framework itself.
By default, the parameters dialog will show a description of the CRS of each layer along with its name, making it easy to select layers that share the same CRS to be used as input layers. If you do not want to see this additional information, you can disable this functionality in the Processing settings dialog, unchecking the Show CRS option.
If you try to execute an algorithm using as input two or more layers with unmatching CRSs, a warning dialog will be shown.
U kunt nog steeds het algoritme uitvoeren, maar weet dat dat in de meeste gevallen verkeerde resultaten zal produceren, zoals lege lagen, omdat de invoerlagen elkaar niet overlappen.
Gegevensobjecten gegenereerd door algoritmen
Gegevensobjecten gegenereerd door een algoritme kunnen van één van de volgende typen zijn:
Een rasterlaag
Een vectorlaag
Een tabel
Een HTML-bestand (gebruikt voor tekst en grafische uitvoer)
These are all saved to disk, and the parameters table will contain a text box corresponding to each one of these outputs, where you can type the output channel to use for saving it. An output channel contains the information needed to save the resulting object somewhere. In the most usual case, you will save it to a file, but in the case of vector layers, and when they are generated by native algorithms (algorithms not using external applications) you can also save to a PostGIS or Spatialite database, or a memory layer.
Klik, om een kanaal voor uitvoer te selecteren, eenvoudigweg op de knop aan de rechterkant van het tekstvak, en u zult een klein contextmenu met de beschikbare opties zien.
In de meeste gevallen zult u willen selecteren dat u wilt opslaan naar een bestand. Als u die optie selecteert, zult u in een dialoogvenster Opslaan als worden gevraagd naar het gewenste pad om het bestand op te slaan. Ondersteunde bestandsextensies worden in de selectie voor de bestandsindeling in het dialoogvenster weergegeven, afhankelijk van het soort uitvoer en het algoritme.
The format of the output is defined by the filename extension. The supported formats depend on what is supported by the algorithm itself. To select a format, just select the corresponding file extension (or add it, if you are directly typing the file path instead). If the extension of the file path you entered does not match any of the supported formats, a default extension will be appended to the file path, and the file format corresponding to that extension will be used to save the layer or table. Default extensions are .dbf for tables, .tif for raster layers and .shp for vector layers. These can be modified in the setting dialog, selecting any other of the formats supported by QGIS.
If you do not enter any filename in the output text box (or select the corresponding option in the context menu), the result will be saved as a temporary file in the corresponding default file format, and it will be deleted once you exit QGIS (take care with that, in case you save your project and it contains temporary layers).
You can set a default folder for output data objects. Go to the settings dialog (you can open it from the Processing menu), and in the General group, you will find a parameter named Output folder. This output folder is used as the default path in case you type just a filename with no path (i.e., myfile.shp) when executing an algorithm.
Bij het uitvoeren van een algoritme dat een vectorlaag in iteratieve modus gebruikt, wordt het ingevoerde bestandspad gebruikt als het basispad voor alle gegenereerde bestanden, die worden benoemd met behulp van de basisnaam en de toevoeging van een getal dat de index van de iteratie vertegenwoordigt. De bestandsextensie (en indeling) wordt gebruikt voor alle op die manier gegenereerde bestanden.
Apart from raster layers and tables, algorithms also generate graphics and text as HTML files. These results are shown at the end of the algorithm execution in a new dialog. This dialog will keep the results produced by any algorithm during the current session, and can be shown at any time by selecting Processing ‣ Results viewer from the QGIS main menu.
Sommige externe toepassingen zouden bestanden (zonder bepaalde beperkingen voor de extensie) als uitvoer kunnen hebben, maar zij behoren niet tot de hierboven vermelde categorieën. Deze bestanden voor uitvoer zullen niet worden verwerkt door QGIS (geopend of opgenomen in het huidige project van QGIS), omdat zij meestal niet corresponderen met bestandsindelingen of elementen die worden ondersteund door QGIS. Dit is, bijvoorbeeld, het geval met bestanden van LAS, gebruikt voor de gegevens van LiDAR. De bestanden worden gemaakt maar u zult niets zien in uw nieuwe werksessie van QGIS.
Voor alle andere typen van uitvoer zult u een tekstvak vinden dat u kunt gebruiken om het algoritme te vertellen om het bestand te laden als het eenmaal is gegenereerd door het algoritme of niet. Standaard worden alle bestanden geopend.
Optionele uitvoeren worden ondersteund. Dat is, alle uitvoeren worden gemaakt. Echter, u kunt het corresponderende tekstvak deselecteren als u niet geïnteresseerd bent in een bepaalde uitvoer, wat er in essentie voor zorgt dat het zich gedraagt als een optionele uitvoer (met andere woorden: de laag wordt toch gemaakt, maar als u het tekstvak leeg laat, zal die worden opgeslagen in een tijdelijk bestand en worden verwijderd als u QGIS afsluit).
Configuring the processing framework
As has been mentioned, the configuration menu gives access to a new dialog where you can configure how algorithms work. Configuration parameters are structured in separate blocks that you can select on the left-hand side of the dialog.
Along with the aforementioned Output folder entry, the General block contains parameters for setting the default rendering style for output layers (that is, layers generated by using algorithms from any of the framework GUI components). Just create the style you want using QGIS, save it to a file, and then enter the path to that file in the settings so the algorithms can use it. Whenever a layer is loaded by Processing and added to the QGIS canvas, it will be rendered with that style.
Rendering styles can be configured individually for each algorithm and each one of its outputs. Just right-click on the name of the algorithm in the toolbox and select Edit rendering styles for outputs. You will see a dialog like the one shown next.
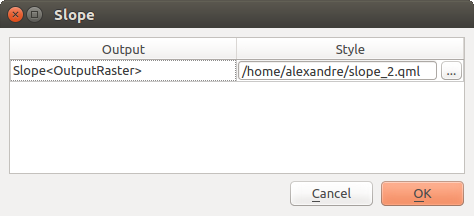
Rendering Styles
Select the style file (.qml) that you want for each output and press [OK].
Other configuration parameters in the General group are listed below:
- Use filename as layer name. The name of each resulting layer created by an algorithm is defined by the algorithm itself. In some cases, a fixed name might be used, meaning that the same output name will be used, no matter which input layer is used. In other cases, the name might depend on the name of the input layer or some of the parameters used to run the algorithm. If this checkbox is checked, the name will be taken from the output filename instead. Notice that, if the output is saved to a temporary file, the filename of this temporary file is usually a long and meaningless one intended to avoid collision with other already existing filenames.
- Keep dialog open after running algorithm. Once an algorithm has finished execution and its output layers are loaded into the QGIS project, the algorithm dialog is closed. If you want to keep it open (to run the algorithm again with different parameters, or to better check the output that is written to the log tab), check this option
- Use only selected features. If this option is selected, whenever a vector layer is used as input for an algorithm, only its selected features will be used. If the layer has no selected features, all features will be used.
- Pre-execution script file and Post-execution script file. These parameters refer to scripts written using the processing scripting functionality, and are explained in the section covering scripting and the console.
Apart from the General block in the settings dialog, you will also find a block for algorithm providers. Each entry in this block contains an Activate item that you can use to make algorithms appear or not in the toolbox. Also, some algorithm providers have their own configuration items, which we will explain later when covering particular algorithm providers.