` `
シンボルライブラリ
スタイル・マネージャ
The Style Manager is the place where users can manage and create generic symbols to be used in several QGIS projects. You can open it with the Settings ‣ Style Manager or from the Style tab in the vector layer’s Properties. It allows users to:
- create, edit and remove symbols
- organize symbols in custom groups
- export and import symbols.
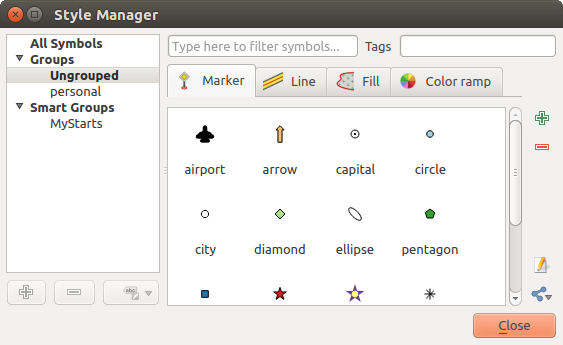
スタイル・マネージャ
Groups and smart groups
You can organize symbols into different categories. These categories, listed in the panel at the left, can be static (called Group) or dynamic (named Smart Group). A group is smart when its symbols are dynamically fetched according to conditions set. See figure_smart_group:
To create a group, right click on an existing group or on the main Groups
directory in the left of the dialog.
You can also select a group and click the  Add Group
button. The new group will be a sub-group of the selected one.
Add Group
button. The new group will be a sub-group of the selected one.
Create Smart Group is similar to creating group, but instead select Smart Groups. The dialog box allows user to choose the expression to select symbols in order to appear in the smart group (contains some tags, member of a group, have a string in its name, etc.). Any symbol that satisfies the entered condition(s) is automatically added to the smart group.
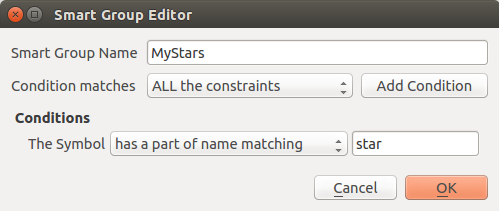
スマートグループを作成する
To remove a group or a smart group, right click on the group and select
Remove Group or select it and push
 Remove Group button.
Unlike the smart groups that automatically fetch their belonged symbols,
simple groups are filled by the user.
To add a symbol into a group, you can either right click on a symbol, choose
Apply Group and then the group name. There is a second
way to add several symbols into a group: just select the group, click
 and choose Group Symbols. All
symbols display a checkbox that allows you to add the symbol into the selected
groups. When selection is finished, you can click the same button, and
choose Finish Grouping.
and choose Group Symbols. All
symbols display a checkbox that allows you to add the symbol into the selected
groups. When selection is finished, you can click the same button, and
choose Finish Grouping.
All the symbols that are not placed under a custom group belong to a default group named Ungrouped.
Add, Edit, Remove Symbol
Selecting a group returns in the right panel, if applicable, the list of symbols of the group (including its subgroups). These symbols are organized in four different tabs:
- Marker for point symbols
- Line for linear symbols
- Fill for surface symbols
- and カラーランプ.
To delete a symbol you no longer need, just select it and click
Remove item (also available through right-click).
The symbol will be deleted from the local symbols database.
The symbol list can be modified by adding new symbols with
Add item button or modifying existing ones with  Edit item.
See シンボルセレクタ for further information.
Edit item.
See シンボルセレクタ for further information.
Share symbols
The  Share item tool, at the right bottom of the Style
Library dialog, offers options to easily share symbols with others: users can
indeed export their symbols and import symbols to their library.
Share item tool, at the right bottom of the Style
Library dialog, offers options to easily share symbols with others: users can
indeed export their symbols and import symbols to their library.
Exporting symbols
You can export the selected symbols to PNG, SVG or XML file formats. Exporting to PNG or SVG (both not available for color ramp symbols) creates a file for each selected symbol, and the SVG folder can be added to SVG Paths in Settings ‣ Options to e.g. share these symbols on a network. The XML format generates a single file containing all the selected symbols. This file can then be imported in another user’s style library.
Importing symbols
You can extend your symbols library by importing new symbols. Just select
Import from the drop-down list at the right bottom of the dialog.
In the new dialog, you’ll need to :
- indicate the source of the symbols (it can be a .xml file on the disk or an url),
- give the name of the group under which the symbols will be put
- select the symbols you want to add to your library
- and press Import.
Note that import and export options are also available through right-click.
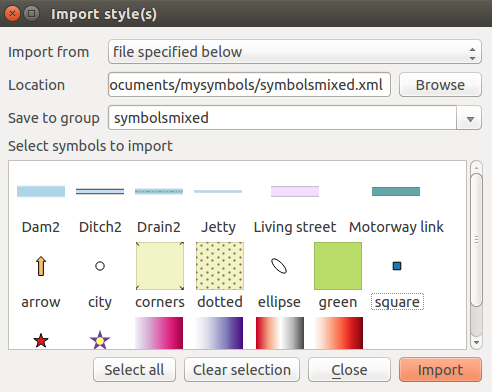
Importing symbols
カラーランプ
The Color ramp tab in the Style Manager presents different types of color ramps you can use to style layers.
カスタムカラーランプを作成するには、カラーランプ]タブをアクティブにし、 項目を追加 ボタンをクリックします。ボタンは、ランプ・タイプを選択するドロップダウンリストを明らかにする:
勾配:開始色と終了色を指定して、 連続的 または 離散的 カラーランプを生成します。ランププレビューをダブルクリックすると、必要な数の中間色ストップを追加できます。
- Random: creates a random set of colors based on range of values for hue, saturation, value and opacity and a number of colors (classes)
- ColorBrewer: a set of predefined discrete color gradients you can custom the number of colors in the ramp
- or cpt-city: an access to a whole catalog of color gradients to locally save as gradient color.
ちなみに
Easily custom the color stops of the gradient color ramp
ランププレビューをダブルクリックするか、カラースポットからランププレビューにドラッグアンドドロップすると、新しいカラーストップが追加されます。各カラーストップは、 カラーセレクタ ウィジェットを使うか、それぞれのパラメーターをプロットすることで微調整できます。また、マウス、矢印キー(より大きい移動の場合は Shift キー)または 相対位置 スピンボックスを使用して位置を変更することもできます。押す ストップを削除 と同様に DEL キーは、選択されたカラーストップを削除します。
You can use the  Invert option while
classifying the data with a color ramp. See figure_color_custom_ramp for an
example of a custom color ramp and figure_color_cpt_city for the cpt-city Colors dialog.
Invert option while
classifying the data with a color ramp. See figure_color_custom_ramp for an
example of a custom color ramp and figure_color_cpt_city for the cpt-city Colors dialog.
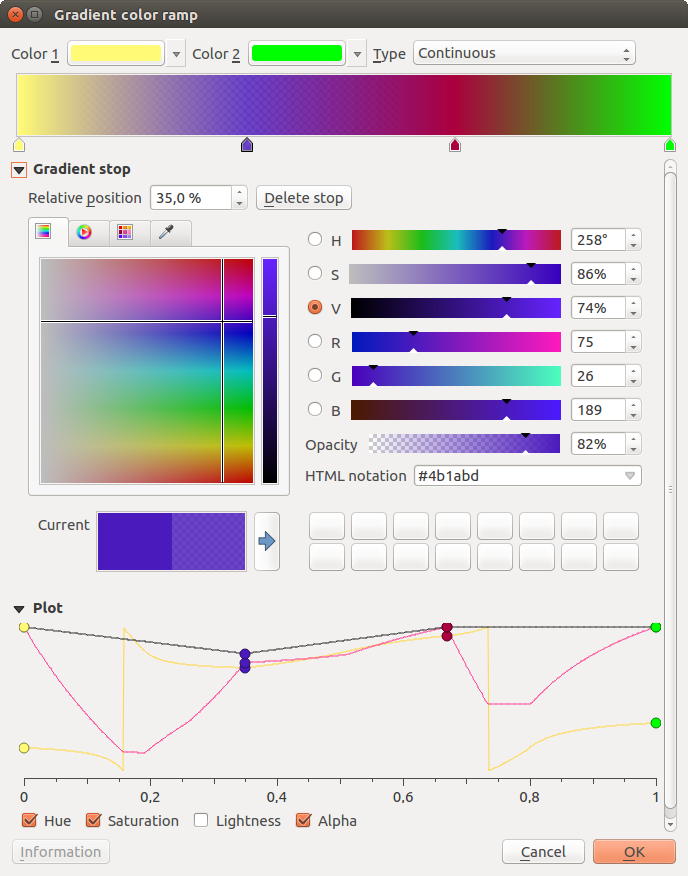
複数のストップを持つカスタムグラデーションのカラーランプの例
The cpt-city option opens a new dialog with hundreds of themes included ‘out of the box’.
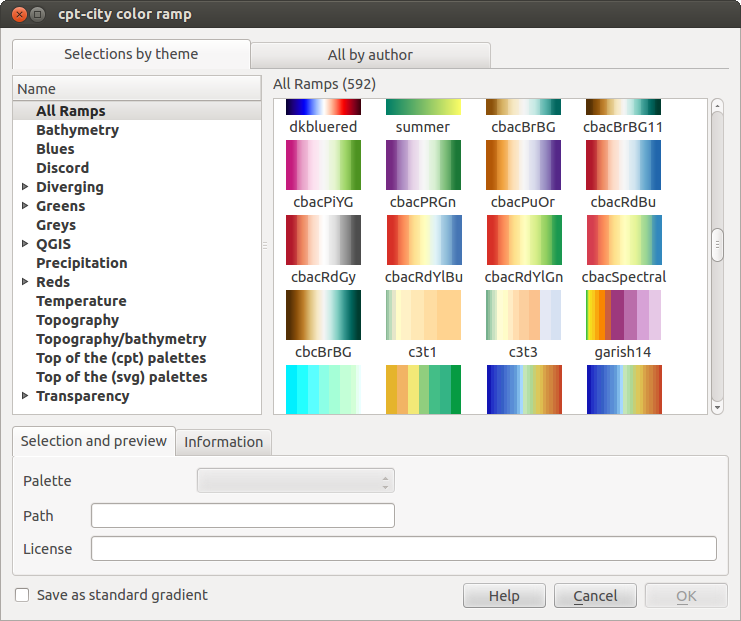
何百ものカラーランプを持つケープタウン市ダイアログ
シンボルセレクタ
シンボルセレクタはシンボルを設計するメインダイアログです。マーカー、ライン、または塗りのシンボルを作成または編集できます。
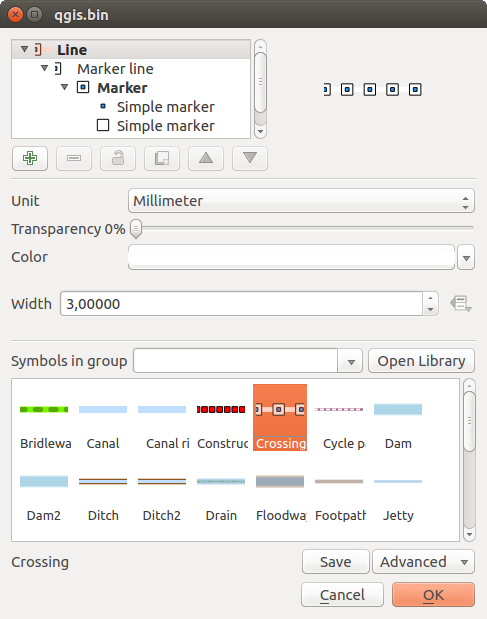
Designing a Marker symbol
2つの主要コンポーネントがシンボルセレクタダイアログを構成します:
新しいグローバルシンボルを形成するために後で結合されるシンボルレイヤーを示すシンボルツリー
ツリー内で選択したシンボルレイヤーを設定するための設定。
シンボルレイヤーツリー
シンボルは、いくつかの シンボルレイヤー で構成できます。シンボルツリーは、後で結合されたこれらのシンボルレイヤーのオーバーレイを示し、新しいグローバルシンボルを形成します。また、シンボルのプロパティが変更されるとシンボル表現はすぐに動的に更新されます。
シンボルツリー項目を管理するためのツールセットが用意されており、選択したレベルに応じてダイアログの下部にさまざまなツールが有効になります。
- 新しいシンボルレイヤーを追加します。好きなだけシンボルを積み重ねることができます
- 選択されたシンボルレイヤーを除去
シンボルレイヤーの色をロック:
 ロックされた色は、ユーザーがグローバル(または上部)シンボルレベルで色を変更したときに変化しないまま
 シンボルレイヤー(複数可) (のグループ)を複製する
シンボルレイヤーを上または下に移動
シンボルを構成する
QGISでは、シンボルの構成は2つのステップで行われます:シンボルとシンボルレイヤー。
シンボル
ツリーの最上位レベルでは、レイヤージオメトリに依存し、 マーカー 、 ライン 、 塗り タイプのいずれかになります。各シンボルは、1つまたは複数のシンボル(他のタイプのシンボルを含む)またはシンボルレイヤーを埋め込むことができます。
グローバルシンボルに適用されるいくつかのパラメーターを設定できます。
- Unit: it can be Millimeter, Pixels or Map unit
透過性
色 :このパラメーターをユーザーが変更したときは、その値は全てロック解除されたサブシンボルの色にエコーされます
マーカーシンボルの サイズ と 回転
ラインシンボルの 幅
ノート
The Data-defined override button beside the last layer-related parameters is inactive when setting the symbol from the Style manager dialog. When the symbol is connected to a map layer, this button offers access to the size assistant dialog which helps to create proportional or multivariate analysis rendering.
The symbols used at this level are items you can pick from the symbols library. A list of available symbols of the same type from your symbol library is shown and can be filtered by selecting a group in the drop-down list just above. Click the Save button to add the designed symbol to your symbol library.
With the Advanced  option, you can:
シンボルレベル を設定します:シンボルレイヤーが地図キャンバスで相互に接続される方法を定義します(詳細は Symbols levels を参照)
ラインと塗りつぶしのシンボルでは、 地物をキャンバス範囲にクリップ 。
ちなみに
シンボルレイヤー ダイアログより低いレベルのサイズを設定した後、シンボル全体のサイズは再び第1レベルの サイズ (マーカーシンボルの場合)または 幅 (ラインシンボルの場合)メニューで変更できることに注意してください。サイズ比を維持しながら、低いレベルの大きさは、それに応じて変化します。
シンボルレイヤー
ツリーの下位レベルでは、シンボルレイヤーをカスタマイズできます。使用可能なシンボルレイヤータイプは、上部シンボルタイプによって異なります。シンボルレイヤーに適用できます  塗り効果 レンダリングを向上させるために。
Because describing all the options of all the symbol layer types would not be possible, only particular and significative ones are mentioned below.
共通パラメーター
いくつかの一般的なオプションとウィジェットは、マーカー、線または塗りつぶしというサブタイプに関係なく、シンボルレイヤーを構築するために使用できます。
カラーセレクタ 色の操作を簡単にするウィジェット
- Units: it can be Millimeter, Pixels or Map unit
ほぼすべてのオプションの近くで
 データ定義の上書き ウィジェット。各シンボルをカスタマイズする機能を拡張しました(詳細は データ定義の上書きの設定 を参照)
ノート
以下の説明では、シンボルレイヤータイプが地物ジオメトリにバインドされていることを前提としていますが、シンボルレイヤーを互いに組み込むことができます。その場合、下位レベルのシンボルレイヤーパラメーター(配置、オフセット...)は、地物ジオメトリ自体ではなく、上位レベルのシンボルにバインドされることがあります。
マーカーシンボル
ポイントジオメトリの地物に適して、マーカーシンボルにはいくつか シンボルレイヤーの種類 があります:
シンプルマーカー (デフォルト);
楕円マーカー:カスタマイズ可能な幅と高さを持つ単純なマーカーシンボルレイヤー。
- Filled marker: similar to the simple marker symbol layer, except that it uses a fill sub symbol to render the marker. This allows use of all the existing QGIS fill (and outline) styles for rendering markers, e.g. gradient or shapeburst fills;
フォントマーカー :インストールされたフォントをマーカーシンボルとして使用します。
ジオメトリジェネレータ ( ジオメトリジェネレータ 参照);
ベクターフィールドマーカー ( ベクタ場マーカー 参照);
SVG marker: provides you with images from your SVG paths (set in Settings ‣ Options ‣ System menu) to render as marker symbol. Each SVG file colors and outline can be adapted.
ノート
カスタマイズ可能なSVGマーカーシンボルの要件
To have the possibility to change the colors of a SVG marker, you have to add the placeholders param(fill) for fill color, param(outline) for outline color and param(outline-width) for stroke width. These placeholders can optionally be followed by a default value, e.g.:
<svg width="100%" height="100%">
<rect fill="param(fill) #ff0000" stroke="param(outline) #00ff00" stroke-width="param(stroke-width) 10" width="100" height="100">
</rect>
</svg>
各マーカーシンボルレイヤータイプについて、次のプロパティのいくつかを設定できます。
- Color for the fill and/or stroke, using all the capabilities of the カラーセレクタ widget;
サイズ
- Outline style
- Outline width
結合スタイル
回転
- Offset X,Y: You can shift the symbol in the x- or y- direction;
アンカーポイント 。
ほとんどのマーカーシンボルダイアログでは、あらかじめ定義されたシンボルのプレビューのあるフレームを選択できます。
ラインシンボル
Appropriate for line geometry features, line symbols have following symbol layer types:
シンプルライン (デフォルト):使用可能な設定は次のとおりです。
色
- Pen width
- Pen style
結合スタイル
線端スタイル
オフセット
- Use custom dash pattern: overrides the Pen
style setting with a custom dash.
矢印 : 構成可能な幅、長さ、厚さを持つ単一または二重の矢頭で、曲線を曲線で描くかどうかを示します。 曲線の矢印を作成するには、線地物には少なくとも3つの頂点が必要です。また、矢印ボディを描画するためにグラデーションやシェイプバーストなどの 塗りつぶしシンボル を使用します。ジオメトリジェネレータと組み合わされたこのタイプのレイヤシンボルは、流れ地図の表示に役立ちます。
ジオメトリジェネレータ ( ジオメトリジェネレータ 参照);
マーカー線 :線に沿ってマーカーシンボルを表示します。それは一定距離またはジオメトリに基づくことができます:最初、最後または各頂点、中心点上またはすべての曲線点上。マーカーシンボルを線に沿ってオフセットを設定したり、線自体をオフセットできます。 マーカーを回転 オプションでは、マーカーシンボルが線の向きに従うかどうかを設定します。
塗りつぶしシンボル
ポリゴンジオメトリ地物に適している塗りつぶしシンボルには、いくつかのシンボルレイヤータイプがあります。
単純な塗り (デフォルト):次の設定を使用できます:
- Fill color
- Outline color
塗りスタイル
- Outline style
- Outline width
結合スタイル
- Offset X,Y
Centroid fill: places a marker symbol at the centroid of the visible feature. The position of the marker may however not be the real centroid of the feature because calculation takes into account the polygon(s) clipped to area visible in map canvas for rendering and ignores holes. Use ジオメトリジェネレータ if you want the exact centroid.
マーカーは、マルチパート地物のすべての部分に配置することも、最大部分に配置することも、ポリゴンの内側に配置することもできます;
Geometry generator (see geometry_generator_symbol);
勾配塗りつぶし :ポリゴンレイヤーを塗りつぶすために、単純な2色勾配または事前定義された 勾配カラーランプ のいずれかに基づいて、放射状、線形または円錐形の勾配を使用します。勾配は、単一の地物ベースで、または地図全体の範囲で回転して適用できます。また、開始点と終了点は、座標を使用して設定することも、(地物または地図の)重心を使用して設定することもできます。
線パターン塗りつぶし :ポリゴンに線シンボルレイヤーのハッチングパターンを塗りつぶします。ラインと地物の境界からのオフセットの間隔を設定できます。
点パターンの塗りつぶし :ポリゴンにマーカーシンボルレイヤーのハッチングパターンを塗りつぶします。ラインと地物の境界からのオフセットの間隔を設定できます。
ラスター画像の塗りつぶし:ポリゴンをタイル状のラスター画像で塗りつぶすことができます。そのオプションには、ファイル名、不透明度、画像サイズ(ピクセル単位、mm単位または地図単位)、座標モード(地物またはビュー)、回転など(データ定義)があります。
SVG 塗りつぶし : SVGマーカー を使用してポリゴンを塗りつぶします;
放射状塗り :このオプションではグラデーションの塗りつぶしをバッファし、グラデーションはポリゴンの境界からポリゴンの中心に向かって描画されます。設定可能なパラメーターには、境界から陰影までの距離、カラーランプまたは単純な2色グラデーションの使用、塗りつぶしとオフセットのオプションのぼかしが含まれます。
輪郭線:矢 : ライン 矢シンボル レイヤーを使用してポリゴン境界を表現します;
輪郭線:マーカー線:マーカー線シンボルレイヤーを使用してポリゴン境界を表します。
輪郭線:単純な線 :単純な線のシンボルレイヤーを使用してポリゴン境界を表します。 線をポリゴンの内側に描画する オプションは、ポリゴンの内側のポリゴンの境界に役立ち、隣接するポリゴンの境界を明確に表現するのに役立ちます。
ノート
ジオメトリタイプがポリゴンであるときは、キャンバスの範囲にライン/ポリゴンの自動クリッピングを無効にできます。このクリッピングが良くないシンボル体系に結果する場合もあります(例えば重心塗りつぶし、重心が常に実際の地物の重心でなければならない)。
ジオメトリジェネレータ
すべてのタイプのシンボルで利用できる ジオメトリジェネレータ シンボルレイヤーは、 式構文 を使用して、レンダリングプロセス中にその場でジオメトリを生成できます。結果として得られたジオメトリは元のジオメトリタイプと一致する必要はなく、複数の異なる変更されたシンボルレイヤーを重ねて追加できます。
いくつかの例:
-- render the centroid of a feature
centroid( $geometry )

-- visually overlap features within a 100 map units distance from a point
-- feature, i.e generate a 100m buffer around the point
buffer( $geometry, 100 )

-- Given polygon layer1( id1, layer2_id, ...) and layer2( id2, fieldn...)
-- render layer1 with a line joining centroids of both where layer2_id = id2
make_line( centroid( $geometry ),
           centroid( geometry( get_feature( 'layer2', 'id2', attribute(
               $currentfeature, 'layer2_id') ) )
         )
ベクタ場マーカー
ベクタ場マーカーは、地面変形、潮流などのベクタ場データを表示するために使用されます。ベクタは、データポイントの選択された属性に従ってスケーリングされ、方向付けされた線(好ましくは矢印)として表示されます。ポイントデータのレンダリングにのみ使用できます。ラインとポリゴンのレイヤーはこのシンボルによって描画されません。
ベクタ場は、データ内の属性によって定義され、次のいずれかの方法で場を表すことができます:
デカルト 成分(フィールドの x と y 成分)
または 極 座標 :この場合、属性は Length と Angle を定義します。角度は、北から時計回りに、または東から反時計回りに測定でき、角度またはラジアンのいずれかになります。
または 高さのみ データとして、データの属性を使用して拡大/縮小された垂直矢印を表示します。これは、例えば変形の垂直成分を表示するのに適しています。
場の大きさは、場を見るために適切なサイズに拡大または縮小できます。