` `
Travailler avec la table d’attributs
The attribute table displays information on features of a selected layer. Each row in the table represents a feature (with or without geometry), and each column contains a particular piece of information about the feature. Features in the table can be searched, selected, moved or even edited.
Foreword: Spatial and non-spatial tables
QGIS allows you to load spatial and non-spatial layers. This currently includes tables supported by OGR and delimited text, as well as the PostgreSQL, MSSQL, SpatiaLite, DB2 and Oracle provider. All loaded layers are listed in the Layers Panel. Whether a layer is spatially enabled or not determines whether you can interact with it on the map.
Non-spatial tables can be browsed and edited using the attribute table view. Furthermore, they can be used for field lookups. For example, you can use columns of a non-spatial table to define attribute values, or a range of values that are allowed, to be added to a specific vector layer during digitizing. Have a closer look at the edit widget in section Fields Properties to find out more.
Introducing the attribute table interface
To open the attribute table for a vector layer, activate the layer by
clicking on it in the Le panneau Couches. Then, from the main
Layer menu, choose  Open Attribute
Table. It is also possible to right-click on the layer and choose
Open Attribute Table from the drop-down menu,
or to click on the Open Attribute Table button
in the Attributes toolbar.
Open Attribute
Table. It is also possible to right-click on the layer and choose
Open Attribute Table from the drop-down menu,
or to click on the Open Attribute Table button
in the Attributes toolbar.
This will open a new window that displays the feature attributes for the layer (figure_attributes_table). According to the setting in Settings ‣ Options ‣ Data sources menu, the attribute table will open in a docked window or a regular window. The total number of features in the layer and the number of currently selected/filtered features are shown in the attribute table title, as well as if the layer is spatially limited.
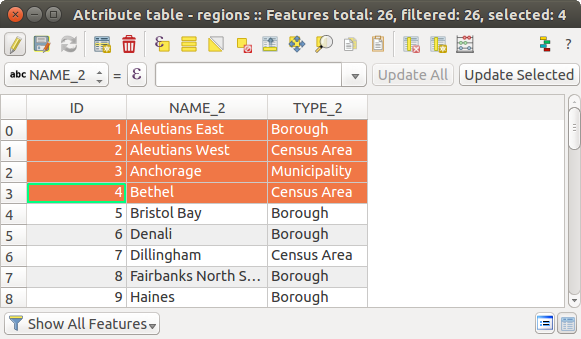
Table d’attributs de la couche ‘regions’
Les boutons situés au-dessus de la table d’attributs apportent les fonctionnalités suivantes :
Icône |
Étiquette |
Fonction |
Raccourci par Défaut |
|---|---|---|---|
 |
Basculer en mode édition |
Activer les fonctions d’édition |
Ctrl+E |
 |
Basculer en mode édition multiple |
Mettre à jour plusieurs champs de plusieurs entités |
|
 |
Enregistrer les modifications |
Enregistrer les modifications en cours |
Ctrl+S |
 |
Recharger la table |
||
 |
Ajouter une entité |
Ajouter une entité non géométrique |
|
 |
Supprimer les entités sélectionnées |
Supprimer les entités sélectionnées de la couche |
|
 |
Sélectionner les entités en utilisant une expression |
||
 |
Tout sélectionner |
Sélectionner toutes les entités de la couche |
Ctrl+A |
 |
Inverser la sélection |
Inverser la sélection en cours dans la couche |
Ctrl+R |
 |
Tout désélectionner |
Désélectionner toutes les entités de la couche courante |
Ctrl+Shift+A |
 |
Filtrer/Sélectionner les entités en utilisant le formulaire |
Ctrl+F | |
 |
Déplacer la sélection au sommet |
Regrouper les objets sélectionnés au début de la table |
|
 |
Centrer la carte sur les lignes sélectionnées |
Ctrl+P | |
 |
Zoomer la carte sur les lignes sélectionnées |
Ctrl+J | |
 |
Copy selected rows to clipboard | Ctrl+C | |
 |
Coller les entités à partir du presse-papier |
Insert new features from copied ones | Ctrl+V |
 |
Nouveau champ |
Add a new field to the data source | Ctrl+W |
 |
Supprimer le champ |
Remove a field from the data source | Ctrl+L |
 |
Ouvrir la calculatrice de champ |
Update field for many features in a row | Ctrl+I |
 |
Mise en forme conditionnelle |
Enable table formatting |
Table d’attributs 1 : Les outils disponibles
Note
Selon le format des données et la version de la bibliothèque OGR compilée avec votre version de QGIS, certains outils pourraient manquer.
Below these buttons is the Quick Field Calculation bar (enabled only in
edit mode), which allows to quickly apply
calculations to all or part of the features in the layer. This bar uses the same
expressions as the Field
Calculator (see Editer les valeurs d’attributs).
Astuce
Skip WKT geometry
If you want to use attribute data in external programs (such as Excel), use the
Copy selected rows to clipboard button.
You can copy the information without vector geometries if you deactivate the
 Copy geometry in WKT representation from attribute table
option in Settings ‣ Options ‣ Data Sources menu.
Copy geometry in WKT representation from attribute table
option in Settings ‣ Options ‣ Data Sources menu.
Table view vs Form view
QGIS provides two view modes to easily manipulate data in the attribute table:
- the Table view, displaying values of multiple features in a
tabular mode, each row representing a feature and each column a field;
- and the
 Form view which shows identifiers of features in a first
panel and displays only the attributes of the clicked identifier in the second
one. Form view uses the layer fields configuration
(see Fields Properties).
Form view which shows identifiers of features in a first
panel and displays only the attributes of the clicked identifier in the second
one. Form view uses the layer fields configuration
(see Fields Properties).
You can switch from one mode to the other by clicking the convenient icon at the bottom right of the dialog.
You can also specify the Default view mode at the opening of the attribute table in Settings ‣ Options ‣ Data Sources menu. It can be ‘Remember last view’, ‘Table view’ or ‘Form view’.
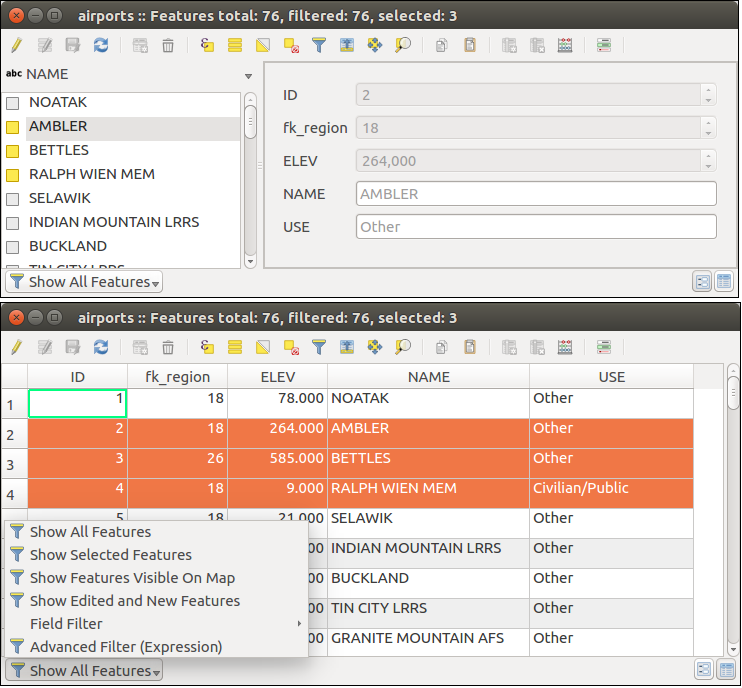
Attribute table in form view (top) vs table view (bottom)
Configuring the columns
Right-click in a column header when in table view to have access to tools that help you configure what can be displayed in the attribute table and how.
Hiding and organizing columns and enabling actions
By right-clicking in a column header, you can choose to hide it from the attribute table. To change several columns behavior at once, unhide a column or change the order of the columns, choose Organize columns .... In the new dialog, you can:
- check/uncheck columns you want to show or hide
- drag-and-drop items to reorder the columns in the attribute table. Note that this change is for the table rendering and does not alter the fields order in the layer datasource
- enable a new virtual Actions column that displays in each row a drop-down box or button list of actions for each row, see Propriétés des Actions for more information about actions.
Resizing columns widths
Columns width can be set through a right-click on the column header and select either:
- Set width... to enter the desired value. By default, the current value is displayed in the widget
- Autosize to resize at the best fit the column.
It can also be changed by dragging the boundary on the right of the column heading. The new size of the column is maintained for the layer, and restored at the next opening of the attribute table.
Sorting columns
The table can be sorted by any column, by clicking on the column header. A small arrow indicates the sort order (downward pointing means descending values from the top row down, upward pointing means ascending values from the top row down). You can also choose to sort the rows with the sort option of the column header context menu and write an expression, e.g. to sort the row using multiple columns you can write concat(col0, col1).
In form view, features identifier can be sorted using the  Sort
by preview expression option.
Sort
by preview expression option.
Astuce
Sorting based on columns of different types
Trying to sort an attribute table based on columns of string and numeric types may lead to unexpected result because of the concat("USE", "ID") expression returning string values (ie, 'Borough105' < 'Borough6'). You can workaround this by using eg concat("USE", lpad("ID", 3, 0)) which returns 'Borough105' > 'Borough006'.
Formatting of table cells using conditions
Conditional formatting settings can be used to highlight in the attribute table features you may want to put a particular focus on, using custom conditions on feature’s:
- geometry (e.g., identifying multi-parts features, small area ones or in a defined map extent...);
- or field value (e.g., comparing values to a threshold, identifying empty cells...)
You can enable the conditional formatting panel clicking on
at the top right of the attributes window in table
view (not available in form view).
The new panel allows user to add new rules to format rendering of
 Field or
  Full row.
Adding new rule opens a form to define:
Full row.
Adding new rule opens a form to define:
- the name of the rule;
- a condition using any of the expression builder functions;
- the formatting: it can be choosen from a list of predefined formats or created
based on properties like:
couleurs d’arrière-plan et du texte;
utilisation d’une Icône;
texte en gras, italique, souligné ou barré;
police.
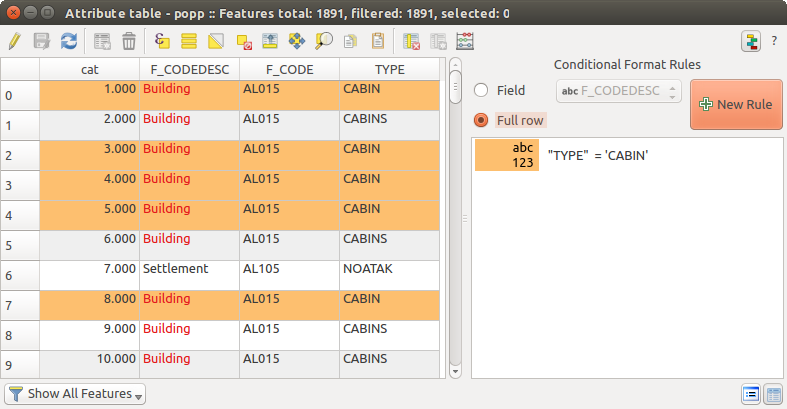
Mise en forme conditionnelle des cellules de la table d’attributs
Interacting with features in an attribute table
Sélectionner des entités
In table view, each row in the attribute table displays the attributes of a unique feature in the layer. Selecting a row selects the feature and likewise, selecting a feature in the map canvas (in case of geometry enabled layer) selects the row in the attribute table. If the set of features selected in the map canvas (or attribute table) is changed, then the selection is also updated in the attribute table (or map canvas) accordingly.
Les lignes peuvent être sélectionnées en cliquant sur le numéro de ligne placé tout à gauche. Plusieurs lignes peuvent être sélectionnées en maintenant la touche Ctrl. Une sélection continue s’effectue en gardant appuyée la touche Shift et en cliquant sur une nouvelle ligne, toutes les lignes entre la première sélection et la dernière seront sélectionnées. Déplacer la position du curseur dans la table d’attributs en cliquant sur une cellule ne modifie pas la sélection des lignes. Modifier les entités sélectionnées depuis la carte ne modifie pas la position du curseur dans la table.
In form view of the attribute table, features are by default identified in the left panel by the value of their displayed field (see Propriétés des Infobulles). This identifier can be replaced using the drop-down list at the top of the panel, either by selecting an existing field or using a custom expression. You can also choose to sort the list of features from the drop-down menu.
Click a value in the left panel to display the feature’s attributes in the right one. To select a feature, you need to click inside the square symbol at the left of the identifier. By default, the symbol turns into yellow. Like in the table view, you can perform multiple feature selection using the keyboard combinations previously exposed.
Beyond selecting features with the mouse, you can perform automatic selection based on feature’s attribute using tools available in the attribute table toolbar, such as (see section Automatic selection and following one for more information and use case):
- Sélectionner à l’aide d’une expression...
 Sélectionner des entités par valeur...
- :guilabel:` Désélectionner toutes les entités`
- Sélectionner toutes les entités
- Inverser la sélection des entités.
It is also possible to select features using the Filtering and selecting features using forms.
Filtrer les entités
Once you have selected features in the attribute table, you may want to display only these records in the table. This can be easily done using the Show Selected Features item from the drop-down list at the bottom left of the attribute table dialog. This list offers the following filters:
:guilabel:` Montrer toutes les entités`
:guilabel:` Ne montrer que les entités sélectionnées`
:guilabel:` Ne montrer que les entités visibles sur la carte`
:guilabel:` Ne montrer que les entités nouvelles ou éditées`
- Field Filter - allows the user to filter based on value of a field: choose a column from a list, type a value and press Enter to filter. Then, only the matching features are shown in the attribute table.
- Advanced filter (Expression) - Opens the expression builder dialog. Within it, you can create complex expressions to match table rows. For example, you can filter the table using more that one field. See Expressions for more information.
It is also possible to filter features using the Filtering and selecting features using forms.
Note
Filtering records out of the attribute table does not filter features out of the layer; they are simply momentaneously hidden from the table and can be accessed from the map canvas or by removing the filter. For filters that do hide features from the layer, use the Query Builder.
Astuce
Update datasource filtering with Show Features Visible on Map
When for performance reasons, features shown in attribute table are spatially limited to the canvas extent at its opening (see Data Source Options for a how-to), selecting Show Features Visible on Map on a new canvas extent updates the spatial restriction.
Filtering and selecting features using forms
Clicking the Filter/Select features using form or
pressing Ctrl+F the attribute table dialog will switch to form view
and all widgets are replaced with their search variant.
From this point onwards, this tool functionality is similar to the one described in the Sélectionner des Entités par Valeur, where you can find descriptions of all operators and selecting modes.
Moreover, in the attribute table case, there is also a Filter features button that allows filtering features instead of selecting them (by creating an Advanced Filter (Expression) for the user).
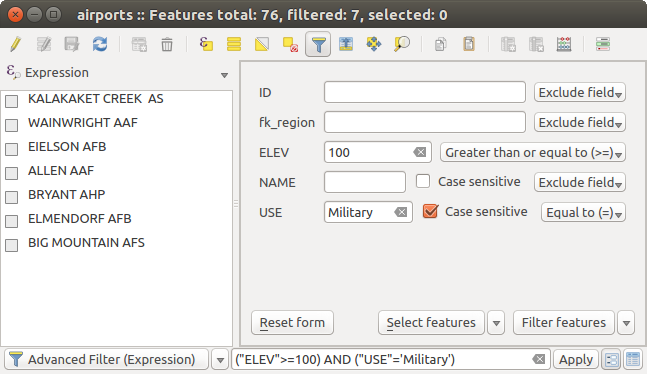
Attribute table filtered by the filter form
If there are already filtered features, you can refine the filter using the drop-down list next to the Filter features button. The options are:
Filtre incluant (“AND”)
Filtre exclusif (“OR”)
To clear the filter, either select Show all features option mentioned in Filtrer les entités, or click the clear the expression and click [Apply].
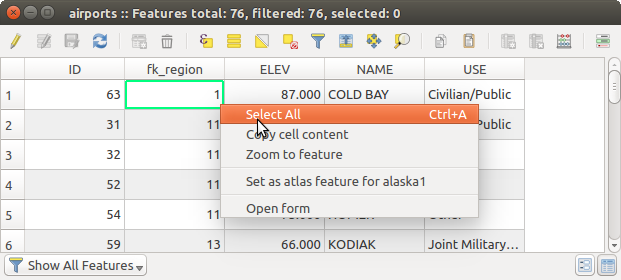
Using action on features
Users have several possibilities to manipulate feature with the contextual menu like:
- Select all (Ctrl+A) the features
- Copy the content of a cell in the clipboard with Copy cell content.
- Zoom to feature without having to select it beforehand
- Open form. It toggles attribute table into form view with a focus on the clicked feature
Copy cell content button
If you want to use attribute data in external programs (such as Excel,
LibreOffice, QGIS or a custom web application), select one or more row(s) and
use the Copy selected rows to clipboard button or press
Ctrl+C.
In Settings ‣ Options ‣ Data Sources menu you can define the format to paste to with Copy features as dropdown list:
- Plain text, no geometry,
- Plain text, WKT geometry,
- GeoJSON
You can also display a list of actions in this contextual menu. This is enabled in the Layer properties ‣ Actions tab. See Propriétés des Actions for more information on actions.
Saving selected features as new layer
The selected features can be saved as any OGR-supported vector format and
also transformed into another coordinate reference system (CRS). In the
contextual menu of the layer, from the Layers Panel, click on
Save as to define the name of the output file, its format
and CRS (see section Creating new layers from an existing layer). To save the selection ensure
that the Save only selected features is selected.
It is also possible to specify OGR creation options within the dialog.
Editer les valeurs d’attributs
Editing attribute values can be done by:
- typing the new value directly in the cell, whether the attribute table is in table or form view. Changes are hence done cell by cell, feature by feature;
- using the field calculator: update in a row a field that may already exist or to be created but for multiple features; it can be used to create virtual fields.
- using the quick field calculation bar: same as above but for only existing field
- or using the multi edit mode: update in a row multiple fields for multiple features.
Using the Field Calculator
The Field Calculator button in the attribute table
allows you to perform calculations on the basis of existing attribute values or
defined functions, for instance, to calculate length or area of geometry
features. The results can be written to a new attribute field, a virtual field,
or they can be used to update values in an existing field.
La calculatrice de champ fonctionne avec toutes les couches qui gèrent le mode édition. Lorsque vous cliquez sur le bouton de la calculatrice de champ, la fenêtre s’ouvre (voir figure_field_calculator). Si la couche n’est pas en mode édition, un avertissement s’affiche et l’utilisation de la calculatrice de champ basculera automatiquement la couche en édition avant d’effectuer le calcul.
Based on the Expression Builder dialog, the field calculator dialog offers a complete interface to define an expression and apply it to an existing or a newly created field. To use the field calculator dialog, you first must select whether you want to only update selected features, create a new attribute field where the results of the calculation will be added or update an existing field.
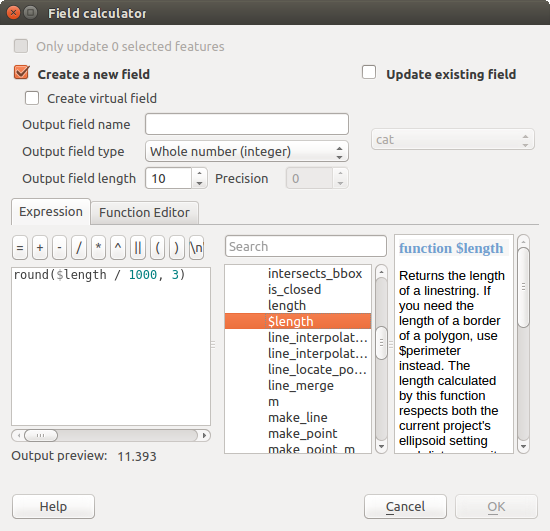
Calculatrice de champ
If you choose to add a new field, you need to enter a field name, a field type (integer, real, date or string) and if needed, the total field length and the field precision. For example, if you choose a field length of 10 and a field precision of 3, it means you have 6 digits before the dot, then the dot and another 3 digits for the precision.
L’exemple suivant montre comment la calculatrice de champs fonctionne. Il s’agit de calculer la longueur en km de la couche railroads issue de l’échantillon de données QGIS.
Chargez le fichier shapefile railroads.shp dans QGIS et ouvrez sa
Table d’Attributs.Cliquez sur
Basculer en mode édition et ouvrez la Calculatrice de champs.Cochez la case
Créer un nouveau champ pour enregistrer le résultat des calculs dans un nouveau champ.Ajoutez longueur dans le nom de ce champ, réel en tant que type et définissez une longueur de 10 et une précision de 3.
Double-cliquez maintenant sur la fonction $length de la catégorie Géometrie pour l’ajouter à la zone d’Expression.
- Complete the expression by typing / 1000 in the Field calculator expression box and click [Ok].
Vous pouvez maintenant voir la nouvelle colonne longueur dans la table d’attributs.
Creating a Virtual Field
A virtual field is a field based on an expression calculated on the fly, meaning that its value is automatically updated as soon as the underlying parameter changes. The expression is set once; you no longer need to recalculate the field each time underlying values change. For example, you may want to use a virtual field if you need area to be evaluated as you digitize features or to automatically calculate a duration between dates that may change (e.g., using now() function).
Note
Utilisation des Champs Virtuels
Les champs virtuels ne sont pas des attributs permanents, ils ne sont sauvegardés et disponibles que dans le projet dans lequel ils ont été créés.
Un champ est défini comme virtuel uniquement à sa création et l’expression utilisée pour le générer ne peut pas être modifiée par la suite : pour le faire, vous devez supprimer et recréer le champ.
Using the Quick Field Calculation Bar
While Field calculator is always available, the quick field calculation bar on top of the attribute table is only visible if the layer is in edit mode. Thanks to the expression engine, it offers a quicker access to edit an already existing field.
In quick field calculation bar, you simply need to:
- select the existing field name in the drop-down list
- fill the textbox with an expression you directly write or build using the
 expression button
 - and click on [Update All], [Update Selected] or [Update Filtered] button according to your need.
Editing multiple fields
Contrairement aux outils précédents, le mode d’édition multiple permet d’éditer simultanément plusieurs champs de plusieurs entités. Une fois la couche basculée en mode édition, les options d’édition multiple sont accessibles:
- using the Toggle multi edit mode button from the toolbar
inside the attribute table dialog,
soit en sélectionnant depuis le menu Edition ‣
Modifier les attributs des entités sélectionnées.
Afin de modifier d’une traite plusieurs champs:
select the features you want to edit;
from the attribute table toolbar, click the
button. This will
toggle the dialog to its form view. Feature selection could also be made
at this step;at the right side of the attribute table, fields (and values) of selected features are shown. New widgets appear next to each field allowing for display of the current multi edit state:
 the field contains different values for selected
features. It’s shown empty and each feature will keep its original value.
You can reset the value of the field from the drop-down list of the widget.
the field contains different values for selected
features. It’s shown empty and each feature will keep its original value.
You can reset the value of the field from the drop-down list of the widget. all selected features have the same value for this
field and the value displayed in the form will be kept.
all selected features have the same value for this
field and the value displayed in the form will be kept. the field has been edited and the entered value
will be applied to all the selected features. A message appears at the top
of the dialog, inviting you to either apply or reset your modification.
the field has been edited and the entered value
will be applied to all the selected features. A message appears at the top
of the dialog, inviting you to either apply or reset your modification.
Clicking any of these widgets allows you to either set the current value for the field or reset to original value, meaning that you can roll back changes on a field-by-field basis.
make the changes to the fields you want and click on Apply changes in the upper message text or any other feature in the left panel.
Changes will apply to all selected features. If no feature is selected, the
whole table is updated with your changes. Modifications are made as a single
edit command. So pressing  Undo will rollback the attribute
changes for all selected features at once.
Undo will rollback the attribute
changes for all selected features at once.
Note
Unlike the tool from the attribute table, hitting the Edit ‣ Modify Attributes of Selected Features option provides you with a modal dialog to fill attributes changes. Hence, features selection is required before execution.
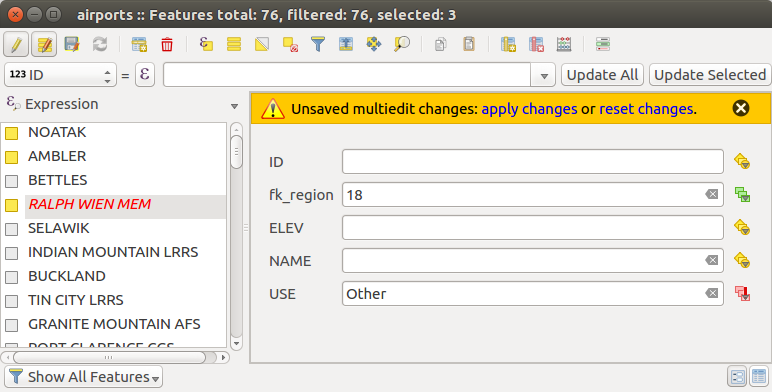
Mettre à jour des champs de plusieurs entités
Note
Le mode d’édition multiple n’est disponible que pour les formulaires auto-générés ou en conception par glisser/déposer (voir Customize a form for your data); il n’est pas disponible pour les formulaires par fichiers ui personnalisés.
Créer des relations un ou plusieurs à plusieurs
Utiliser des relations est courant dans les bases de données. L’idée est que des entités (lignes) de différentes couches (tables) peuvent être liées les unes aux autres.
Introducing 1-N relations
Comme exemple, nous prendrons une couche contenant toutes les régions de l’Alaska (des polygones) qui fournit quelques attributs sur le nom, le type de région et un identifiant unique (qui jouera le rôle de clé primaire).
Nous prenons ensuite une autre couche de point ou une table contenant des informations sur les aéroports localisés dans les régions. Si vous souhaitez accéder, depuis la couche des régions, vous devez créer une relation ‘un à plusieurs’, en utilisant des clés étrangères, car il y a plusieurs aéroports dans la plupart des régions.
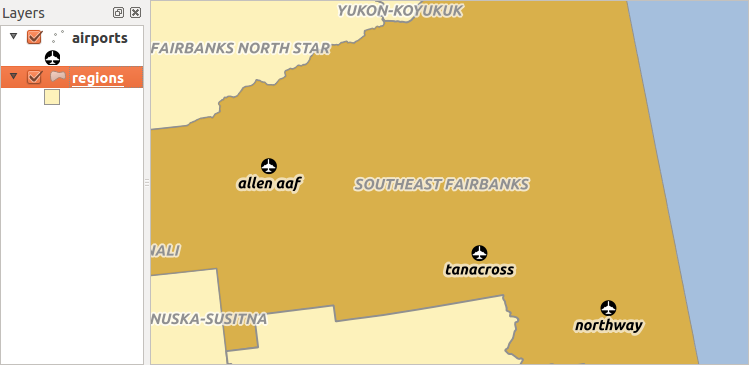
Les régions d’Alaska contenant des aéroports
Layers in 1-N relations
QGIS makes no difference between a table and a vector layer. Basically, a vector layer is a table with a geometry. So you can add your table as a vector layer. To demonstrate the 1-n relation, you can load the regions shapefile and the airports shapefile which has a foreign key field (fk_region) to the layer regions. This means, that each airport belongs to exactly one region while each region can have any number of airports (a typical one to many relation).
Foreign keys in 1-N relations
En plus des attributs existants dans la table des aéroports, un autre champ, fk_region, va jouer le rôle de clé étrangère (si la table est stockée dans une base de données, vous allez sans doute définir une contrainte sur ce champ).
Ce champ fk_region contiendra toujours un identifiant de région. Il peut être vu comme un pointeur vers la région à laquelle l’aéroport appartient. Et vous pouvez créer un formulaire personnalisé d’édition pour la saisie. Cela fonctionne avec différents fournisseurs (vous pouvez vous en servir également avec des shapefiles ou des fichiers csv) et la seule chose que vous avez à faire est de dire à QGIS qu’il y a une relation entre les tables.
Defining 1-N relations (Relation Manager)
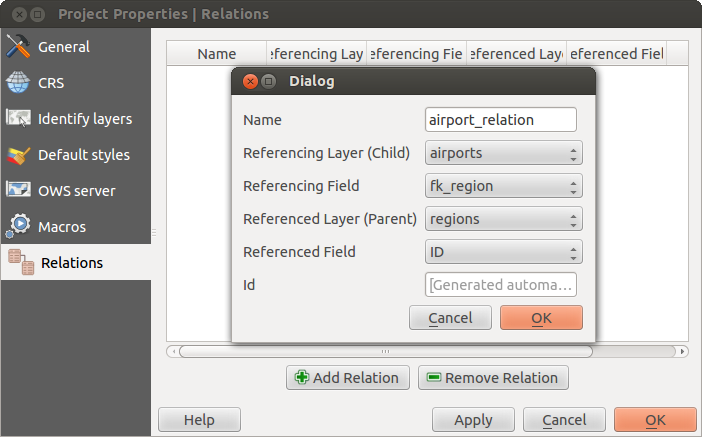
The first thing we are going to do is to let QGIS know about the relations between the layers. This is done in Project ‣ Project Properties.... Open the Relations tab and click on [Add Relation].
- name is going to be used as a title. It should be a human readable string, describing, what the relation is used for. We will just call say Airports in this case.
- referencing layer also considered as child layer, is the one with the foreign key field on it. In our case, this is the airports layer
- referencing field will say, which field points to the other layer so this is fk_region in this case
- referenced layer also considered as parent layer, is the one with the primary key, pointed to, so here it is the regions layer
- referenced field is the primary key of the referenced layer so it is ID
- id will be used for internal purposes and has to be unique. You may need it to build custom forms. If you leave it empty, one will be generated for you but you can assign one yourself to get one that is easier to handle.
Gestionnaire de Relations
Forms for 1-N relations
Maintenant que QGIS a bien généré la relation, le formulaire d’édition va être amélioré. Nous n’avons pas modifié le formulaire d’édition par défaut (généré automatiquement), une nouvelle zone va simplement être ajoutée au formulaire. Sélectionnez la couche de régions dans la légende et utilisez l’outil d’identification. Selon vos préférences, le formulaire s’ouvre directement ou vous devez le faire via la zone d’identification qui s’affiche.
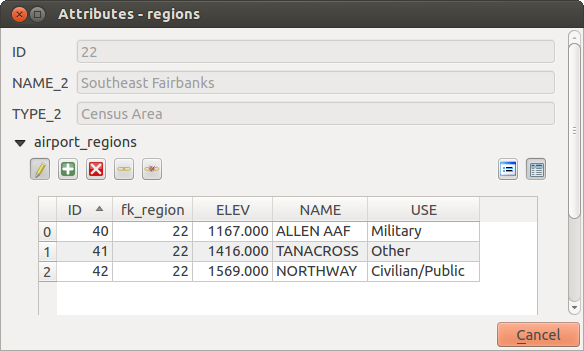
Formulaire de la couche des régions affichant la relation avec les aéroports
As you can see, the airports assigned to this particular region are all shown in a table. And there are also some buttons available. Let’s review them shortly
Le bouton
permet de passer en mode édition. Soyez conscients qu’il active le mode édition de la couche des aéroports bien qu’il soit situé dans le formulaire de la couche des régions. La table affiche bien les entités de la couche des aéroports.- The
 button will add a new feature to the airport layer. And it will
assign the new airport to the current region by default.
button will add a new feature to the airport layer. And it will
assign the new airport to the current region by default. - The
 button will delete the selected airport permanently.
 Le bouton
 ouvre une nouvelle fenêtre où vous pouvez sélectionner des aéroports existants et qui seront ensuite attribués à la région identifiée. Ceci est pratique lorsque vous assignez par erreur la mauvaise région à un aéroport.
Le bouton
 permet de supprimer le lien entre l’aéroport sélectionné et la région identifiée, le laissant non assigné (la clé étrangère devient alors NULL).
- The two buttons to the right switch between table view and form view where the later let’s you view all the airports in their respective form.
If you work on the airport table, a new widget type is available which lets you embed the feature form of the referenced region on the feature form of the airports. It can be used when you open the layer properties of the airports table, switch to the Fields menu and change the widget type of the foreign key field ‘fk_region’ to Relation Reference.
Vous devriez ainsi voir que le formulaire de la région est inclus dans celui d’un aéroport et il vous permet de modifier la région assignée à l’aéroport.
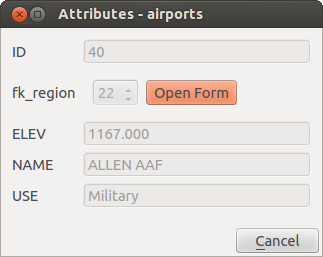
Formulaire d’identification d’un aéroport et de sa région associée
Introducing many-to-many (N-M) relations
N-M relations are many-to-many relation between two tables. For instance, the airports and airlines layers: an airport receives several airline companies and an airline company flies to several airports.
In such case, we need a pivot table to list all airlines for all airports. In QGIS, you should setup two one-to-many relations as explained above:
- a relation between airlines table and the pivot table;
- and a second one between airports table and the pivot table.
When we add a new child (i.e. a company to an airport), QGIS will add a new row in the pivot table and in the airlines table. If we link a company to an airport, QGIS will only add a row in the pivot table.
In case you want to remove a link, an airline or an airport, QGIS won’t remove the row in the pivot table. The database administrator should add a ON DELETE CASCADE instruction in the foreign key constraint:
ALTER TABLE location.airlines
ADD CONSTRAINT location_airlines_airports_id_fkey
   FOREIGN KEY (id)
      REFERENCES location.airports(id)
         ON DELETE CASCADE;
Note
Combining N-M relation with automatic transaction group
You should enable the transaction mode in Project Properties ‣ Data Sources ‣ when working on such context. QGIS should be able to add or update row(s) in all tables (airlines, airports and the pivot tables).
Finally, adding such relations in a form is done in the same way that for a one-to-many relation. The Relations panel in the Fields properties of the vector layer will let the user add the relation in the form. It will appear as a Many to many relation.