` `
Mit Attributtabelle arbeiten
The attribute table displays information on features of a selected layer. Each row in the table represents a feature (with or without geometry), and each column contains a particular piece of information about the feature. Features in the table can be searched, selected, moved or even edited.
Foreword: Spatial and non-spatial tables
QGIS allows you to load spatial and non-spatial layers. This currently includes tables supported by OGR and delimited text, as well as the PostgreSQL, MSSQL, SpatiaLite, DB2 and Oracle provider. All loaded layers are listed in the Layers Panel. Whether a layer is spatially enabled or not determines whether you can interact with it on the map.
Non-spatial tables can be browsed and edited using the attribute table view. Furthermore, they can be used for field lookups. For example, you can use columns of a non-spatial table to define attribute values, or a range of values that are allowed, to be added to a specific vector layer during digitizing. Have a closer look at the edit widget in section Fields Properties to find out more.
Introducing the attribute table interface
To open the attribute table for a vector layer, activate the layer by
clicking on it in the Layers Panel. Then, from the main
Layer menu, choose  Open Attribute
Table. It is also possible to right-click on the layer and choose
Open Attribute Table from the drop-down menu,
or to click on the Open Attribute Table button
in the Attributes toolbar.
Open Attribute
Table. It is also possible to right-click on the layer and choose
Open Attribute Table from the drop-down menu,
or to click on the Open Attribute Table button
in the Attributes toolbar.
This will open a new window that displays the feature attributes for the layer (figure_attributes_table). According to the setting in Settings ‣ Options ‣ Data sources menu, the attribute table will open in a docked window or a regular window. The total number of features in the layer and the number of currently selected/filtered features are shown in the attribute table title, as well as if the layer is spatially limited.
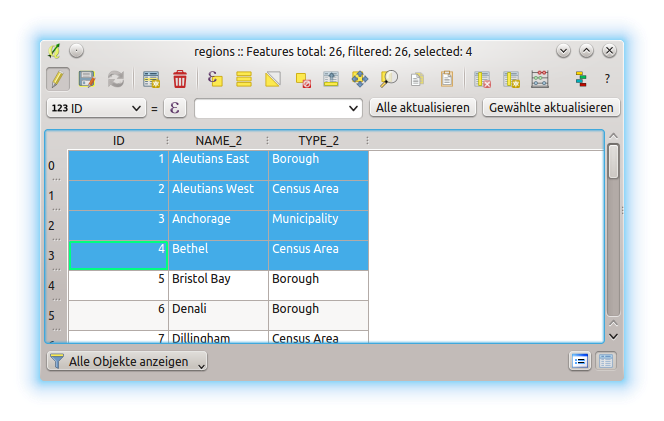
Attributtabelle des regions Layer
Die anderen Knöpfe im Kopf der Attributtabelle stellen die folgenden Funktionalitäten zur Verfügung:
| Icon | Label | Purpose | Default Shortcut |
|---|---|---|---|
 |
Toggle editing mode | Enable editing functionalities | Ctrl+E |
 |
Toggle multi edit mode | Update multiple fields of many features | |
 |
Save Edits | Save current modifications | Ctrl+S |
 |
Reload the table | ||
 |
Add feature | Add new geometryless feature | |
 |
Delete selected features | Remove selected features from the layer | |
 |
Select features using an Expression | ||
 |
Select All | Select all features in the layer | Ctrl+A |
 |
Invert selection | Invert the current selection in the layer | Ctrl+R |
 |
Deselect all | Deselect all features in the current layer | Ctrl+Shift+A |
 |
Filter/Select features using form | Ctrl+F | |
 |
Move selected to top | Move selected rows to the top of the table | |
 |
Pan map to the selected rows | Ctrl+P | |
 |
Zoom map to the selected rows | Ctrl+J | |
 |
Copy selected rows to clipboard | Ctrl+C | |
 |
Paste features from clipboard | Insert new features from copied ones | Ctrl+V |
 |
New field | Add a new field to the data source | Ctrl+W |
 |
Delete field | Remove a field from the data source | Ctrl+L |
 |
Open field calculator | Update field for many features in a row | Ctrl+I |
 |
Conditional formatting | Enable table formatting |
Table Attribute 1: Available Tools
Bemerkung
Depending on the format of the data and the OGR library built with your QGIS version, some tools may not be available.
Below these buttons is the Quick Field Calculation bar (enabled only in
edit mode), which allows to quickly apply
calculations to all or part of the features in the layer. This bar uses the same
expressions as the Field
Calculator (see Editiere Attributwerte).
Tipp
Skip WKT geometry
If you want to use attribute data in external programs (such as Excel), use the
Copy selected rows to clipboard button.
You can copy the information without vector geometries if you deactivate the
 Copy geometry in WKT representation from attribute table
option in Settings ‣ Options ‣ Data Sources menu.
Copy geometry in WKT representation from attribute table
option in Settings ‣ Options ‣ Data Sources menu.
Table view vs Form view
QGIS provides two view modes to easily manipulate data in the attribute table:
- the Table view, displaying values of multiple features in a
tabular mode, each row representing a feature and each column a field;
- and the
 Form view which shows identifiers of features in a first
panel and displays only the attributes of the clicked identifier in the second
one. Form view uses the layer fields configuration
(see Fields Properties).
Form view which shows identifiers of features in a first
panel and displays only the attributes of the clicked identifier in the second
one. Form view uses the layer fields configuration
(see Fields Properties).
You can switch from one mode to the other by clicking the convenient icon at the bottom right of the dialog.
You can also specify the Default view mode at the opening of the attribute table in Settings ‣ Options ‣ Data Sources menu. It can be ‘Remember last view’, ‘Table view’ or ‘Form view’.
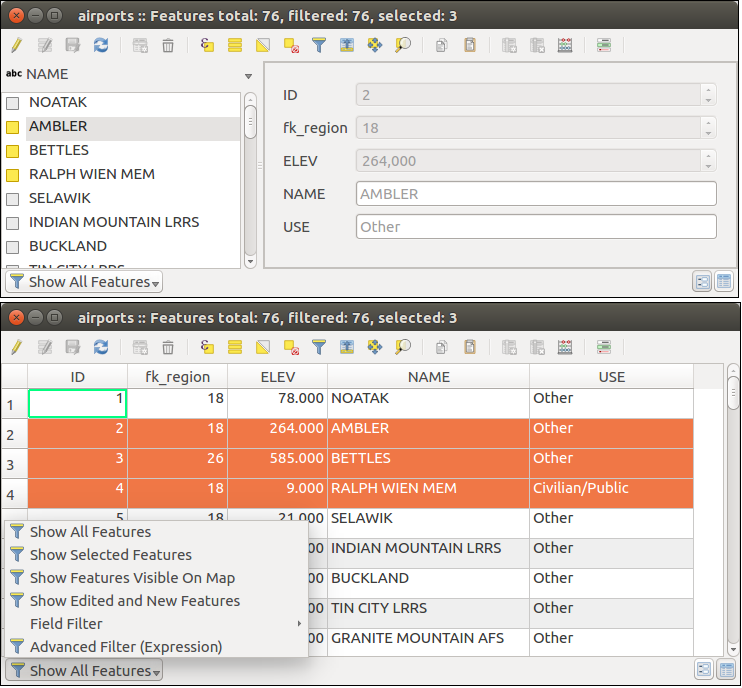
Attribute table in form view (top) vs table view (bottom)
Configuring the columns
Right-click in a column header when in table view to have access to tools that help you configure what can be displayed in the attribute table and how.
Hiding and organizing columns and enabling actions
By right-clicking in a column header, you can choose to hide it from the attribute table. To change several columns behavior at once, unhide a column or change the order of the columns, choose Organize columns .... In the new dialog, you can:
- check/uncheck columns you want to show or hide
- drag-and-drop items to reorder the columns in the attribute table. Note that this change is for the table rendering and does not alter the fields order in the layer datasource
- enable a new virtual Actions column that displays in each row a drop-down box or button list of actions for each row, see Actions Properties for more information about actions.
Resizing columns widths
Columns width can be set through a right-click on the column header and select either:
- Set width... to enter the desired value. By default, the current value is displayed in the widget
- Autosize to resize at the best fit the column.
It can also be changed by dragging the boundary on the right of the column heading. The new size of the column is maintained for the layer, and restored at the next opening of the attribute table.
Sorting columns
The table can be sorted by any column, by clicking on the column header. A small arrow indicates the sort order (downward pointing means descending values from the top row down, upward pointing means ascending values from the top row down). You can also choose to sort the rows with the sort option of the column header context menu and write an expression, e.g. to sort the row using multiple columns you can write concat(col0, col1).
In form view, features identifier can be sorted using the  Sort
by preview expression option.
Sort
by preview expression option.
Tipp
Sorting based on columns of different types
Trying to sort an attribute table based on columns of string and numeric types may lead to unexpected result because of the concat("USE", "ID") expression returning string values (ie, 'Borough105' < 'Borough6'). You can workaround this by using eg concat("USE", lpad("ID", 3, 0)) which returns 'Borough105' > 'Borough006'.
Formatting of table cells using conditions
Conditional formatting settings can be used to highlight in the attribute table features you may want to put a particular focus on, using custom conditions on feature’s:
- geometry (e.g., identifying multi-parts features, small area ones or in a defined map extent...);
- or field value (e.g., comparing values to a threshold, identifying empty cells...)
You can enable the conditional formatting panel clicking on
at the top right of the attributes window in table
view (not available in form view).
The new panel allows user to add new rules to format rendering of
 Field or
  Full row.
Adding new rule opens a form to define:
Full row.
Adding new rule opens a form to define:
- the name of the rule;
- a condition using any of the expression builder functions;
- the formatting: it can be choosen from a list of predefined formats or created
based on properties like:
- background and text colors;
- use of icon;
- bold, italic, underline, or strikeout;
Schriftart.
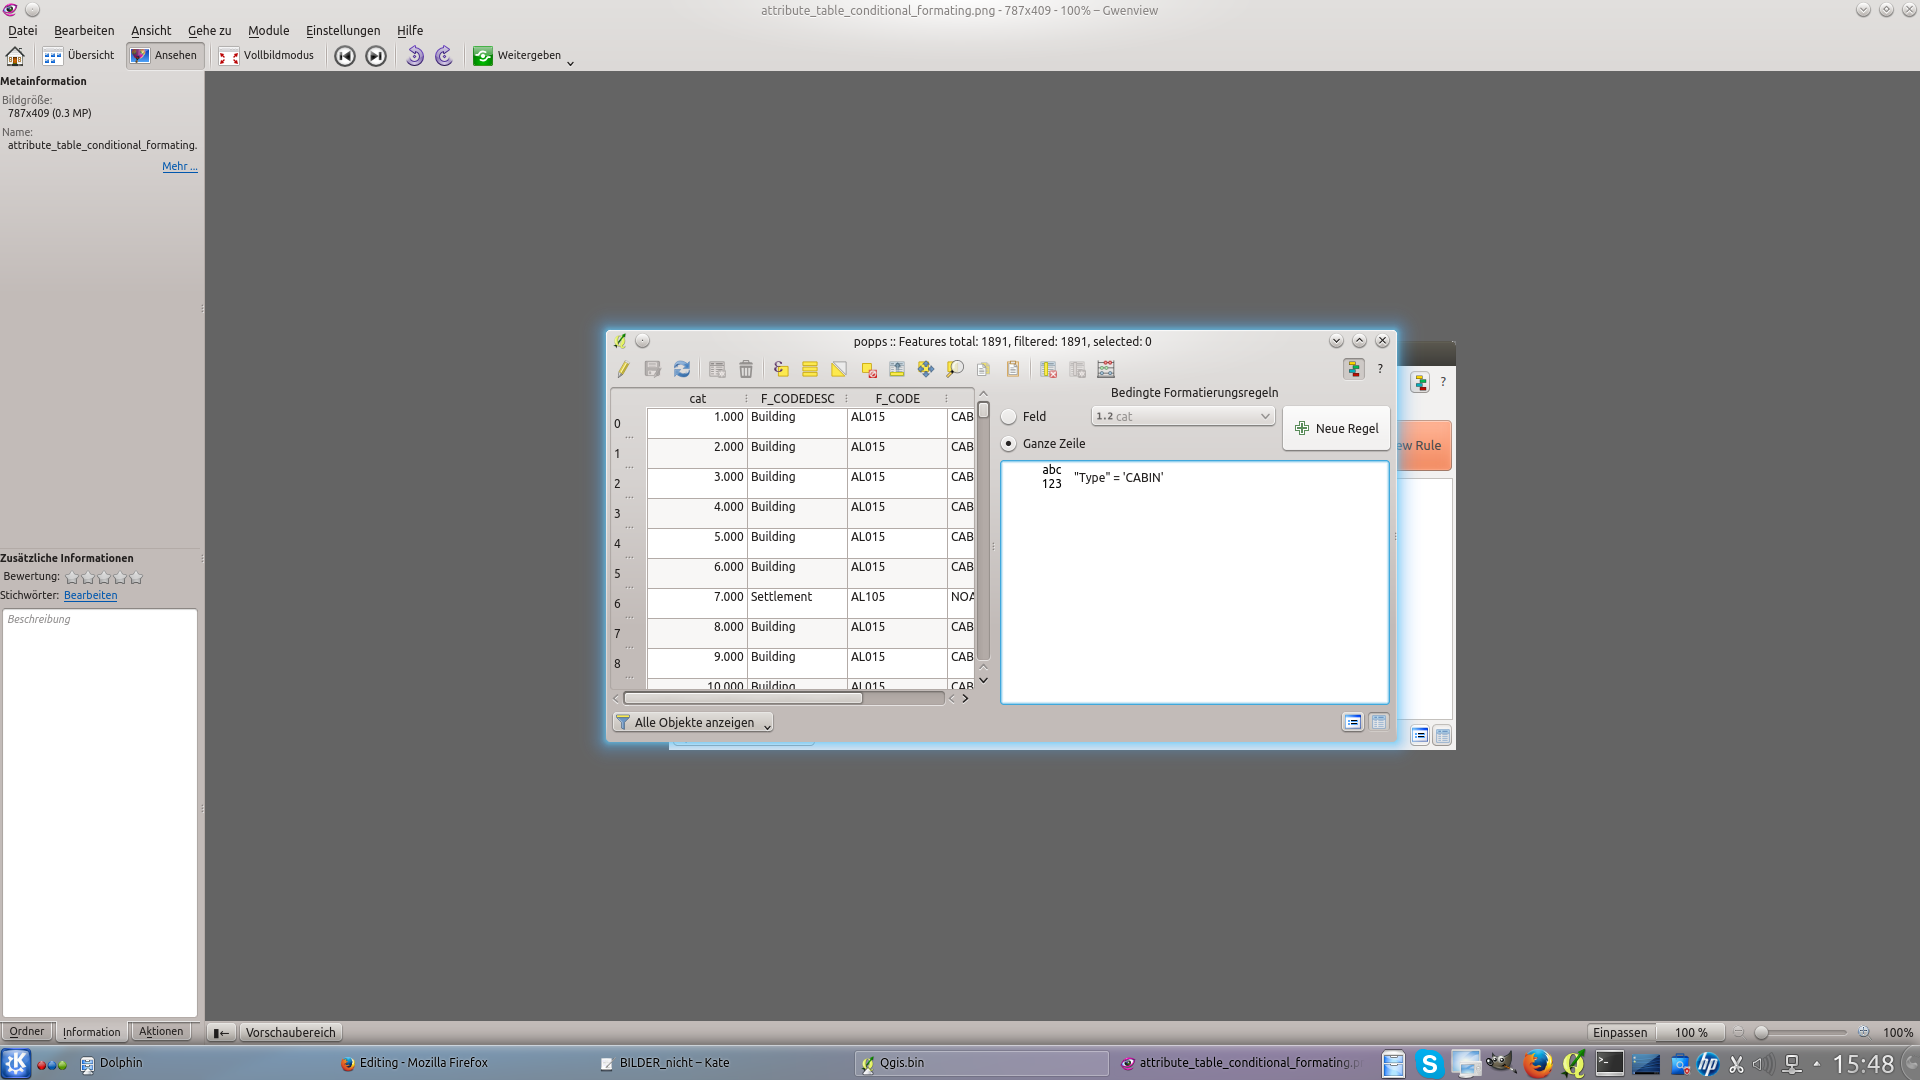
Bedingte Formatierungsregeln für Attributtabellen
Interacting with features in an attribute table
Selecting features
In table view, each row in the attribute table displays the attributes of a unique feature in the layer. Selecting a row selects the feature and likewise, selecting a feature in the map canvas (in case of geometry enabled layer) selects the row in the attribute table. If the set of features selected in the map canvas (or attribute table) is changed, then the selection is also updated in the attribute table (or map canvas) accordingly.
Zeilen können ausgewählt werden, indem Sie auf die Zeilennummer links neben der Zeile klicken. Mehrere Zeilen können ausgewählt werden, indem die Strg Taste während der Auswahl gedrückt wird.Eine kontinuierliche Auswahl ist möglich, indem Sie bei der Selektion die Umschalt Taste gedrückt halten, während Sie die Zeilennummern auswählen. Alle Zeilen zwischen der aktuell ausgewählten Zeile und der Mauspfeilposition werden dadurch selektiert. Bewegt man den Mauszeiger in der Attributtabelle indem man in eine Zelle in der Tabelle klickt ändert die Zeilenauswahl nicht. Verändert man die Auswahl im Kartenfenster bewegt sich der Mauszeiger in der Attributtabelle nicht.
In form view of the attribute table, features are by default identified in the left panel by the value of their displayed field (see Display Properties). This identifier can be replaced using the drop-down list at the top of the panel, either by selecting an existing field or using a custom expression. You can also choose to sort the list of features from the drop-down menu.
Click a value in the left panel to display the feature’s attributes in the right one. To select a feature, you need to click inside the square symbol at the left of the identifier. By default, the symbol turns into yellow. Like in the table view, you can perform multiple feature selection using the keyboard combinations previously exposed.
Beyond selecting features with the mouse, you can perform automatic selection based on feature’s attribute using tools available in the attribute table toolbar, such as (see section Automatic selection and following one for more information and use case):
- Select By Expression...
 Select Features By Value...
- Deselect Features from All Layers
- Select All Features
- Invert Feature Selection.
It is also possible to select features using the Filtering and selecting features using forms.
Filtering features
Once you have selected features in the attribute table, you may want to display only these records in the table. This can be easily done using the Show Selected Features item from the drop-down list at the bottom left of the attribute table dialog. This list offers the following filters:
- Show All Features
- Show Selected Features
- Show Features visible on map
- Show Edited and New Features
- Field Filter - allows the user to filter based on value of a field: choose a column from a list, type a value and press Enter to filter. Then, only the matching features are shown in the attribute table.
- Advanced filter (Expression) - Opens the expression builder dialog. Within it, you can create complex expressions to match table rows. For example, you can filter the table using more that one field. See Ausdrücke for more information.
It is also possible to filter features using the Filtering and selecting features using forms.
Bemerkung
Filtering records out of the attribute table does not filter features out of the layer; they are simply momentaneously hidden from the table and can be accessed from the map canvas or by removing the filter. For filters that do hide features from the layer, use the Query Builder.
Tipp
Update datasource filtering with Show Features Visible on Map
When for performance reasons, features shown in attribute table are spatially limited to the canvas extent at its opening (see Data Source Options for a how-to), selecting Show Features Visible on Map on a new canvas extent updates the spatial restriction.
Filtering and selecting features using forms
Clicking the Filter/Select features using form or
pressing Ctrl+F the attribute table dialog will switch to form view
and all widgets are replaced with their search variant.
From this point onwards, this tool functionality is similar to the one described in the Select Features By Value, where you can find descriptions of all operators and selecting modes.
Moreover, in the attribute table case, there is also a Filter features button that allows filtering features instead of selecting them (by creating an Advanced Filter (Expression) for the user).
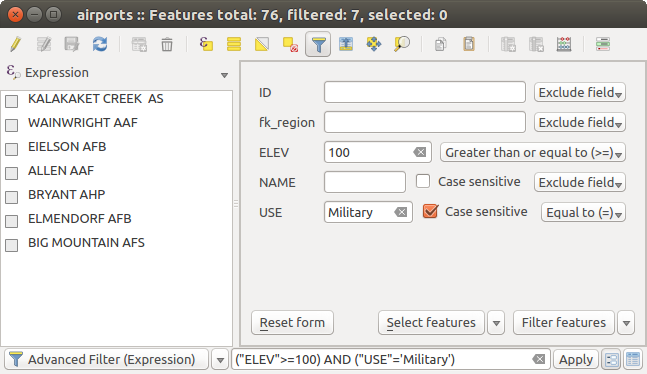
Attribute table filtered by the filter form
If there are already filtered features, you can refine the filter using the drop-down list next to the Filter features button. The options are:
- Filter within (“AND”)
- Extend filter (“OR”)
To clear the filter, either select Show all features option mentioned in Filtering features, or click the clear the expression and click [Apply].
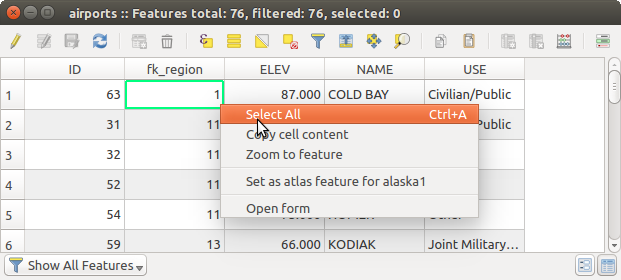
Using action on features
Users have several possibilities to manipulate feature with the contextual menu like:
- Select all (Ctrl+A) the features
- Copy the content of a cell in the clipboard with Copy cell content.
- Zoom to feature without having to select it beforehand
- Open form. It toggles attribute table into form view with a focus on the clicked feature
Copy cell content button
If you want to use attribute data in external programs (such as Excel,
LibreOffice, QGIS or a custom web application), select one or more row(s) and
use the Copy selected rows to clipboard button or press
Ctrl+C.
In Settings ‣ Options ‣ Data Sources menu you can define the format to paste to with Copy features as dropdown list:
- Plain text, no geometry,
- Plain text, WKT geometry,
- GeoJSON
You can also display a list of actions in this contextual menu. This is enabled in the Layer properties ‣ Actions tab. See Actions Properties for more information on actions.
Saving selected features as new layer
The selected features can be saved as any OGR-supported vector format and
also transformed into another coordinate reference system (CRS). In the
contextual menu of the layer, from the Layers Panel, click on
Save as to define the name of the output file, its format
and CRS (see section Creating new layers from an existing layer). To save the selection ensure
that the Save only selected features is selected.
It is also possible to specify OGR creation options within the dialog.
Editiere Attributwerte
Editing attribute values can be done by:
- typing the new value directly in the cell, whether the attribute table is in table or form view. Changes are hence done cell by cell, feature by feature;
- using the field calculator: update in a row a field that may already exist or to be created but for multiple features; it can be used to create virtual fields.
- using the quick field calculation bar: same as above but for only existing field
- or using the multi edit mode: update in a row multiple fields for multiple features.
Using the Field Calculator
The Field Calculator button in the attribute table
allows you to perform calculations on the basis of existing attribute values or
defined functions, for instance, to calculate length or area of geometry
features. The results can be written to a new attribute field, a virtual field,
or they can be used to update values in an existing field.
The field calculator is available on any layer that supports edit. When you click on the field calculator icon the dialog opens (see figure_field_calculator). If the layer is not in edit mode, a warning is displayed and using the field calculator will cause the layer to be put in edit mode before the calculation is made.
Based on the Expression Builder dialog, the field calculator dialog offers a complete interface to define an expression and apply it to an existing or a newly created field. To use the field calculator dialog, you first must select whether you want to only update selected features, create a new attribute field where the results of the calculation will be added or update an existing field.
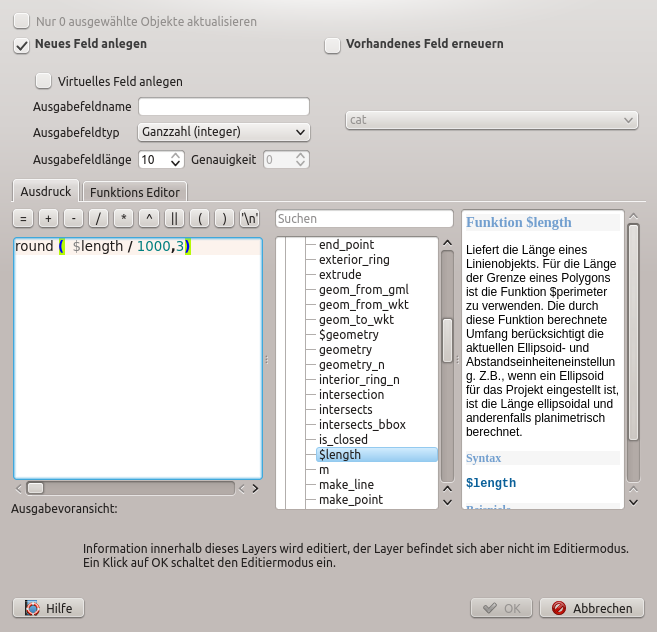
Feldrechner
If you choose to add a new field, you need to enter a field name, a field type (integer, real, date or string) and if needed, the total field length and the field precision. For example, if you choose a field length of 10 and a field precision of 3, it means you have 6 digits before the dot, then the dot and another 3 digits for the precision.
Ein kurzes Beispiel zeigt wie der Feldrechner arbeitet, wenn Sie den Reiter Ausdruck verwenden. Wir wollen die Länge des ‘railroads’ Layers aus dem QGIS Beispieldatensatz in km berechnen:
Laden Sie das Shape railroads.shp in QGIS und öffnen Sie die den Dialog
Attributtabelle öffnen.Klicken Sie auf
Bearbeitungsmodus umschalten und öffnen Sie den Feldrechner Dialog.Wählen Sie das
Neues Feld anlegen Kontrollkästchen um die Berechnungen in ein neues Feld zu speichern.- Add length as Output field name and real as Output field type, and define Output field length to be 10 and Precision, 3.
Machen Sie jetzt einen Doppelklick auf die Funktion $length in der Geometrie Gruppe und fügen Sie sie in die Ausdruck Box des Feldrechners ein.
- Complete the expression by typing / 1000 in the Field calculator expression box and click [Ok].
Sie können jetzt eine neue Spalte laenge in der Attributtabelle finden.
Creating a Virtual Field
A virtual field is a field based on an expression calculated on the fly, meaning that its value is automatically updated as soon as the underlying parameter changes. The expression is set once; you no longer need to recalculate the field each time underlying values change. For example, you may want to use a virtual field if you need area to be evaluated as you digitize features or to automatically calculate a duration between dates that may change (e.g., using now() function).
Bemerkung
Virtuelle Felder benutzen
Virtuelle Felder sind nicht dauerhaft in den Layerattributen, was bedeutet, dass sie in der Projektdatei gespeichert und verfügabr sind, in der sie gespeichert wurden.
Ein Feld kann nur bei der Erzeugung als virtuell eingestellt werden und der Ausdruck kann später nicht mehr geändert werden: Sie müssen es löschen und ein neues erstellen.
Using the Quick Field Calculation Bar
While Field calculator is always available, the quick field calculation bar on top of the attribute table is only visible if the layer is in edit mode. Thanks to the expression engine, it offers a quicker access to edit an already existing field.
In quick field calculation bar, you simply need to:
- select the existing field name in the drop-down list
- fill the textbox with an expression you directly write or build using the
 expression button
 - and click on [Update All], [Update Selected] or [Update Filtered] button according to your need.
Editing multiple fields
Unlike the previous tools, multi edit mode allows multiple attributes of different features to be edited simultaneously. When the layer is toggled to edit, multi edit capabilities are accessible:
- using the Toggle multi edit mode button from the toolbar
inside the attribute table dialog,
- or selecting Edit ‣ Modify
attributes of selected features menu.
In order to edit multiple fields in a row:
select the features you want to edit;
from the attribute table toolbar, click the
button. This will
toggle the dialog to its form view. Feature selection could also be made
at this step;at the right side of the attribute table, fields (and values) of selected features are shown. New widgets appear next to each field allowing for display of the current multi edit state:
 the field contains different values for selected
features. It’s shown empty and each feature will keep its original value.
You can reset the value of the field from the drop-down list of the widget.
the field contains different values for selected
features. It’s shown empty and each feature will keep its original value.
You can reset the value of the field from the drop-down list of the widget. all selected features have the same value for this
field and the value displayed in the form will be kept.
all selected features have the same value for this
field and the value displayed in the form will be kept. the field has been edited and the entered value
will be applied to all the selected features. A message appears at the top
of the dialog, inviting you to either apply or reset your modification.
the field has been edited and the entered value
will be applied to all the selected features. A message appears at the top
of the dialog, inviting you to either apply or reset your modification.
Clicking any of these widgets allows you to either set the current value for the field or reset to original value, meaning that you can roll back changes on a field-by-field basis.
make the changes to the fields you want and click on Apply changes in the upper message text or any other feature in the left panel.
Changes will apply to all selected features. If no feature is selected, the
whole table is updated with your changes. Modifications are made as a single
edit command. So pressing  Undo will rollback the attribute
changes for all selected features at once.
Undo will rollback the attribute
changes for all selected features at once.
Bemerkung
Unlike the tool from the attribute table, hitting the Edit ‣ Modify Attributes of Selected Features option provides you with a modal dialog to fill attributes changes. Hence, features selection is required before execution.
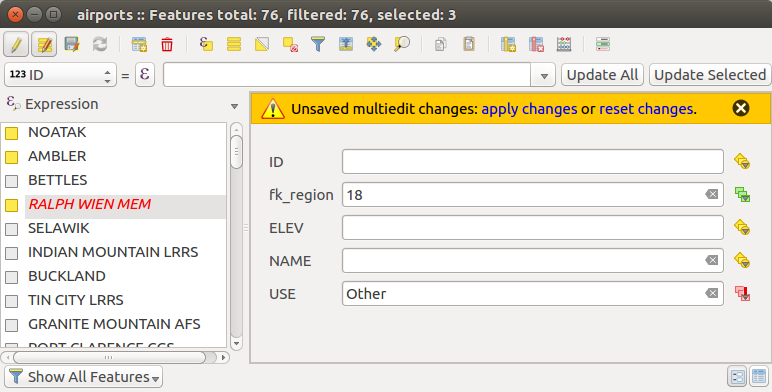
Editing fields of multiple features
Bemerkung
Multi edit mode is only available for auto generated and drag and drop forms (see Customize a form for your data); it is not supported by custom ui forms.
Creating one or many to many relations
Relations are a technique often used in databases. The concept is that features (rows) of different layers (tables) can belong to each other.
Introducing 1-N relations
Als Beispiel nehmen wir einen Layer mit allen Regionen von Alaska (Polygon) in dem einige Attribute über den Namen und den Regionstyp sowie eine eindeutige ID (die als Primärschlüssel eingesetzt wird) vorhanden sind.
Then you get another point layer or table with information about airports that are located in the regions and you also want to keep track of these. If you want to add them to the regions layer, you need to create a one to many relation using foreign keys, because there are several airports in most regions.
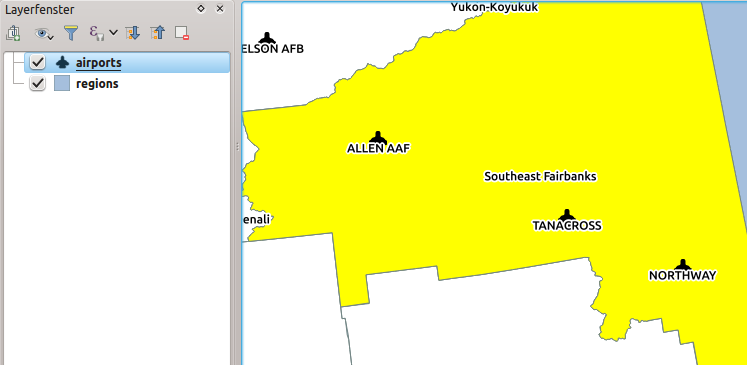
Die Region Alaska mit Flughäfen
Layers in 1-N relations
QGIS makes no difference between a table and a vector layer. Basically, a vector layer is a table with a geometry. So you can add your table as a vector layer. To demonstrate the 1-n relation, you can load the regions shapefile and the airports shapefile which has a foreign key field (fk_region) to the layer regions. This means, that each airport belongs to exactly one region while each region can have any number of airports (a typical one to many relation).
Foreign keys in 1-N relations
In addition to the already existing attributes in the airports attribute table, you’ll need another field fk_region which acts as a foreign key (if you have a database, you will probably want to define a constraint on it).
This field fk_region will always contain an id of a region. It can be seen like a pointer to the region it belongs to. And you can design a custom edit form for editing and QGIS takes care of the setup. It works with different providers (so you can also use it with shape and csv files) and all you have to do is to tell QGIS the relations between your tables.
Defining 1-N relations (Relation Manager)
The first thing we are going to do is to let QGIS know about the relations between the layers. This is done in Project ‣ Project Properties.... Open the Relations tab and click on [Add Relation].
- name is going to be used as a title. It should be a human readable string, describing, what the relation is used for. We will just call say Airports in this case.
- referencing layer also considered as child layer, is the one with the foreign key field on it. In our case, this is the airports layer
- referencing field will say, which field points to the other layer so this is fk_region in this case
- referenced layer also considered as parent layer, is the one with the primary key, pointed to, so here it is the regions layer
- referenced field is the primary key of the referenced layer so it is ID
- id will be used for internal purposes and has to be unique. You may need it to build custom forms. If you leave it empty, one will be generated for you but you can assign one yourself to get one that is easier to handle.
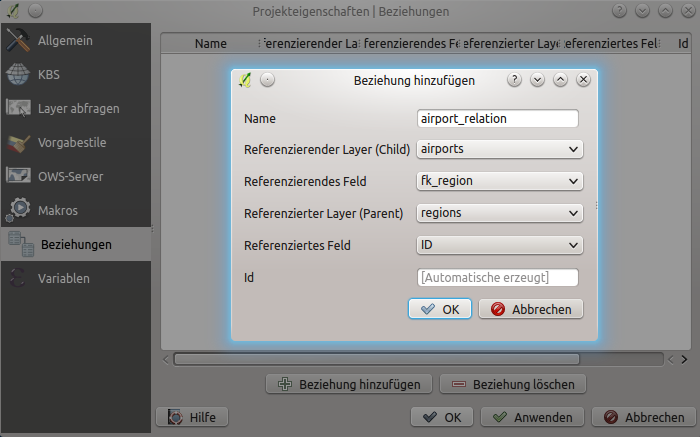
Relation Manager
Forms for 1-N relations
Jetzt wo QGIS von der Beziehung weiss wird es dazu benutzt das Formular das es erstellt zu verbessern. Da wir die Standard Formular Methode (autogenerated) nicht verändert haben, wird es Ihrem Formular einfach ein neues Bearbeitungselement hinzufügen. Also lassen Sie uns einen Layer ‘region’ in der Legende auswählen und das Objekte abfragen Werkzeug benutzen. Abhängig von Ihren Einstellungen öffnet sich das Formular entweder direkt oder Sie müssen den Identifizieren Dialog unter Aktionen öffnen.
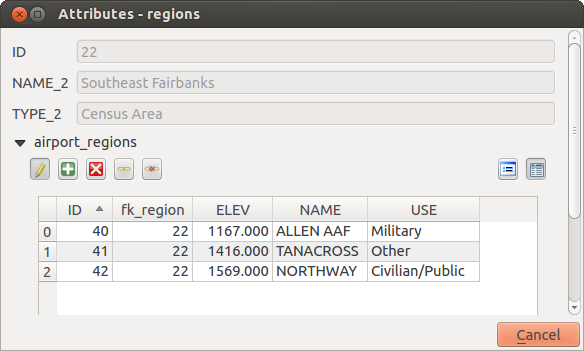
identifikationsergebnis Dialog von regions mit Beziehung zu airports
As you can see, the airports assigned to this particular region are all shown in a table. And there are also some buttons available. Let’s review them shortly
Der
Knopf ist zum Umschalten des Bearbeitungsmodus da. Seien Sie sich dessen bewusst dass es den Bearbeitungsmodus des ‘airport’ Layers umschaltet, trotzdessen wir uns im Objektformular eines Objektes aus dem ‘region’ Layer befinden. Die Tabelle jedoch stellt Objekte des ‘aiport’ Layer dar.- The
 button will add a new feature to the airport layer. And it will
assign the new airport to the current region by default.
button will add a new feature to the airport layer. And it will
assign the new airport to the current region by default. - The
 button will delete the selected airport permanently.
 Das
 Symbol öffnet einen neuen Dialog in dem Sie jeden vorhandenen ‘airport’ auswählen können was dann der aktuellen ‘region’ zugewiesen wird. Dies kann nützlich sein wenn Sie den ‘airport’ aus Versehen in der falschen ‘region’ erstellt haben.
Das
 Symbol hebt die Verbindung zwischen dem ausgewählten ‘airport’ und der aktuellen ‘region’ wieder auf so dass dieser auf wirksame Art und Weise nicht mehr zugewiesen ist (der Fremdschlüssel wird auf NULL gesetzt).
- The two buttons to the right switch between table view and form view where the later let’s you view all the airports in their respective form.
If you work on the airport table, a new widget type is available which lets you embed the feature form of the referenced region on the feature form of the airports. It can be used when you open the layer properties of the airports table, switch to the Fields menu and change the widget type of the foreign key field ‘fk_region’ to Relation Reference.
Wenn Sie jetzt einen Blick auf den Objektdialog werfen werden Sie sehen dass das Formular der ‘region’ in das ‘airports’ Formular eingebettet ist und sogar eine Kombobox vorhanden ist mit dem der aktuelle ‘airport’ zu einer anderen ‘region’ zugeordnet werden kann.
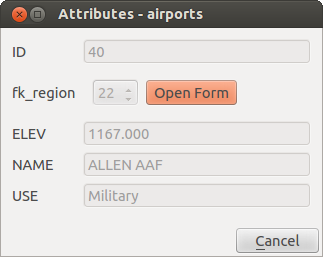
Objekte abfragen Dialog von ‘airport’ mit Beziehung zu ‘regions’
Introducing many-to-many (N-M) relations
N-M relations are many-to-many relation between two tables. For instance, the airports and airlines layers: an airport receives several airline companies and an airline company flies to several airports.
In such case, we need a pivot table to list all airlines for all airports. In QGIS, you should setup two one-to-many relations as explained above:
- a relation between airlines table and the pivot table;
- and a second one between airports table and the pivot table.
When we add a new child (i.e. a company to an airport), QGIS will add a new row in the pivot table and in the airlines table. If we link a company to an airport, QGIS will only add a row in the pivot table.
In case you want to remove a link, an airline or an airport, QGIS won’t remove the row in the pivot table. The database administrator should add a ON DELETE CASCADE instruction in the foreign key constraint:
ALTER TABLE location.airlines
ADD CONSTRAINT location_airlines_airports_id_fkey
   FOREIGN KEY (id)
      REFERENCES location.airports(id)
         ON DELETE CASCADE;
Bemerkung
Combining N-M relation with automatic transaction group
You should enable the transaction mode in Project Properties ‣ Data Sources ‣ when working on such context. QGIS should be able to add or update row(s) in all tables (airlines, airports and the pivot tables).
Finally, adding such relations in a form is done in the same way that for a one-to-many relation. The Relations panel in the Fields properties of the vector layer will let the user add the relation in the form. It will appear as a Many to many relation.