중요
번역은 여러분이 참여할 수 있는 커뮤니티 활동입니다. 이 페이지는 현재 60.00% 번역되었습니다.
17.13. HTML 산출물
참고
이 수업에서 QGIS가 텍스트 산출물과 도표를 생산하는 데 쓰이는 HTML 서식으로 된 산출물을 어떻게 다루는지 배울 것입니다.
All the outputs we have produced so far were layers (whether raster or vector). However, some algorithms generate outputs in the form of text and graphics. All this outputs are wrapped in HTML files and displayed in the so–called Results viewer, which is another element of the processing framework.
이런 알고리즘들이 어떻게 작동하는지 알아봅시다.
Open the project with the data to be used in this lesson and then open the Basic statistics for fields algorithm.
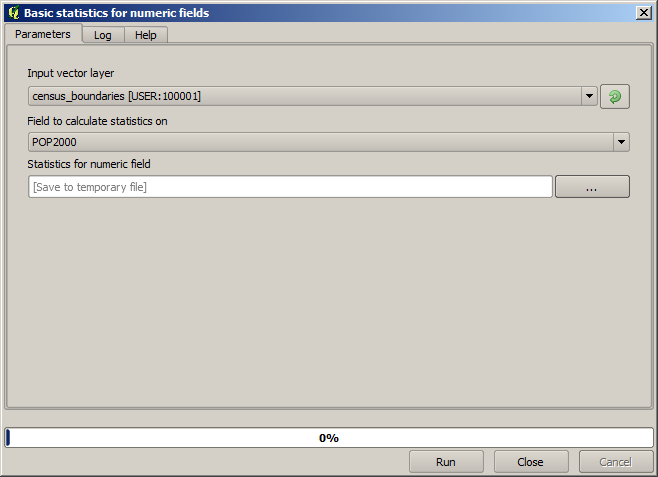
이 알고리즘은 단순한 편으로, 사용할 레이어 및 레이어의 (숫자) 필드 하나만 선택하면 됩니다. 산출물이 HTML 유형이지만, 이에 상응하는 텍스트란은 래스터 또는 벡터 레이어의 경우와 완전히 동일하게 작동합니다. 파일 경로를 입력하거나, 임시 파일로 저장하려면 비워두면 됩니다. 하지만 이 경우 확장자로 html 및 htm 만 사용할 수 있기 때문에 다른 확장자를 사용해서 산출물 포맷을 변경할 수는 없습니다.
Run the algorithm selecting the only layer in the project as input, and
the POP2000 field, and a new dialog like the one shown next will appear
once the algorithm is executed and the parameters dialog is closed.
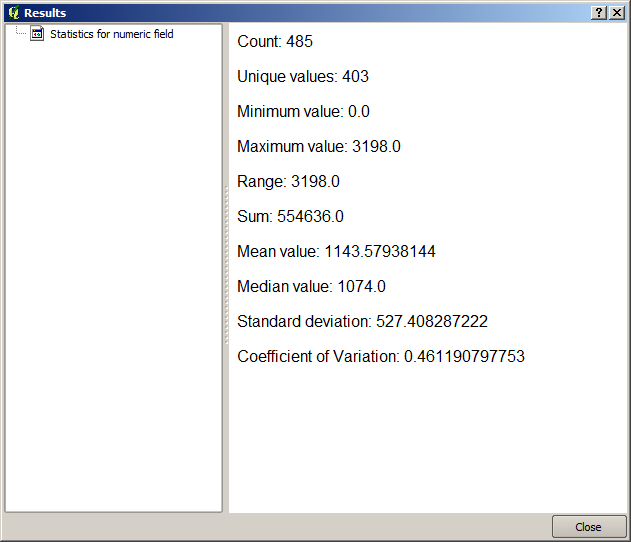
This is the Results viewer. It keeps all the HTML result generated during the current session, easily accessible, so you can check them quickly whenever you need it. As it happens with layers, if you have saved the output to a temporary file, it will be deleted once you close QGIS. If you have saved to a non-temporary path, the file will remain, but it will not appear in the Results viewer the next time you open QGIS.
일부 알고리즘은 좀 더 상세한 다른 산출물로 나눌 수 없는 텍스트를 생성합니다. 예를 들어 외부에서 처리된 텍스트 산출물을 수집하는 알고리즘의 경우가 그렇습니다. 산출물이 텍스트로 표현되지만 내부적으로 더 작은, 일반적으로 숫자값 형태의 산출물들로 나뉘는 경우도 있습니다. 방금 실행한 알고리즘이 바로 이런 경우입니다. 이 값들은 각각 단일한 산출물로서 다뤄지며, 변수로 저장됩니다. 지금은 중요하지 않지만, 일단 모델 설계자 단계로 가면 이 값들을 다른 알고리즘의 입력값으로 사용할 수 있다는 것을 알게 될 것입니다.