중요
번역은 여러분이 참여할 수 있는 커뮤니티 활동입니다. 이 페이지는 현재 64.71% 번역되었습니다.
14.9. 수업: 맵 프레젠테이션
이전 수업들에서 여러분은 옛날 삼림 현황 정보를 가져오고, 현재 상황에 맞게 업데이트하고, 삼림 현황 정보 수집 작업을 설계하고, 현장 작업을 위한 맵을 생성하고 현장 측정값으로부터 삼림 파라미터를 계산했습니다.
GIS 프로젝트의 결과물을 맵으로 생성하는 일은 중요합니다. 삼림 현황 정보 수집 작업의 결과를 보여주는 맵이 있다면 누구라도 특정한 숫자들을 들여다 볼 필요없이 한 눈에 어떤 결과가 나왔는지 쉽게 알 수 있게 됩니다.
이 수업의 목표: 음영기복도 래스터를 배경으로 현황 정보 수집 작업 결과를 보여주는 맵 생성하기.
14.9.1. ★☆☆ 따라해보세요: 맵 데이터 준비하기
Open the QGIS project from the parameters calculations lesson, forest_inventory.qgs.
Keep at least the following layers:
forest_stands_2012_results.basic_map.rautjarvi_aerial.lakes(if you don’t have it, add it from theexercise_data\forestry\folder).
You are going to present the average volumes of your forest stands in a map.
If you open the Attribute table for the forest_stands_2012_results
layer, you can see the NULL values for the stands without information.
To be able to get also those stands into your symbology you should change the
NULL values to, for example, -999, knowing that those negative
numbers mean there is no data for those polygons.
For the forest_stands_2012_results layer:
Attribute table 을 열고 편집 모드를 활성화하십시오.
Select the polygons with
NULLvalues.Use the calculator to update the values of the
MEANVolfield to-999only for the selected features.편집 모드를 해제하고 변경 사항을 저장하십시오.
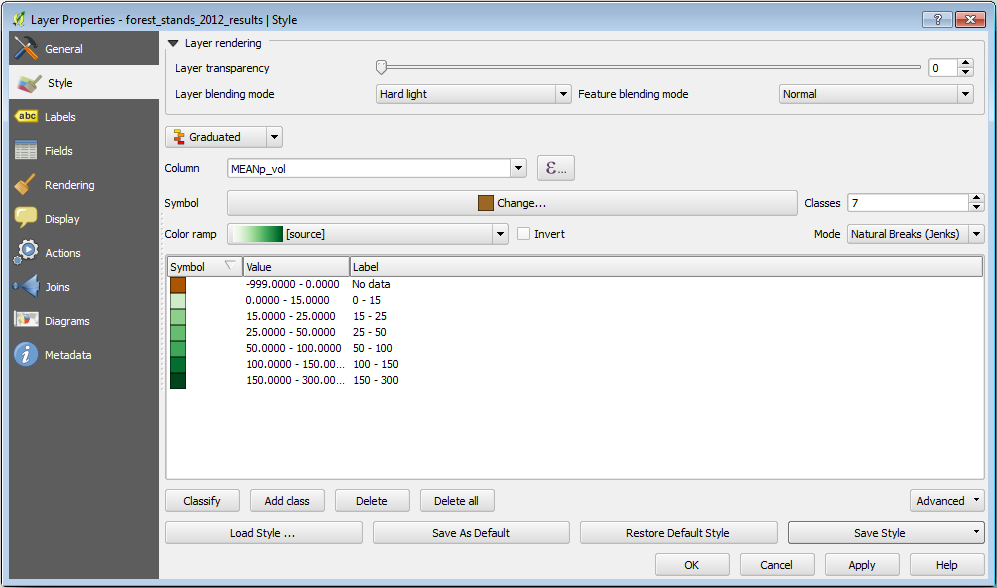
이제 이 레이어에 저장된 스타일을 적용할 수 있습니다.
Symbology 탭을 선택합니다.
을 클릭하십시오.
Select the
forest_stands_2012_results.qmlfrom theexercise_data\forestry\results\folder.:guilabel:`OK`를 클릭하십시오.
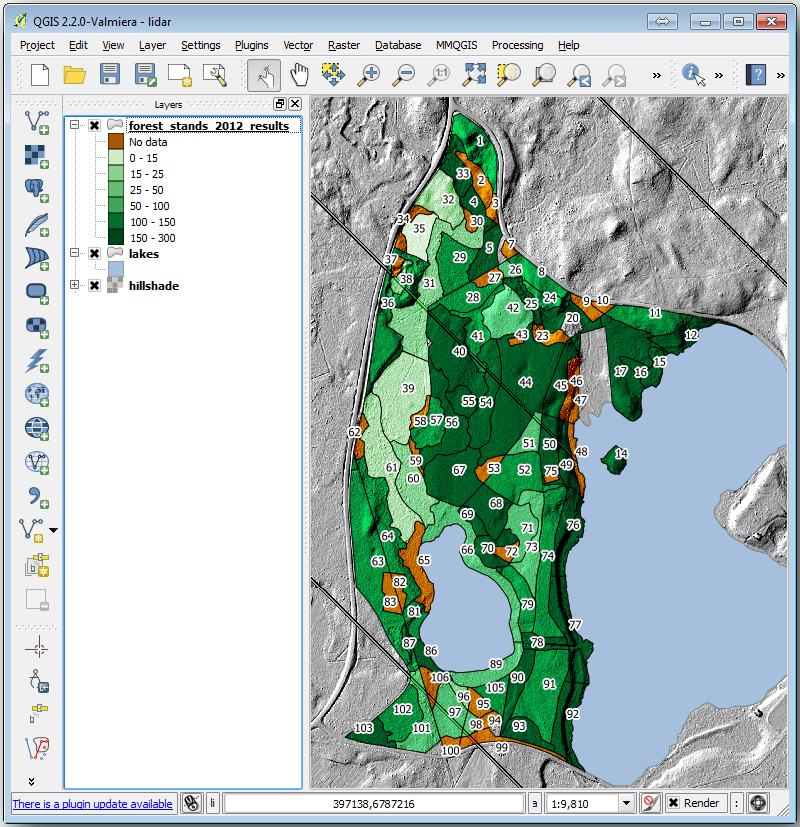
사용자 맵이 다음과 비슷하게 보일 것입니다:
14.9.2. ★☆☆ 혼자서 해보세요: 서로 다른 혼합 모드들을 시험해보기
여러분이 불러온 스타일은,
is using the Hard light mode for the Layer blending mode. Note that the different modes apply different filters combining the underlying and overlying layers, in this case the hillshade raster and your forest stands are used. You can read about these modes in the User Guide.
서로 다른 모드들을 적용해 보고 맵이 어떻게 달라지는지 살펴보십시오. 그 다음 마지막 맵에 가장 어울린다고 생각되는 모드를 선택하십시오.
14.9.3. ★☆☆ 혼자서 해보세요: 조판 템플릿을 사용해서 맵 결과물을 생성하기
Use a template prepared in advanced to present the results. The template
forest_map.qpt is located in the exercise_data\forestry\results\
folder. Load it using the dialog.
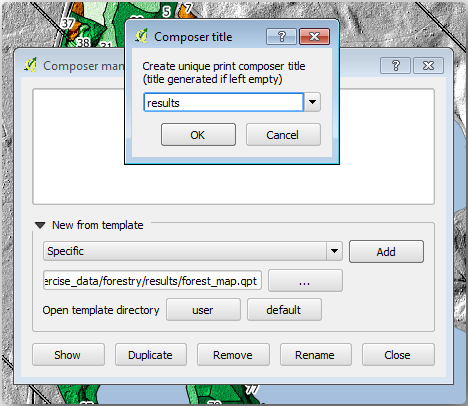
인쇄 조판기를 실행해서 여러분이 만족하는 결과물을 얻기 위해 마지막 맵을 편집해보십시오.
여러분이 불러온 맵 템플릿으로는 다음 그림과 비슷한 맵을 얻게 될 겁니다.
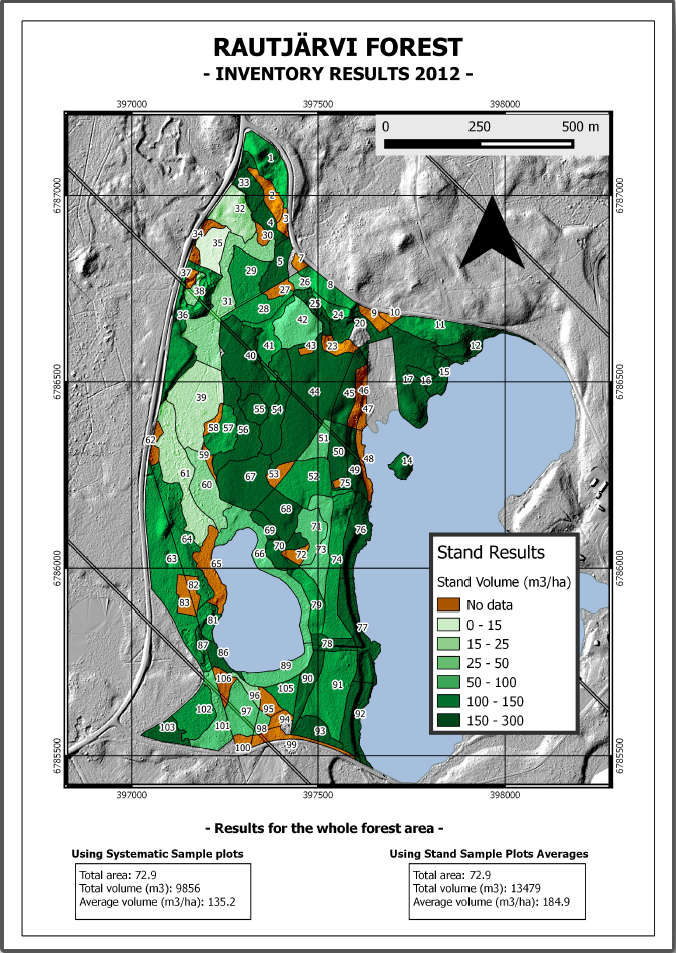
다음에 사용할 경우를 대비해 QGiS 프로젝트를 저장하십시오.
14.9.4. 결론
이 강의를 통해 여러분은 기본적인 삼림 현황 정보 수집 작업을 어떻게 계획하고 QGIS를 통해 보여줄 수 있는지 배웠습니다. 여러분이 사용할 수 있는 여러 가지 도구들을 통해 더 많은 삼림 분석이 가능합니다만, 이 교재에서 여러분이 어떻게 필요한 특정 결과물을 얻을 수 있는지에 대한 굳건한 첫 발걸음을 디디게 되었기를 바랍니다.