Importante
La traducción es un esfuerzo comunitario puede unirse. Esta página está actualmente traducida en |progreso de traducción|.
17. Trabajar con teselas 3D
17.1. ¿Qué son las teselas 3D?
Las teselas 3D son una especificación para la transmisión y el renderizado de conjuntos de datos geoespaciales 3D a gran escala. Utilizan una estructura jerárquica para gestionar y mostrar de forma eficiente el contenido 3D, optimizando el rendimiento mediante la carga dinámica de los niveles de detalle adecuados. Esta tecnología se utiliza ampliamente en planificación urbana, arquitectura, simulación, juegos y realidad virtual, proporcionando una solución estandarizada e interoperable para visualizar datos geográficos complejos.
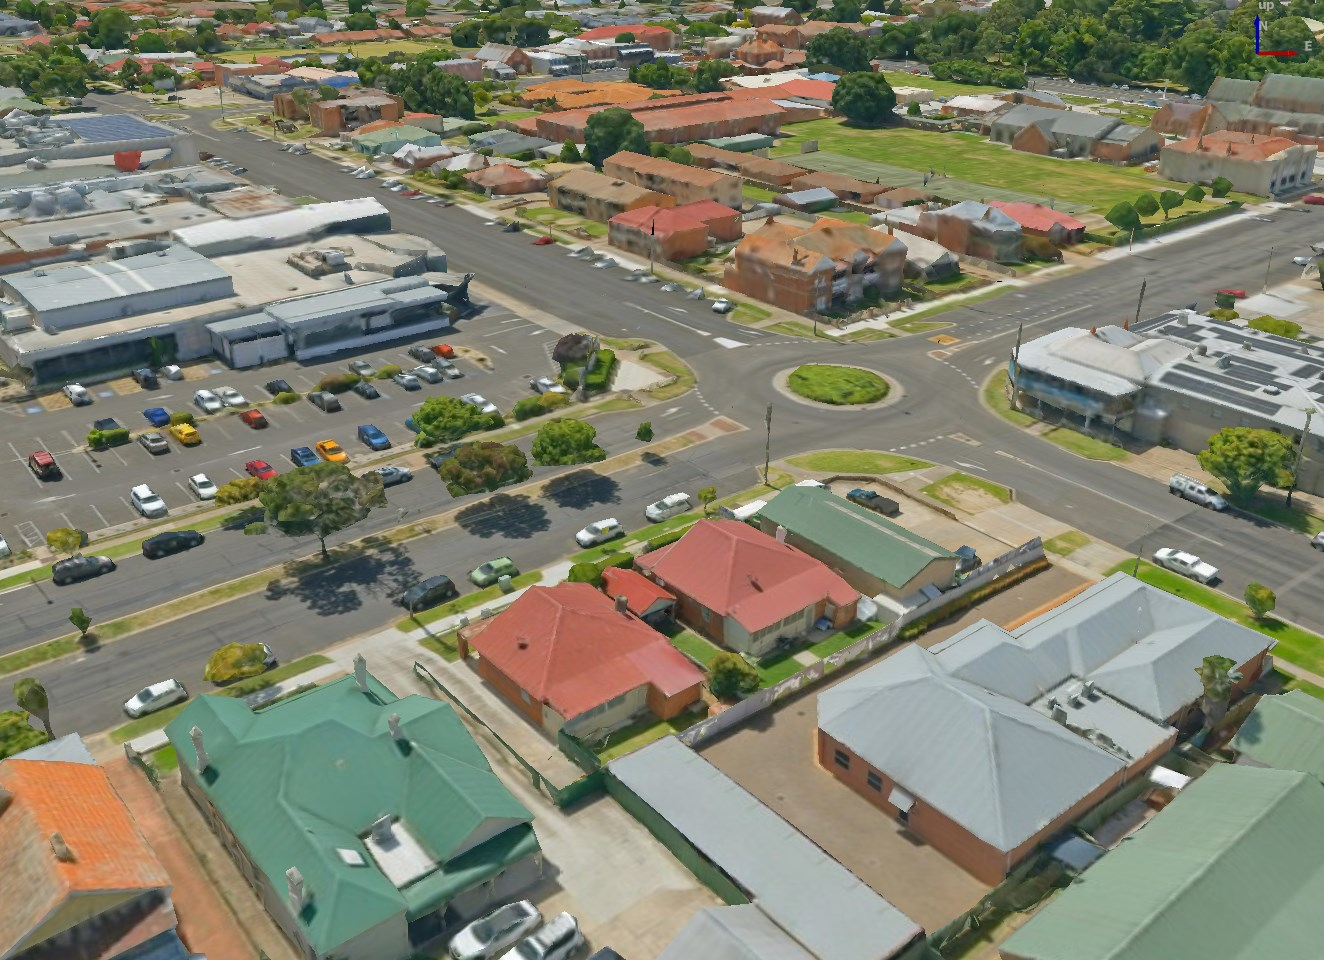
Figura 17.1 Ejemplo de teselas 3D
Consulte Utilización de servicios de escena 3D en mosaico para obtener instrucciones sobre cómo añadir estas fuentes de datos a QGIS.
17.1.1. State of 3D Tiles Support
Actualmente, QGIS admite dos formatos de teselas 3D:
«Cesium» 3D Tiles are used primarily for complex 3D models of buildings or whole cities. Such datasets can be provided by cloud-based platforms such as Cesium Ion or Google (Photorealistic 3D Tiles).
Quantized Mesh tiles are used for terrain elevation data.
Supported 3D Tiles features:
QGIS currently has partial support for 3D Tiles 1.0 and partial support for 3D Tiles 1.1.
For 3D Tiles 1.0, the tile format Batched 3D Model (
b3dm) is supported. The tile formats Instanced 3D Model (i3dm), Point Cloud (pnts) and Composite (cmpt) are not supported yet.For 3D Tiles 1.1, the
3DTILES_content_gltfextension is supported, so tile contents may also be encoded as glTF 2.0 (text or binary). TheEXT_mesh_gpu_instancingextension is not supported yet.Currently only explicit tiling is supported. Implicit tiling is not supported yet
Currently only tilesets using EPSG:4978 are supported.
17.2. Propiedades de las teselas 3D
El cuadro de diálogo teselas 3D Propiedades de capa ofrece las siguientes secciones:


17.2.1. Propiedades de información
La pestaña Información es de solo lectura y representa un lugar interesante para obtener rápidamente información resumida y metadatos en la capa actual. Los datos proporcionados son:
en función del proveedor de la capa: nombre, URL, tipo y ruta de origen, número de niveles de zoom
propiedades personalizadas, utilizadas para almacenar en el proyecto activo información adicional sobre la capa. Se pueden crear y gestionar más propiedades utilizando PyQGIS, concretamente a través del método setCustomProperty().
el sistema de referencia de coordenadas: nombre, unidades, método, precisión, referencia (es decir, si es estático o dinámico)
recogidos de los metadatos rellenados: acceso, extensiones, enlaces, contactos, historial…
17.2.2. Propiedades de fuente
La pestaña  Fuente muestra información básica sobre el mosaico 3D seleccionado, incluyendo:
el Nombre de la capa a mostrar en el Panel de capas;
el Sistema de Referencia de Coordenadas: Muestra el Sistema de referencia de coordenadas (SRC) de la capa. Puede cambiar el SRC de la capa, seleccionando uno utilizado recientemente en la lista desplegable o haciendo clic en el botón
 Seleccionar SRC (véase Selector del Sistema de Coordenadas de Referencia). Utilice este proceso sólo si el SRC de la capa es incorrecto o no está especificado.
17.2.3. Propiedades de simbología
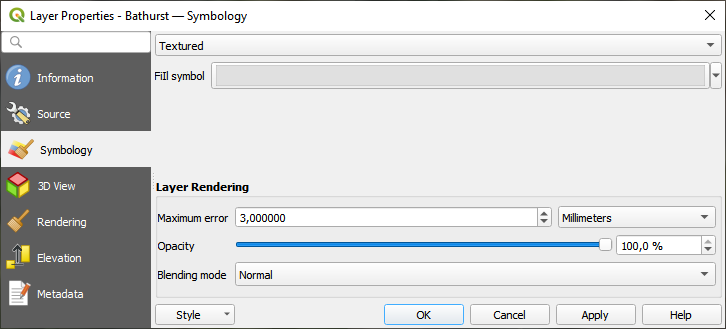
Figura 17.2 Simbología de capas de tesela 3D
De forma predeterminada, la capa está estilizada usando textura, pero puede cambiarla para ver la malla wireframe detrás de la escena eligiendo Wireframe en el menú desplegable. También puede cambiar el relleno de la malla y los símbolos de línea similares a los polígonos vectoriales. Marcando  Usar colores de textura renderizará cada elemento de la malla con el valor medio de la textura completa. Esta es una buena opción para probar cuando se trata de un gran conjunto de datos y desea obtener una visión general rápida de los datos.
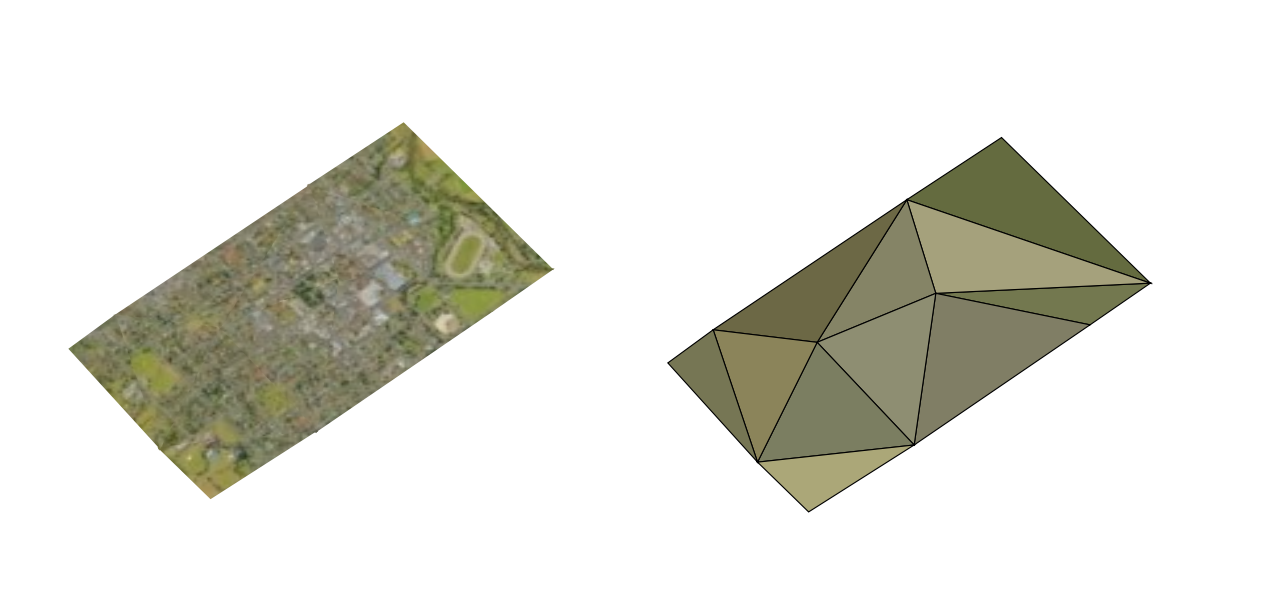
Figura 17.3 Teselas 3D - texturizadas y wireframe
Desde la pestaña Simbología, también puede configurar algunas opciones que actúan invariablemente sobre todas las características de la capa:
Error máximo: Este parámetro determina el nivel de detalle mostrado en el modelo 3D. Al igual que las nubes de puntos, los mosaicos 3D suelen contener más información de la necesaria para su representación visual. Al ajustar este parámetro, se controla el equilibrio entre la densidad de visualización y la velocidad de renderizado. Un valor mayor (por ejemplo, 5 mm) puede introducir huecos perceptibles entre los elementos, mientras que un valor menor (por ejemplo, 0,1 mm) podría conducir a la representación de un número excesivo de detalles, lo que podría ralentizar el proceso de renderizado. Se pueden seleccionar diferentes unidades para adaptar el ajuste a sus necesidades específicas.
Opacity: Adjusts the visibility of the underlying layer on the map canvas using this tool. Use slider to tailor the visibility of your scene layer according to your preferences. Alternatively, specify the exact percentage of visibility through the menu next to the slider.
Modo de mezcla: Con estas herramientas puede conseguir efectos de renderizado especiales que antes sólo conocía de los programas gráficos. Los píxeles de las capas superpuestas y subpuestas se mezclan mediante los ajustes descritos en Modos de Mezcla.
17.2.4. Propiedades de visor 3D
Maximum screen space error: Determines the threshold for swapping terrain tiles with more detailed ones (and vice versa) - i.e. how soon the 3D view will use higher quality tiles. Lower numbers mean more details in the scene at the expenses of increased rendering complexity.
 Show bounding boxes: Shows 3D bounding boxes of the
terrain tiles (useful for troubleshooting terrain issues).
Show bounding boxes: Shows 3D bounding boxes of the
terrain tiles (useful for troubleshooting terrain issues).
Para ver los datos puede abrir  Vista del nuevo mapa 3D.
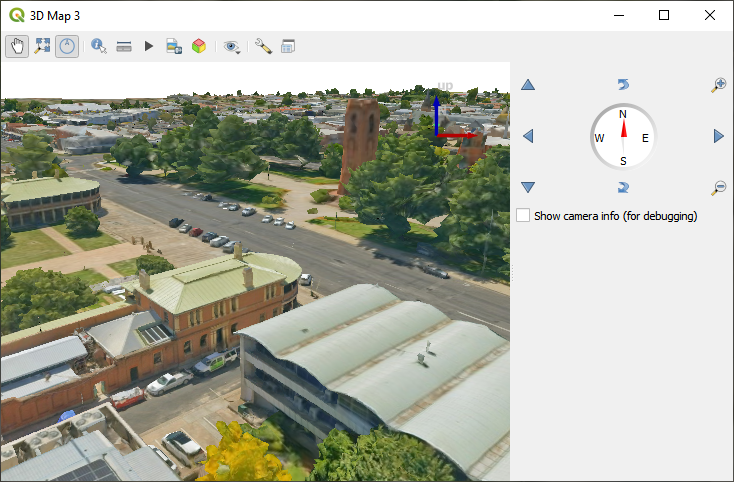
Figura 17.4 Vista de Mapa 3D
17.2.5. Propiedades de representación
En Visibilidad dependiente de la escala, puede establecer las escalas Máxima (inclusive) y Mínima (exclusiva), definiendo un rango de escalas en el que las características serán visibles. Fuera de este rango, se ocultan. El botón  Establecer en la escala actual del lienzo le ayuda a utilizar la escala actual del lienzo del mapa como límite del rango de visibilidad. Véase Selector de escala de visibilidad para más información.
17.2.6. Propiedades de elevación
La pestaña  Elevación proporciona opciones para controlar las propiedades de elevación de la capa dentro de una vista de mapa 3D. En concreto, puede establecer:
Superficie de elevación: cómo deben interpretarse los valores Z de los vértices de la capa 3D como elevación del terreno. Se puede aplicar un factor Escala y un factor Desplazamiento.
17.2.7. Propiedades de metadatos
El  Metadata le brinda opciones para crear y editar un informe de metadatos en su capa. Consulte Metadatos para obtener más información.