Importante
La traduzione è uno sforzo comunitario you can join. Questa pagina è attualmente tradotta al 73.68%.
17.22. Interpolazione
Nota
Questo capitolo mostra come interpolare dati di punti, e ti mostrerà un altro esempio per effettuare analisi spaziali
In questa lezione ti accingi a interpolare i dati di punti per ottenere un raster. Prima di farlo, dovrai preparare i dati, e dopo l’interpolazione farai ulteriori elaborazioni di aggiustamento dei risultati, così da avere un’analisi completa.
Apri i dati di esempio per questa lezione che dovrebbero apparire come di seguito
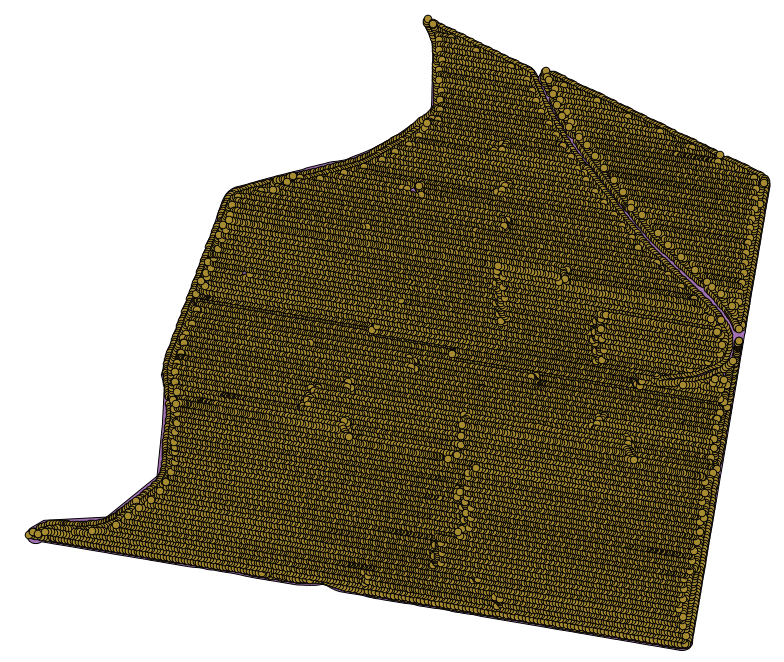
I dati corrispondono alla resa di una coltivazione, come rilevati da una mietitrice moderna e li userai per avere un raster delle rese produttive del campo. Non farai ulteriori analisi ma lo userai come livello di base per identificare le zone più produttive e quelle dove la produttività può essere migliorata.
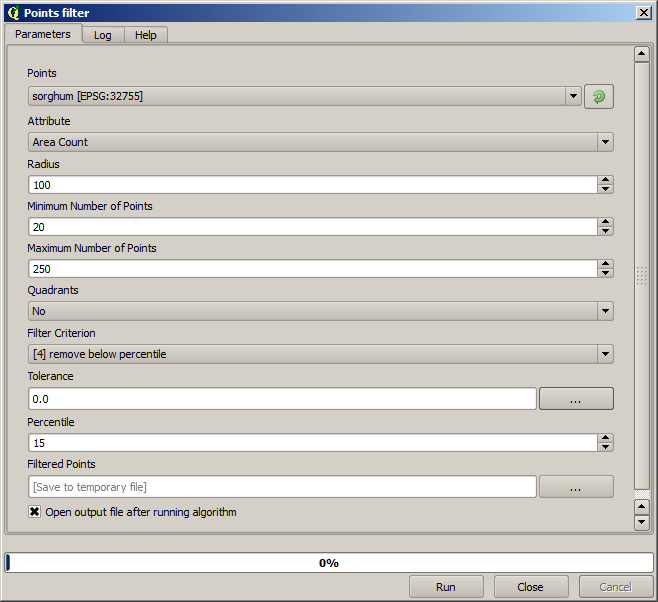
The first thing to do is to clean–up the layer, since it contains redundant points. These are caused by the movement of the harvester, in places where it has to do a turn or it changes its speed for some reason. The Points filter algorithm will be useful for this. We will use it twice, to remove points that can be considered outliers both in the upper and lower part of the distribution.
Per i valori anomali superiormente, usa i seguenti parametri.
Per continuare usa la configurazione mostrata sotto.
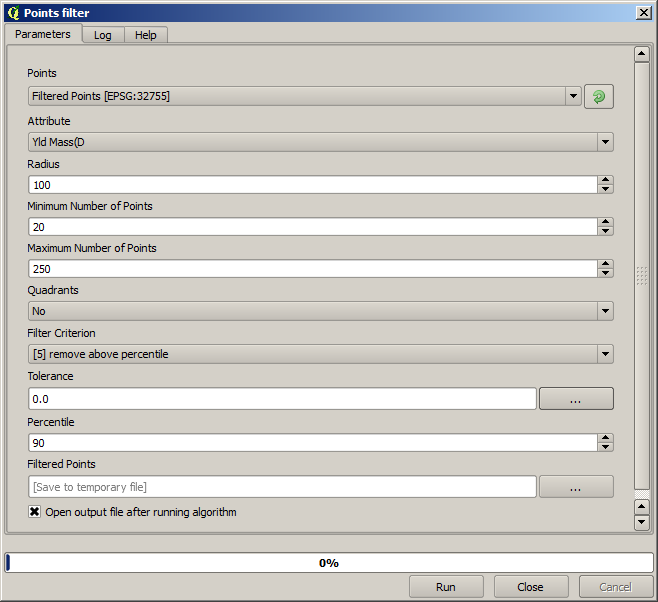
Nota che non stai usando il layer originale ma l’output ricavato dal passo precedente.
Il vettore finale dovrebbe essere simile a quello iniziale, ma contiene un numero minore di punti. Puoi verificare, confrontando le rispettive tabelle di attributi.
Now let’s rasterize the layer using the Rasterize algorithm.
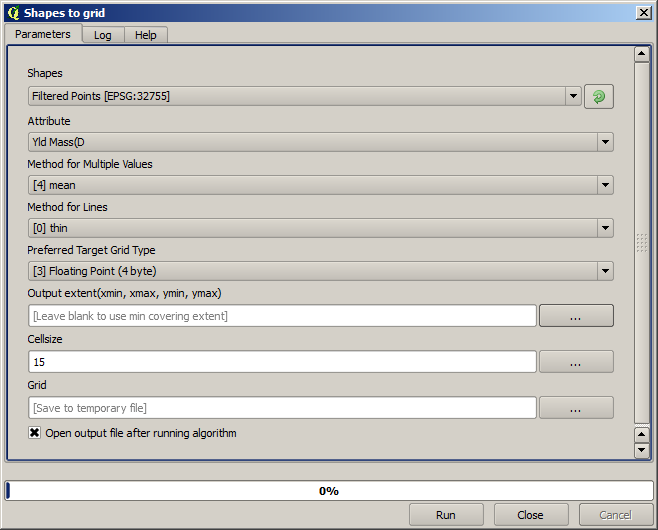
The Filtered points layer refers to the resulting one of the second filter.
It has the same name as the one produced by the first filter, since the name
is assigned by the algorithm, but you should not use the first one. Since we
will not be using it for anything else, you can safely remove it from your
project to avoid confusion, and leave just the last filtered layer.
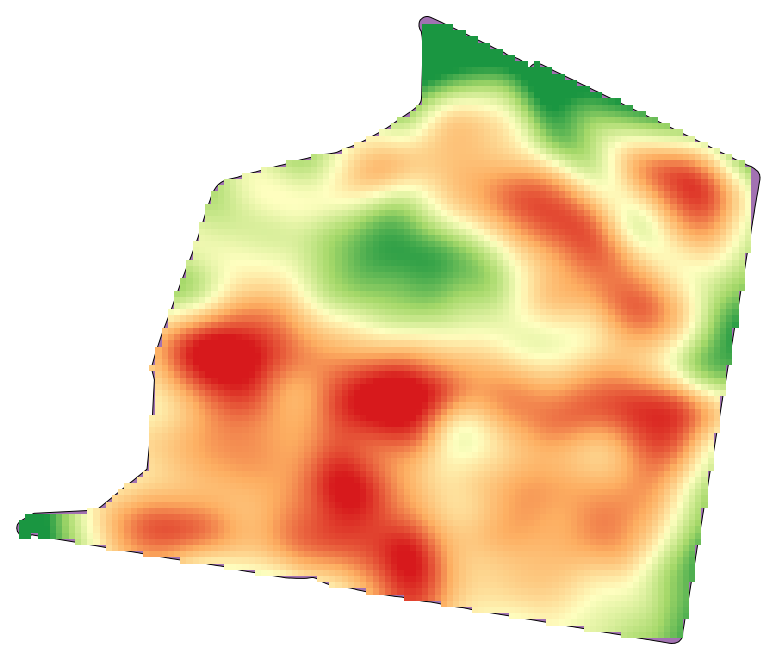
Il raster risultante si presenta così
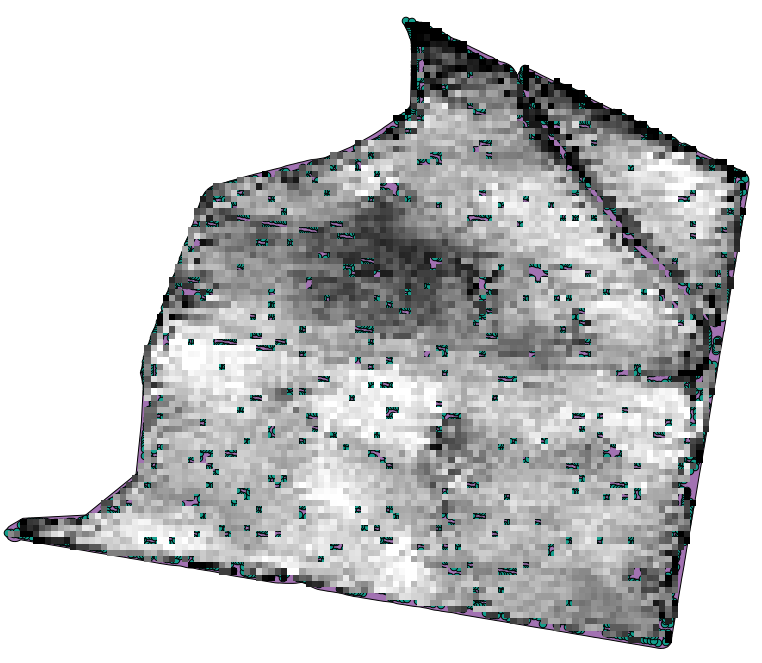
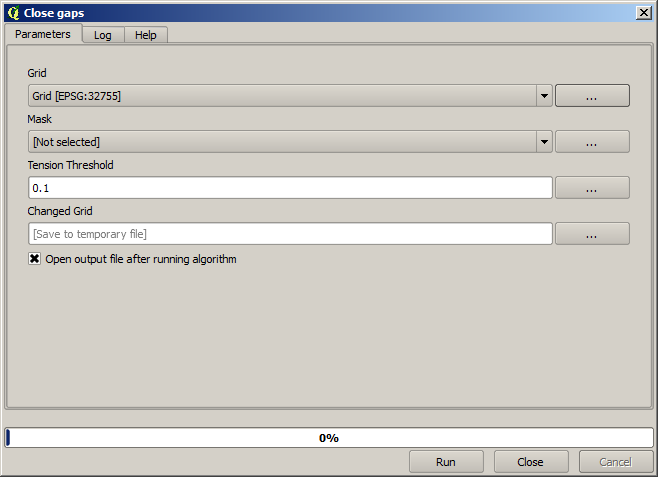
It is already a raster layer, but it is missing data in some of its cells. It only contain valid values in those cells that contained a point from the vector layer that we have just rasterized, and a no–data value in all the other ones. To fill the missing values, we can use the Close gaps algorithm.
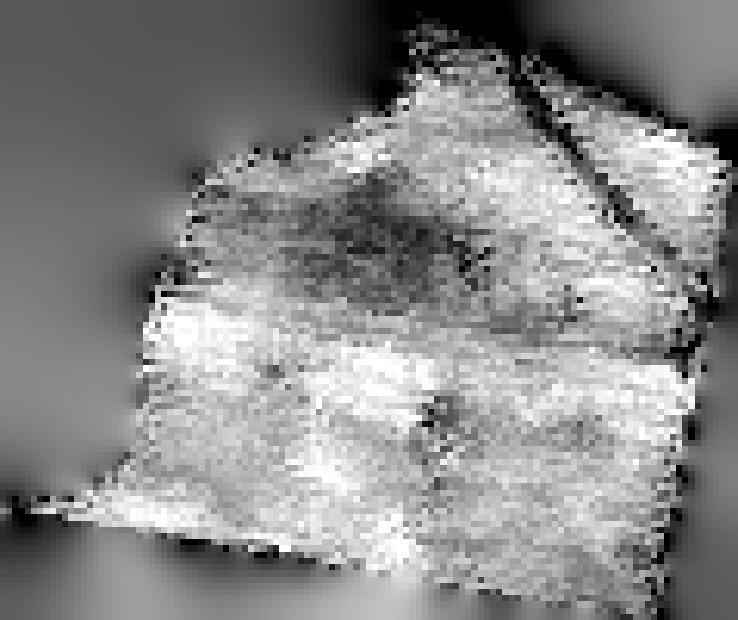
Il raster, tolte le celle senza dato appare simile a questo.
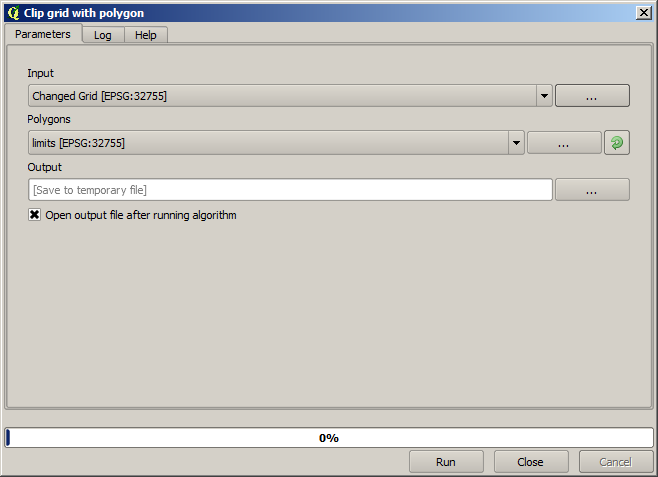
Per limitare l’area coperta dai dati alla regione in cui è stata misurata la resa delle colture, puoi ritagliare il raster con i limiti del vettore punti.
And for a smoother result (less accurate but better for rendering in the background as a support layer), we can apply a Gaussian filter to the layer.
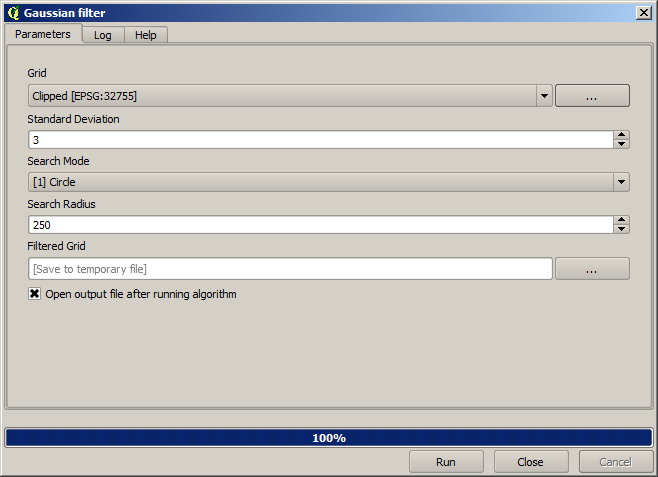
Con i parametri di cui sopra otterrai il seguente risultato