Wichtig
Übersetzen ist eine Gemeinschaftsleistung Sie können mitmachen. Diese Seite ist aktuell zu 34.78% übersetzt.
6.1. Lektion: Daten umprojizieren und transformieren
Lassen Sie uns noch einmal über Koordinatenbezugssysteme (KBS) sprechen. Wir haben dieses Thema zuvor bereits kurz angeschnitten, aber noch nicht erörtert, was es in der Praxis bedeutet.
Das Ziel dieser Lektion: Vektordatensätze reprojizieren und transformieren.
6.1.1. ★☆☆ Zum Mitmachen: Projektionen
Das KBS, in dem sich sowohl alle Daten als auch die Karte selbst derzeit befinden, heißt WGS84. Dabei handelt es sich um ein sehr verbreitetes geographisches Koordinatensystem (GCS) zur Darstellung von Daten. Doch wie wir gleich sehen werden, wird hiermit ein Problem auftreten.
Speicheren Sie ihre aktuelle Karte
Öffnen Sie anschließend die Weltkarte, die Sie unter
exercise_data/world/world.qgsfinden.Zoomen Sie mithilfe des Werkzeugs
 Hineinzoomen auf Südafrika.
Versuchen Sie, im Feld Maßstab in der Statusleiste am unteren Bildschirmrand einen Maßstab einzustellen. Setzen Sie diesen Wert, während Sie sich über Südafrika befinden, auf
1:5 000 000(eins zu fünf Millionen).Verschieben Sie den Kartenausschnitt und behalten Sie dabei das Feld Maßstab im Auge.
Fällt Ihnen auf, dass sich der Maßstab ändert? Das liegt daran, dass Sie sich von dem Punkt entfernen, auf den Sie bei 1:5 000 000 gezoomt haben und der sich im Zentrum Ihres Bildschirms befand. Um diesen Punkt herum ist der Maßstab überall anders.
Um zu verstehen, warum das so ist, stellen Sie sich einen Globus vor. Auf ihm verlaufen Linien von Nord nach Süd. Diese Längengrade liegen am Äquator weit auseinander, treffen sich jedoch an den Polen.
In einem Geographischen Koordinatensystem (GCS) arbeiten Sie auf einer solchen Kugeloberfläche, während die Darstellung auf Ihr Bildschirm jedoch flach ist. Wenn Sie versuchen, eine Kugel auf einer ebenen Fläche abzubilden, entstehen Verzerrungen – vergleichbar mit dem Versuch, einen aufgeschnittenen Tennisball flachzudrücken. Auf einer Karte führt dies dazu, dass die Längengrade stets den gleichen Abstand zueinander behalten, selbst an den Polen (wo sie eigentlich zusammenlaufen müssten). Das bedeutet: Je weiter Sie sich auf der Karte vom Äquator entfernen, desto größer wird der Maßstab der dargestellten Objekte. Für die praktische Arbeit heißt das schlicht, dass es auf unserer Karte keinen einheitlichen Maßstab gibt!
Um dieses Problem zu lösen, verwenden wir ein projiziertes Koordinatensystem. Ein projiziertes Koordinatensystem „projiziert“ oder transformiert die Geodaten so, dass die Maßstabsänderung berücksichtigt und korrigiert wird. Um den Maßstab konstant zu halten, sollten wir unsere Daten daher umprojizieren und ein projiziertes Koordinatensystem verwenden.
6.1.2. ★☆☆ Follow Along: „On the Fly“ Reprojection
By default, QGIS reprojects data „on the fly“. What this means is that even if the data itself is in another CRS, QGIS can project it as if it were in a CRS of your choice.
You can change the CRS of the project by clicking on the
 Current projection button in the bottom
right corner of QGIS.
In the dialog that appears, type the word
globalinto the Filter field. A few CRSs should appear in the Predefined Reference Systems field below.Select WGS 84 / NSIDC EASE-Grid 2.0 Global | EPSG:6933 entry by clicking on it, and then click OK.
Notice how the shape of South Africa changes. All projections work by changing the apparent shapes of objects on Earth.
Zoom to a scale of
1:5 000 000again, as before.Pan around the map.
Notice how the scale stays the same!
„On the fly“ reprojection is also used for combining datasets that are in different CRSs.
Add another vector layer to your map which has the data for South Africa only. You will find it as
exercise_data/world/RSA.shp.Load it. A quick way to see its CRS is by hovering the mouse over the layer in the legend. It is
EPSG:3410.What do you notice?
The layer is visible even if it has a different CRS from the
continentsone.
6.1.3. ★★☆ Follow Along: Saving a Dataset to Another CRS
Sometimes you need to export an existing dataset with another CRS. As we will see in the next lesson, if you need to make distance calculations on layer, it is always better to have the layer in a projected coordinate system.
Be aware that the ‚on the fly‘ reprojection is related to the project and not to single layers. This means that a layer can have a different CRS from the project even if you see it in the correct position.
You can easily export the layer with another CRS.
Add the
buildingsdataset fromtraining_data.gpkgRight-click on the
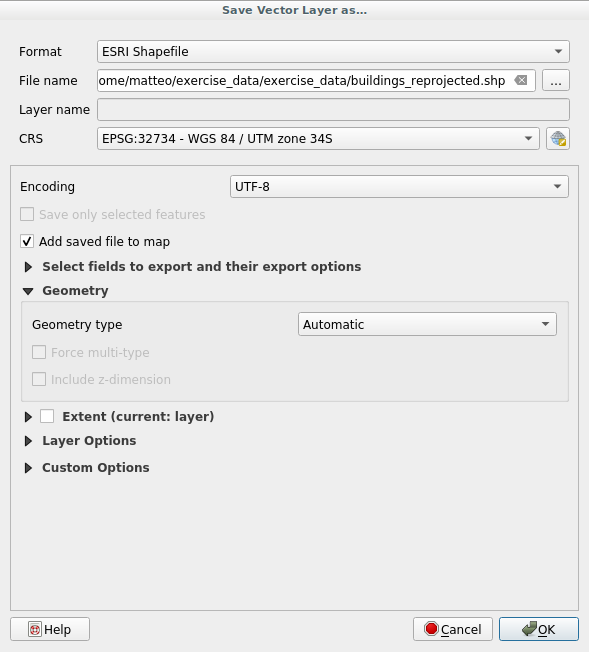
buildingslayer in the Layers panelSelect in the menu that appears. You will be shown the Save Vector Layer as… dialog.
Click on the Browse button next to the File name field
Navigate to
exercise_data/and specify the name of the new layer asbuildings_reprojected.shp.Change the value of the CRS. Only the recent CRSs used will be shown in the drop-down menu. Click on the
 Select projection button next
to the drop-down menu.
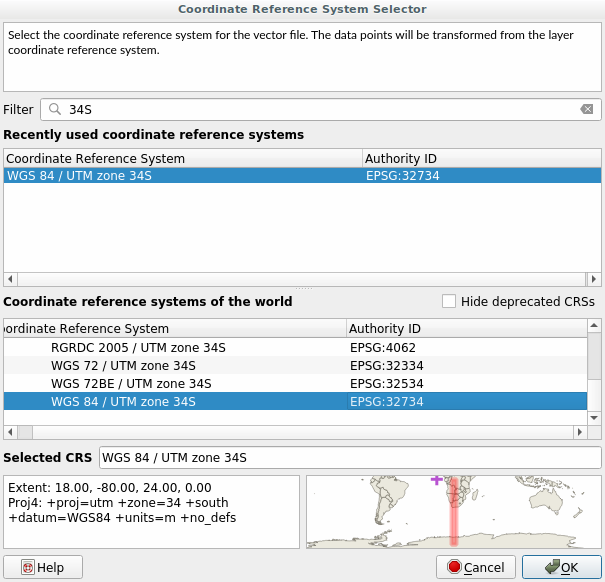
The Coordinate Reference System Selector dialog will appear. In its Filter field, search for
34S.Select WGS 84 / UTM zone 34S | EPSG:32734 from the list
Leave the other options unchanged. The Save Vector Layer as… dialog now looks like this:
Klicken Sie auf OK
You can now compare the old and new projections of the layer and see that they are in two different CRS but they are still overlapping.
6.1.4. ★★★ Follow Along: Creating Your Own Projection
There are many more projections than just those included in QGIS by default. You can also create your own projections.
Start a new map
Load the
world/oceans.shpdatasetGo to and you will see this dialog.
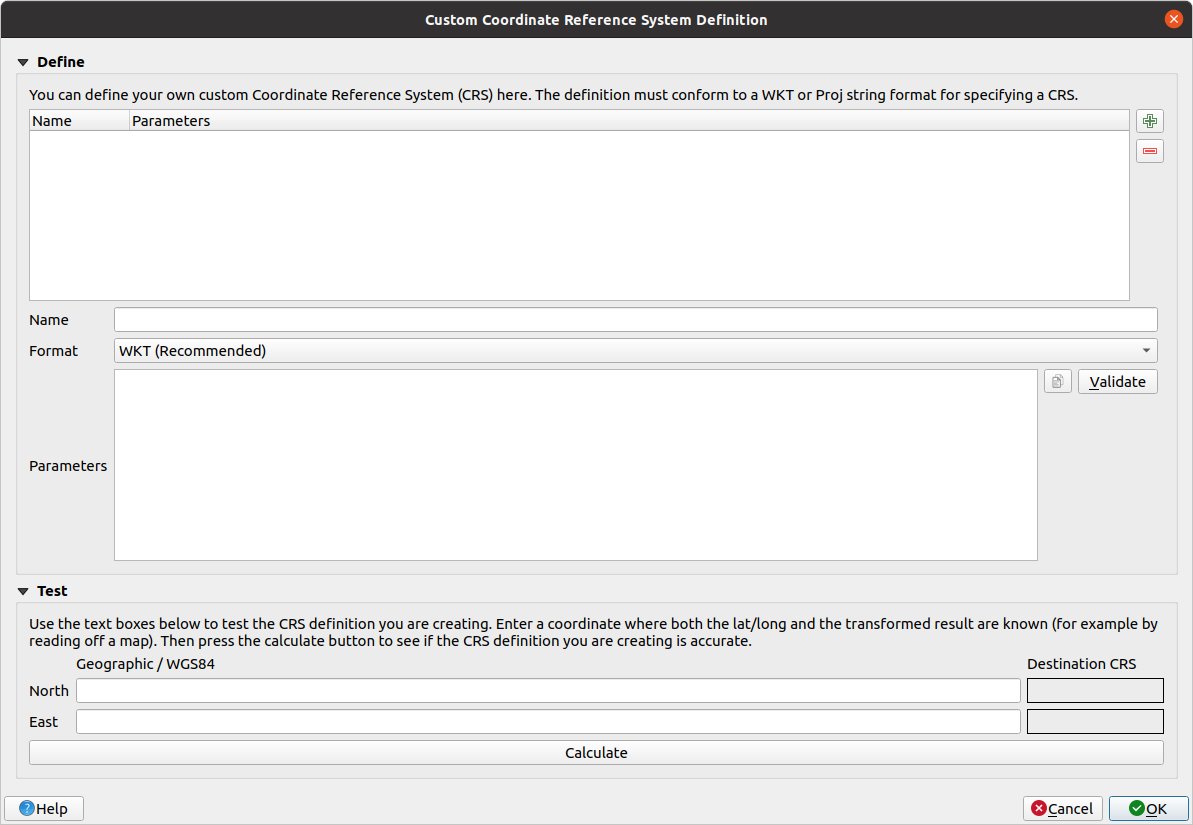
Click on the
 Add new CRS button to create a new
projection
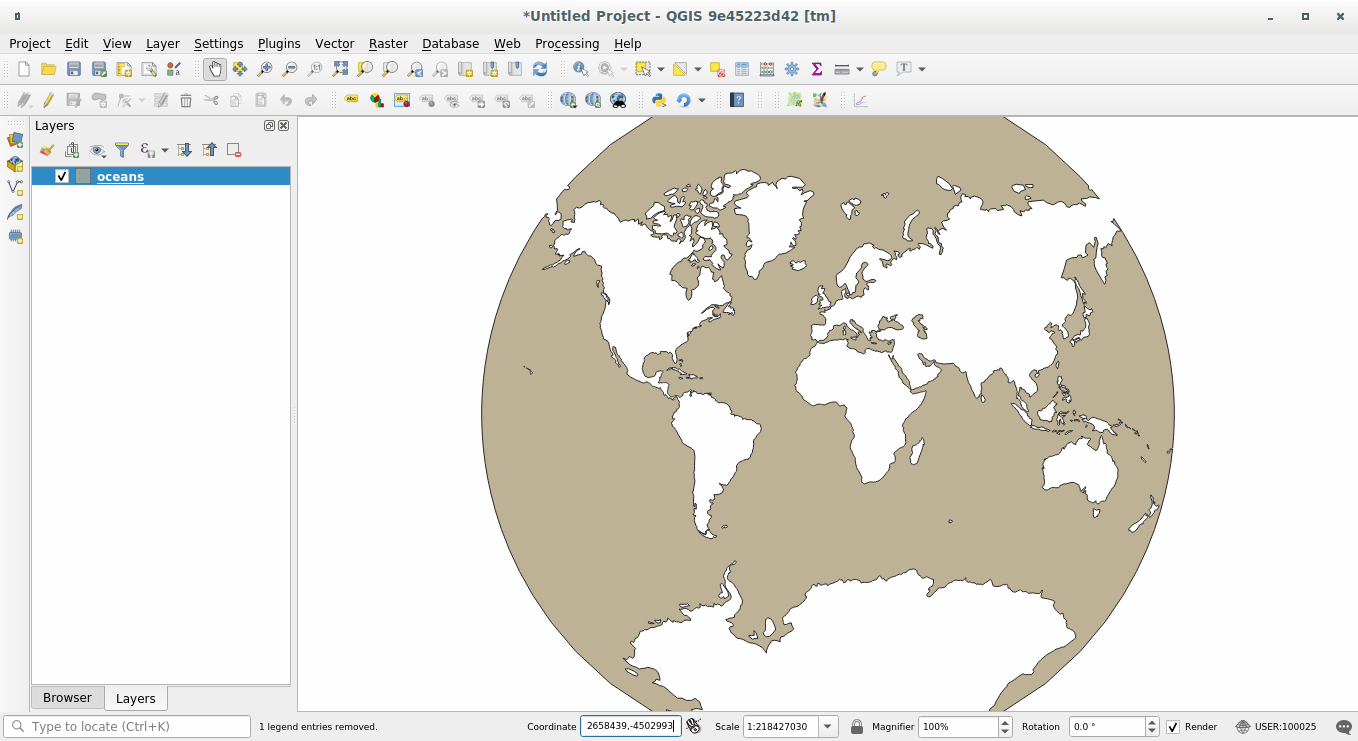
An interesting projection to use is called
Van der Grinten I. Enter its name in the Name field.This projection represents the Earth on a circular field instead of a rectangular one, as most other projections do.
In Format, select WKT (Recommended)
Add the following string in the Parameters field:
PROJCRS["unknown",
    BASEGEOGCRS["unknown",
        DATUM["unknown",
            ELLIPSOID["unknown",6371000,0,
                LENGTHUNIT["metre",1,
                    ID["EPSG",9001]]]],
        PRIMEM["Greenwich",0,
            ANGLEUNIT["degree",0.0174532925199433],
            ID["EPSG",8901]]],
    CONVERSION["unknown",
        METHOD["Van Der Grinten"],
        PARAMETER["Longitude of natural origin",0,
            ANGLEUNIT["degree",0.0174532925199433],
            ID["EPSG",8802]],
        PARAMETER["False easting",0,
            LENGTHUNIT["metre",1],
            ID["EPSG",8806]],
        PARAMETER["False northing",0,
            LENGTHUNIT["metre",1],
            ID["EPSG",8807]]],
    CS[Cartesian,2],
        AXIS["(E)",east,
            ORDER[1],
            LENGTHUNIT["metre",1,
                ID["EPSG",9001]]],
        AXIS["(N)",north,
            ORDER[2],
            LENGTHUNIT["metre",1,
                ID["EPSG",9001]]]]
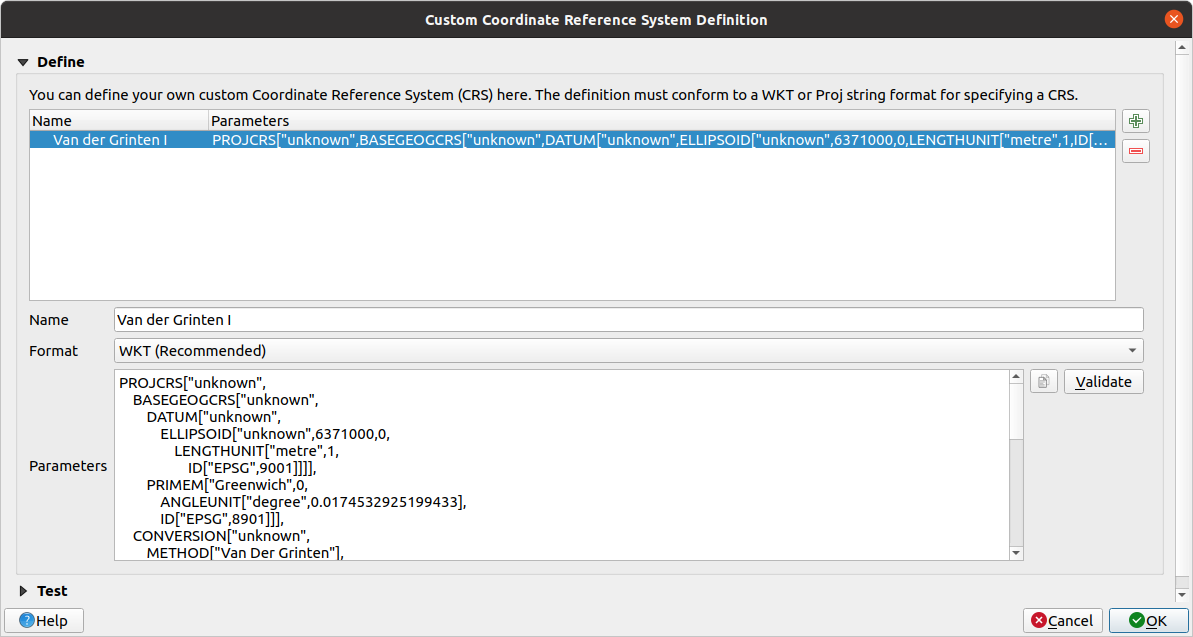
Klicken Sie auf OK
Click on the
Current CRS button at the
right of the status bar to change the project CRSChoose your newly defined projection (search for its name in the Filter field)
On applying this projection, the map will be reprojected thus:
6.1.5. Zusammenfassung
Different projections are useful for different purposes. By choosing the correct projection, you can ensure that the features on your map are being represented accurately.
6.1.6. Weiterlesen
Materials for the Advanced section of this lesson were taken from this article.
Read further information on Coordinate Reference Systems.
6.1.7. Was kommt als Nächstes?
In the next lesson you will learn how to analyze vector data using QGIS‘ various vector analysis tools.