9.2. 课: 常用的QGIS插件
现在,您可以安装、启用和禁用插件了。让我们通过一些常用插件的示例,来了解这在实践中如何操作。
本课目标: 熟悉插件界面,并了解一些有用的插件。
9.2.1.  跟我做: QuickMapServices插件
The QuickMapServices plugin is a simple and easy to use plugin that adds base maps to your QGIS project. It has many different options and settings. Let's start to explore some of its features.
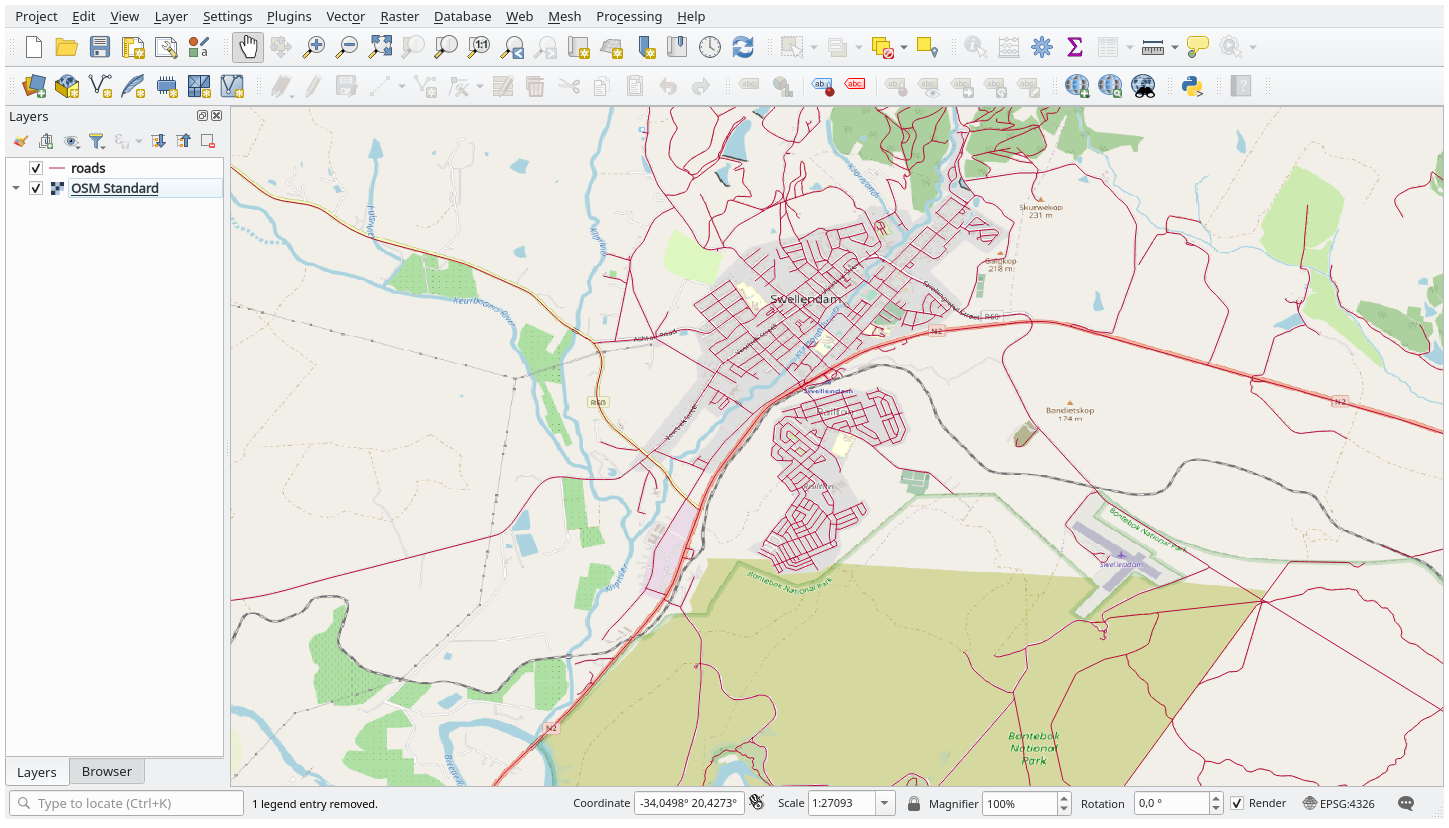
新建工程并从
training_dataGeopackage 中添加 roads 图层。安装 QuickMapServices 插件。
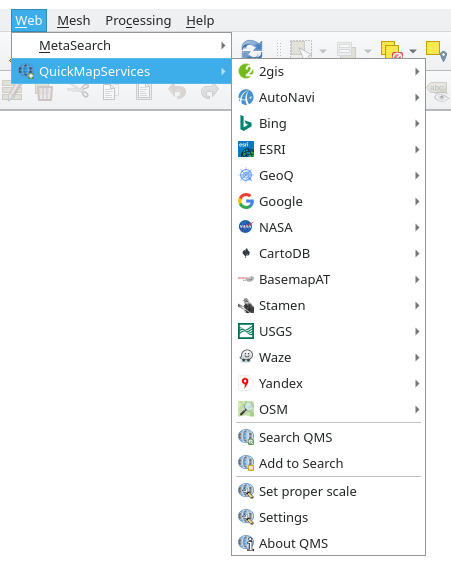
Click on . The first menu lists different map providers (
OSM,NASA) with available maps.Click on an entry and you would load the base map into your project.
Nice! But one of the main strengths of QMS is to provide access to many data providers. Let's add them.
Click on
Go to the More services tab.
仔细阅读此选项卡的信息,如果您同意,请单击 Get Contributed pack 按钮。
Click Save.
Reopen the menu you will see that more providers are available.
Choose the one that best fits your needs, and load the data in the project!
It is also possible to search trough the now available data providers
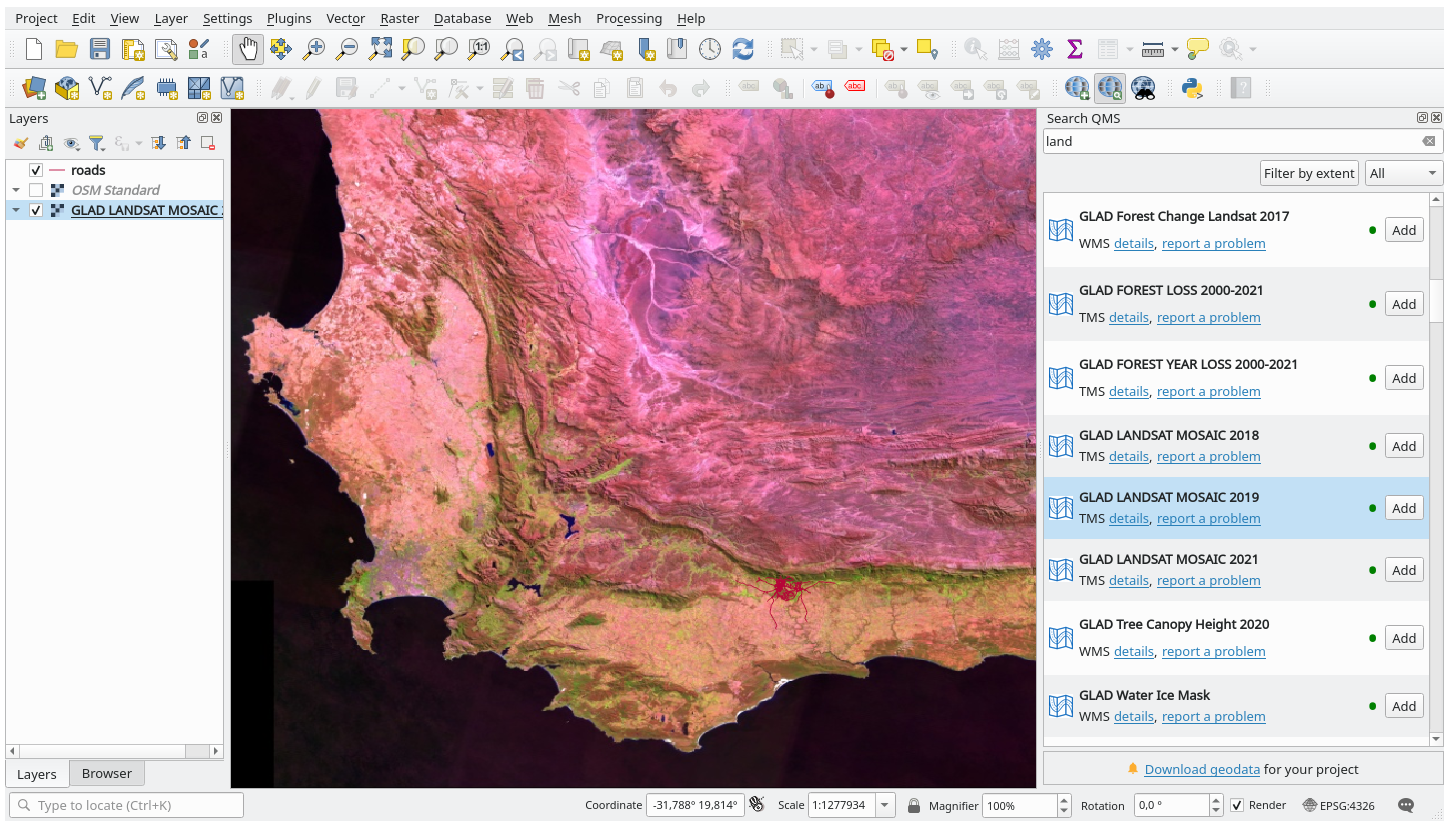
Open the plugin's search tab by clicking on . This option of the plugin allows you to filter the available base maps by the current extent of the map canvas or using a search word.
Click on the Filter by extent and you should see one service available. If no service is found, zoom out and pan around the world (or your location) or search with a keyword.
Click on the Add button next to a returned dataset to load it.
The base map will be loaded and you will have a background for the map.
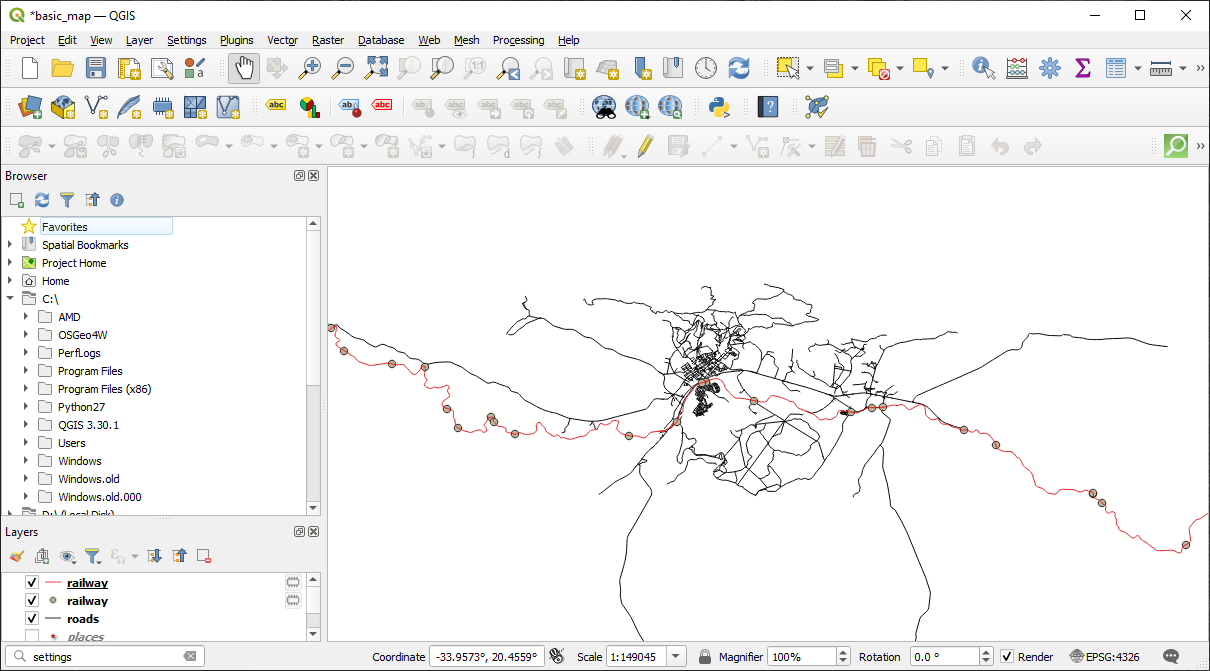
9.2.2. 跟我做: QuickOSM插件
QuickOSM插件有着令人难以置信的简洁界面,可以让您下载 开放街道地图 数据。
启动一个新的空工程,并从
training_dataGeoPackage 添加 roads 图层。安装 QuickOSM 插件。该插件在QGIS工具栏中添加了两个新按钮,并可以在 菜单访问。由于QuickOSM已完全汉化,以下涉及到该软件的界面将使用中文。
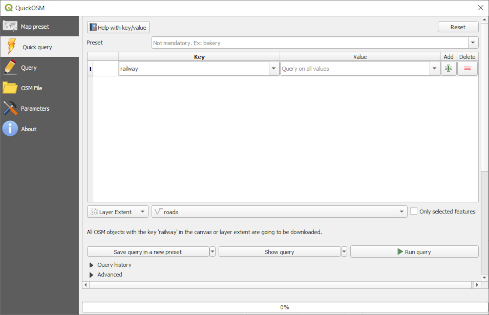
打开QuickOSM对话框。该插件有许多不同的选项卡:我们将使用 快速查询 。
您可以通过选择常用 关键字 下载指定要素,也可以更具体地选择指定的 关键字 和 值 对。
小技巧
如果您不熟悉 关键字 和 值 的方法,请单击 关键字/值帮助 按钮,它将打开完整描述开放街道地图概念的网页。
在 关键字 菜单查找 railway ,并将其 值 设为空:如此,我们将下载所有 railway 要素,而不指定具体值。
在下一个下拉菜单中选择 图层范围 ,然后选择 roads 。
单击 运行查询 按钮。
几秒钟后,插件将下载开放街道地图中标记为 railway 的所有要素,并将它们直接加载到地图中。
仅此而已!所有图层都加载到图例中,并显示在地图画布。
警告
QuickOSM在下载数据时创建临时图层。如果要永久保存,请单击图层旁边的  图标,然后选择您喜欢的选项。或者,可以在QuickOSM中打开 高级 菜单,并在 目录 菜单中选择保存数据的位置。
9.2.3.  跟我做: QuickOSM查询引擎
从QuickOSM插件下载数据的最快方法是使用 快速查询 选项卡并设置一些小参数。但如果您需要更具体的数据呢?
如果您是开放街道地图查询大师,也可以在个性查询中使用QuickOSM插件。
QuickOSM有一个令人难以置信的数据解析器,再加上令人惊叹的Overpass查询引擎,可以让您根据自己的特定需求下载数据。
例如:我们想下载属于 Dolomites 指定山区的山峰。
使用 快速查询 选项卡无法完成此任务,必须更具体编写自己的查询。让我们尝试完成这样的任务。
启动一个新工程。
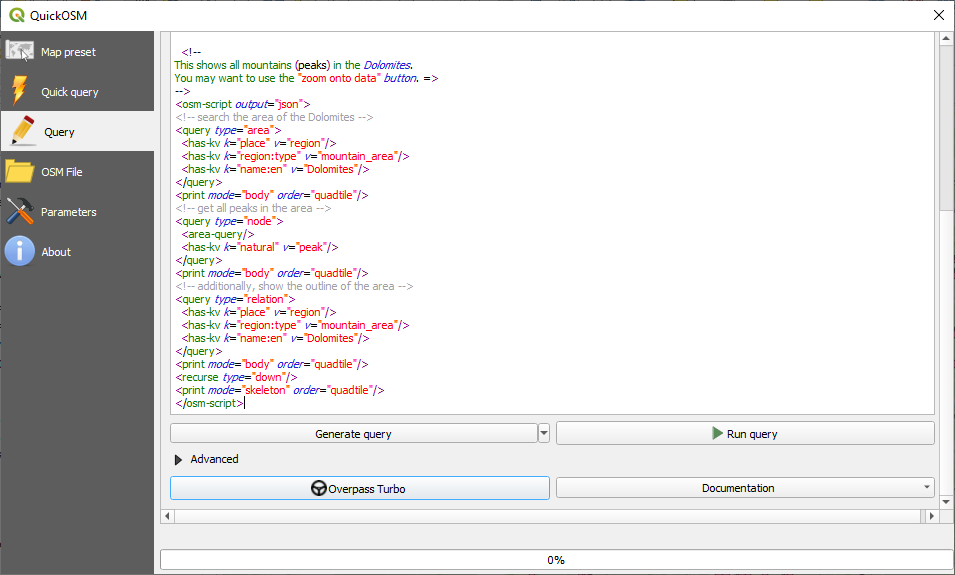
打开QuickOSM插件并单击 查询 选项卡。
将以下代码复制并粘贴到查询画布中:
  <!--
This shows all mountains (peaks) in the Dolomites.
You may want to use the "zoom onto data" button. =>
-->
<osm-script output="json">
<!-- search the area of the Dolomites -->
<query type="area">
  <has-kv k="place" v="region"/>
  <has-kv k="region:type" v="mountain_area"/>
  <has-kv k="name:en" v="Dolomites"/>
</query>
<print mode="body" order="quadtile"/>
<!-- get all peaks in the area -->
<query type="node">
  <area-query/>
  <has-kv k="natural" v="peak"/>
</query>
<print mode="body" order="quadtile"/>
<!-- additionally, show the outline of the area -->
<query type="relation">
  <has-kv k="place" v="region"/>
  <has-kv k="region:type" v="mountain_area"/>
  <has-kv k="name:en" v="Dolomites"/>
</query>
<print mode="body" order="quadtile"/>
<recurse type="down"/>
<print mode="skeleton" order="quadtile"/>
</osm-script>
备注
此查询是用类似
xml语言编写的。如果您更习惯Overpass QL,也可以用这种语言编写查询。然后单击 运行查询 :
将下载山峰图层,并在QGIS中显示:
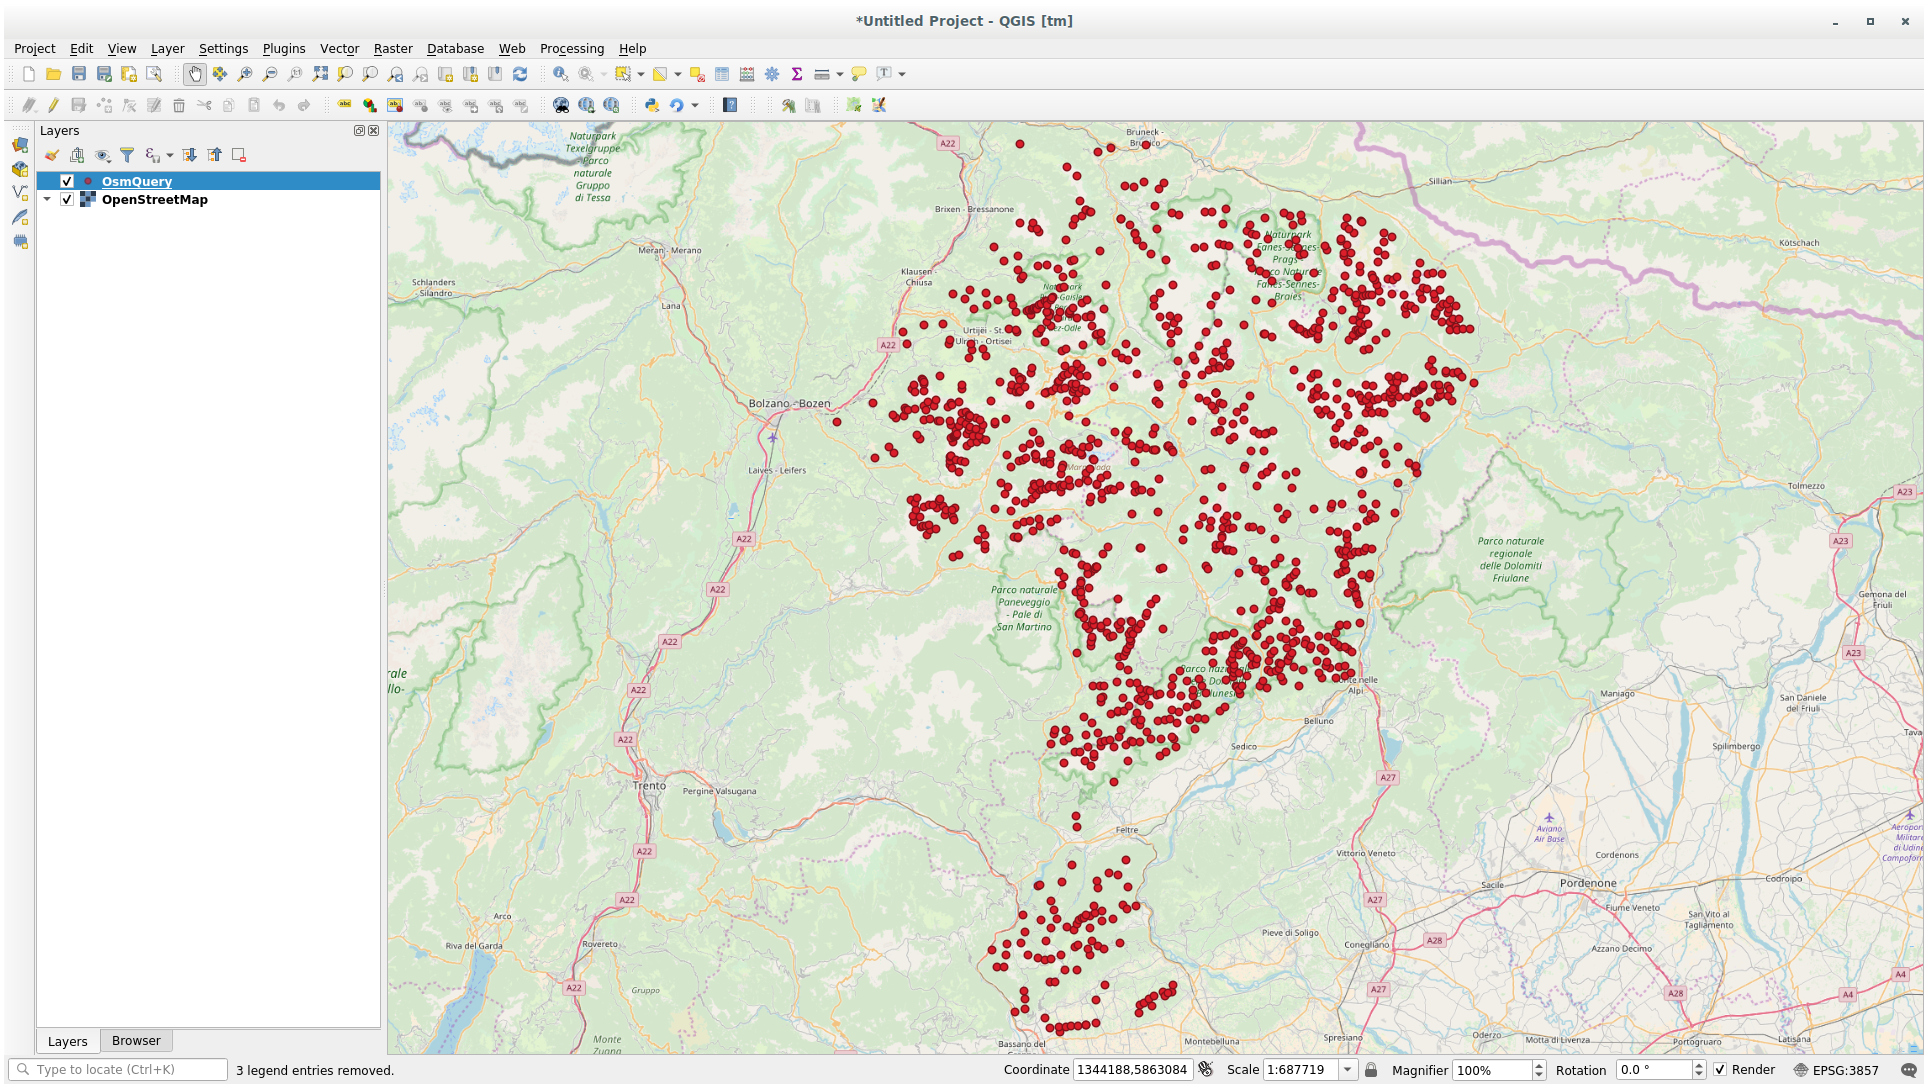
您可以使用 Overpass查询语言 编写复杂的查询。查看一些例子,并尝试探索该查询语言。
9.2.4. 跟我做: DataPlotly插件
The DataPlotly plugin allows you to create D3 plots of vector attributes data thanks to the plotly library.
开始一个新工程
从
exercise_data/plugins文件夹加载 sample_points 图层按照 跟我做: 安装新插件 中描述的方法搜索 Data Plotly 插件并进行安装
单击工具栏中的新图标或 菜单打开该插件
在下面的示例中,我们将创建 sample_points 图层的两个字段的 散点图 。在DataPlotly面板中:
在图层过滤器中选择 sample_points , X Field 选择 cl , Y Field 选择 mg :
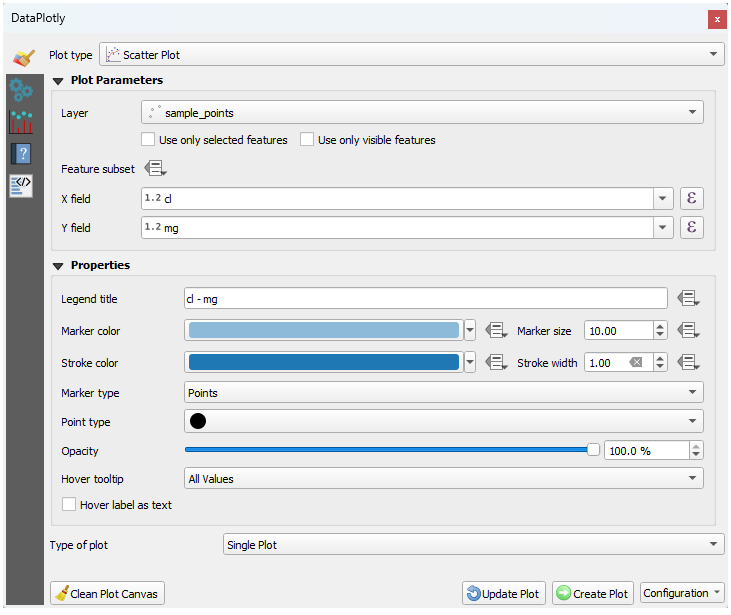
如果需要,可以更改颜色、标记类型、透明度和许多其他设置。尝试更改一些参数以创建下面的图表。
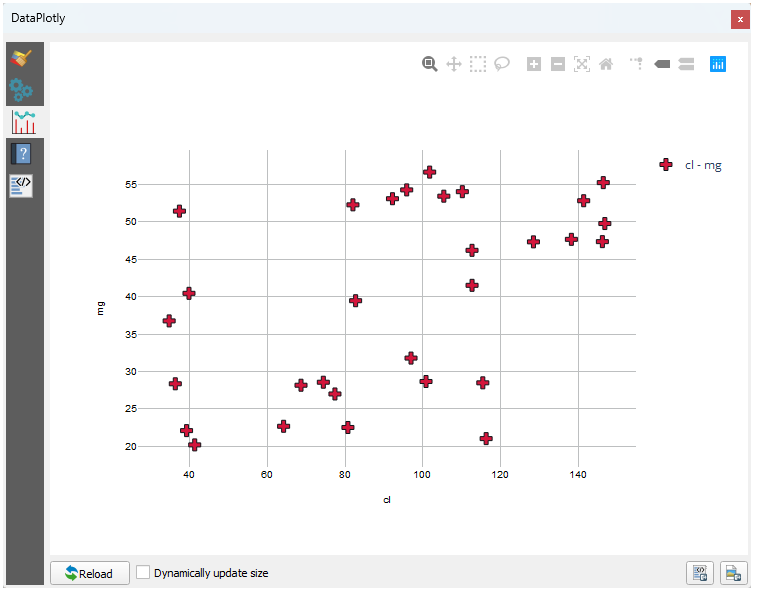
设置完所有参数后,单击 Create Plot 按钮创建图表。
图表是交互式的:这意味着您可以使用上面的所有按钮来重新调整图表画布的大小、移动或放大/缩小。此外,图表的每个元素都是交互式的:通过单击或选择图表上的一个或多个点,将在图表画布中选择相应的点。
通过单击  或图表右下角的
  按钮,可以将图表保存为
 png 静态图像或 html 文件。
还有更多。有时,在同一页面上有两个 (或更多) 显示不同图表类型和不同变量的图表是非常有用的。让我们开工吧!
单击插件面板左上角的
 按钮,返回主图表设置选项卡
将 Plot Type 更改为 Box Plot
选择 group 作为 Grouping Field ,选择 ph 作为 Y Field
在面板下部,将 Type of Plot 从 SinglePlot 更改为 SubPlots ,并选择默认选项 Plot in Rows 。
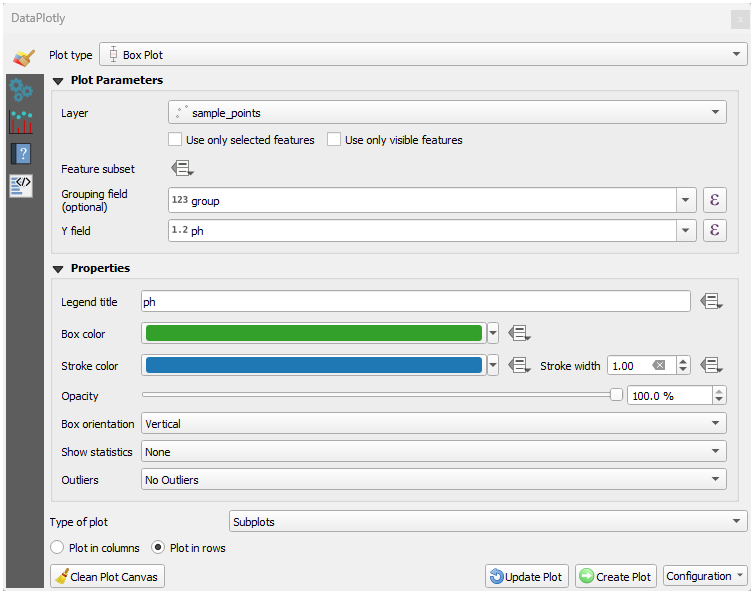
完成后,单击 Create Plot 按钮绘制图表
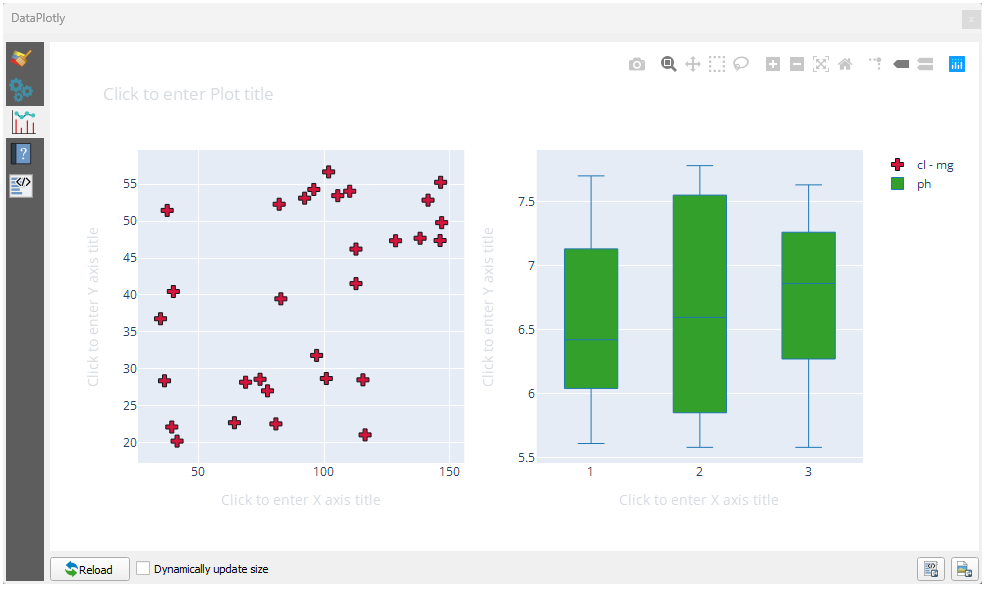
现在散点图和箱形图都显示在同一图表页面中。您仍然可以单击每个图表项,并在地图画布中选择相应的要素。
小技巧
每个图表在  选项卡中都有自己的手册页。尝试探索所有图表类型,并查看所有其他可用设置。
9.2.5. In Conclusion
QGIS有很多实用的插件。使用内置工具来安装和管理这些插件,您可以找到新的插件并充分利用它们。
9.2.6. What's Next?
接下来,我们将了解如何实时使用托管在远程服务器上的图层。