16.3. IDE settings for writing and debugging plugins
Although each programmer has his preferred IDE/Text editor, here are some recommendations for setting up popular IDE’s for writing and debugging QGIS Python plugins.
16.3.1. Useful plugins for writing Python plugins
Some plugins are convenient when writing Python plugins. From , install:
Plugin reloader: This will let you reload a plugin and pull new changes without restarting QGIS.
First Aid: This will add a Python console and local debugger to inspect variables when an exception is raised from a plugin.
Warning
Despite our constant efforts, information beyond this line may not be updated for QGIS 3. Refer to https://qgis.org/pyqgis/master for the python API documentation or, give a hand to update the chapters you know about. Thanks.
16.3.2. A note on configuring your IDE on Linux and Windows
On Linux, all that usually needs to be done is to add the QGIS library locations
to the user’s PYTHONPATH environment variable. Under most distributions,
this can be done by editing ~/.bashrc or ~/.bash-profile with
the following line (tested on OpenSUSE Tumbleweed):
export PYTHONPATH="$PYTHONPATH:/usr/share/qgis/python/plugins:/usr/share/qgis/python"
Save the file and implement the environment settings by using the following shell command:
source ~/.bashrc
On Windows, you need to make sure that you have the same environment settings and use the same libraries and interpreter as QGIS. The fastest way to do this is to modify the startup batch file of QGIS.
If you used the OSGeo4W Installer, you can find this under the bin folder
of your OSGeo4W install. Look for something like
C:\OSGeo4W\bin\qgis-unstable.bat.
16.3.3. Debugging using Pyscripter IDE (Windows)
For using Pyscripter IDE, here’s what you have to do:
Make a copy of
qgis-unstable.batand rename itpyscripter.bat.Open it in an editor. And remove the last line, the one that starts QGIS.
Add a line that points to your Pyscripter executable and add the command line argument that sets the version of Python to be used
Also add the argument that points to the folder where Pyscripter can find the Python dll used by QGIS, you can find this under the bin folder of your OSGeoW install
@echo off
SET OSGEO4W_ROOT=C:\OSGeo4W
call "%OSGEO4W_ROOT%"\bin\o4w_env.bat
call "%OSGEO4W_ROOT%"\bin\gdal16.bat
@echo off
path %PATH%;%GISBASE%\bin
Start C:\pyscripter\pyscripter.exe --python25 --pythondllpath=C:\OSGeo4W\bin
Now when you double click this batch file it will start Pyscripter, with the correct path.
More popular than Pyscripter, Eclipse is a common choice among developers. In the following section, we will be explaining how to configure it for developing and testing plugins.
16.3.4. Debugging using Eclipse and PyDev
16.3.4.1. Installation
To use Eclipse, make sure you have installed the following
QGIS 2.x
You may also want to install Remote Debug, a QGIS plugin. At the moment it’s still experimental so enable
 Experimental plugins
under
beforehand.
Experimental plugins
under
beforehand.
To prepare your environment for using Eclipse in Windows, you should also create a batch file and use it to start Eclipse:
Locate the folder where
qgis_core.dllresides in. Normally this isC:\OSGeo4W\apps\qgis\bin, but if you compiled your own QGIS application this is in your build folder inoutput/bin/RelWithDebInfoLocate your
eclipse.exeexecutable.Create the following script and use this to start eclipse when developing QGIS plugins.
call "C:\OSGeo4W\bin\o4w_env.bat"
set PATH=%PATH%;C:\path\to\your\qgis_core.dll\parent\folder
start /B C:\path\to\your\eclipse.exe
16.3.4.2. Setting up Eclipse
In Eclipse, create a new project. You can select General Project and link your real sources later on, so it does not really matter where you place this project.
Fig. 16.111 Eclipse project
Right-click your new project and choose .
Click Advanced and choose Link to alternate location (Linked Folder). In case you already have sources you want to debug, choose these. In case you don’t, create a folder as it was already explained.
Now in the view Project Explorer, your source tree pops up and you can start working with the code. You already have syntax highlighting and all the other powerful IDE tools available.
16.3.4.3. Configuring the debugger
To get the debugger working:
Switch to the Debug perspective in Eclipse ().
start the PyDev debug server by choosing .
Eclipse is now waiting for a connection from QGIS to its debug server and when QGIS connects to the debug server it will allow it to control the python scripts. That’s exactly what we installed the Remote Debug plugin for. So start QGIS in case you did not already and click the bug symbol.
Now you can set a breakpoint and as soon as the code hits it, execution will stop and you can inspect the current state of your plugin. (The breakpoint is the green dot in the image below, set one by double clicking in the white space left to the line you want the breakpoint to be set).
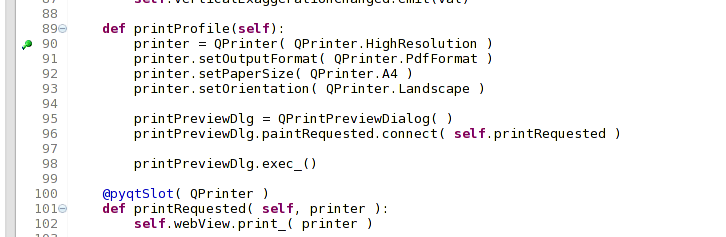
Fig. 16.112 Breakpoint
A very interesting thing you can make use of now is the debug console. Make sure that the execution is currently stopped at a break point, before you proceed.
Open the Console view (). It will show the Debug Server console which is not very interesting. But there is a button Open Console which lets you change to a more interesting PyDev Debug Console.
Click the arrow next to the Open Console button and choose PyDev Console. A window opens up to ask you which console you want to start.
Choose PyDev Debug Console. In case its greyed out and tells you to Start the debugger and select the valid frame, make sure that you’ve got the remote debugger attached and are currently on a breakpoint.
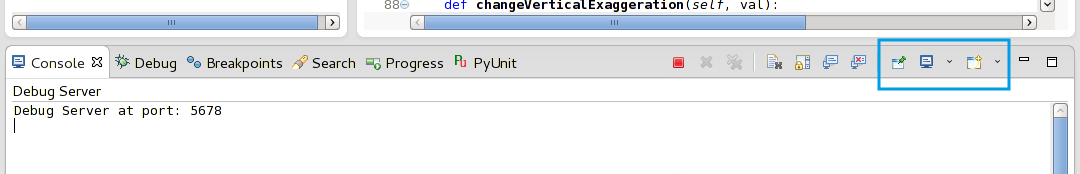
Fig. 16.113 PyDev Debug Console
You have now an interactive console which lets you test any commands from within the current context. You can manipulate variables or make API calls or whatever you like.
Tip
A little bit annoying is, that every time you enter a command, the console switches back to the Debug Server. To stop this behavior, you can click the Pin Console button when on the Debug Server page and it should remember this decision at least for the current debug session.
16.3.4.4. Making eclipse understand the API
A very handy feature is to have Eclipse actually know about the QGIS API. This enables it to check your code for typos. But not only this, it also enables Eclipse to help you with autocompletion from the imports to API calls.
To do this, Eclipse parses the QGIS library files and gets all the information out there. The only thing you have to do is to tell Eclipse where to find the libraries.
Click .
You will see your configured python interpreter in the upper part of the window (at the moment python2.7 for QGIS) and some tabs in the lower part. The interesting tabs for us are Libraries and Forced Builtins.
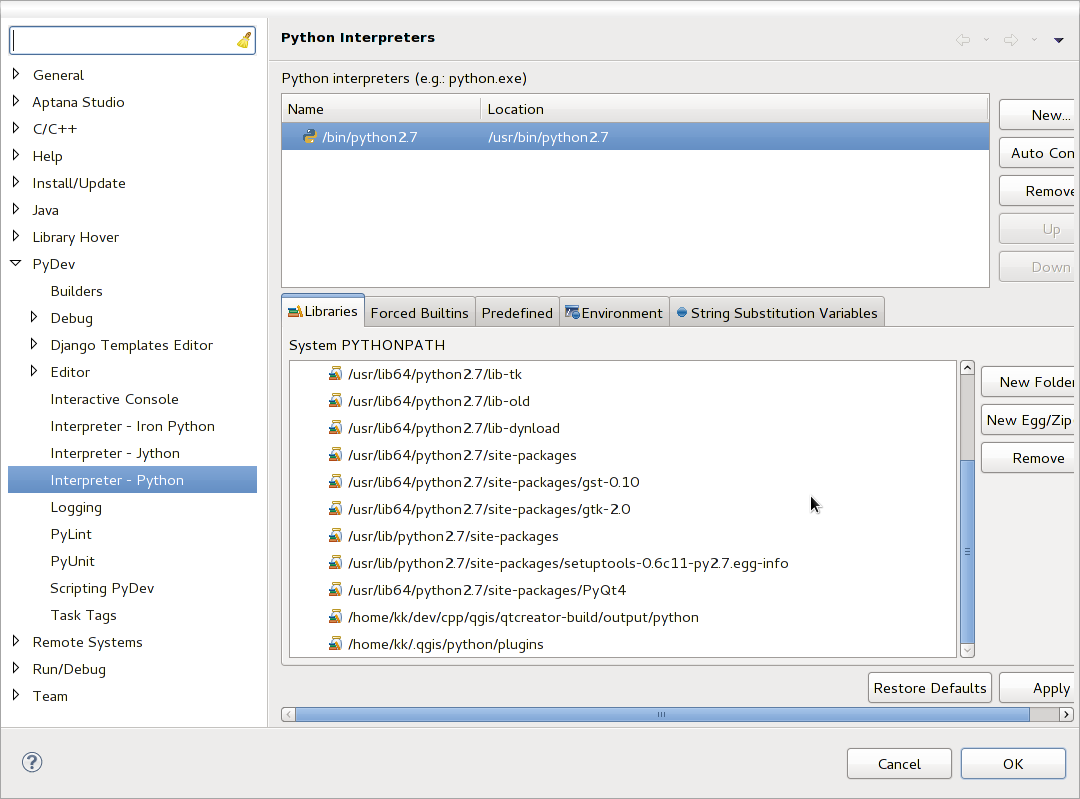
Fig. 16.114 PyDev Debug Console
First open the Libraries tab.
Add a New Folder and choose the python folder of your QGIS installation. If you do not know where this folder is (it’s not the plugins folder):
Open QGIS
Start a python console
Enter
qgisand press Enter. It will show you which QGIS module it uses and its path.
Strip the trailing
/qgis/__init__.pycfrom this path and you’ve got the path you are looking for.
You should also add your plugins folder here (it is in
python/pluginsunder the user profile folder).Next jump to the Forced Builtins tab, click on New… and enter
qgis. This will make Eclipse parse the QGIS API. You probably also want Eclipse to know about the PyQt API. Therefore also add PyQt as forced builtin. That should probably already be present in your libraries tab.Click OK and you’re done.
Note
Every time the QGIS API changes (e.g. if you’re compiling QGIS master and the SIP file changed), you should go back to this page and simply click Apply. This will let Eclipse parse all the libraries again.
16.3.5. Debugging with PyCharm on Ubuntu with a compiled QGIS
PyCharm is an IDE for Python developed by JetBrains. There is a free version called Community Edition and a paid one called Professional. You can download PyCharm on the website: https://www.jetbrains.com/pycharm/download
We are assuming that you have compiled QGIS on Ubuntu with the given
build directory ~/dev/qgis/build/master. It’s not compulsory to have
a self compiled QGIS, but only this has been tested. Paths must be adapted.
In PyCharm, in your Project Properties, Project Interpreter, we are going to create a Python Virtual environment called
QGIS.Click the small gear and then Add.
Select Virtualenv environment.
Select a generic location for all your Python projects such as
~/dev/qgis/venvbecause we will use this Python interpreter for all our plugins.Choose a Python 3 base interpreter available on your system and check the next two options Inherit global site-packages and Make available to all projects.
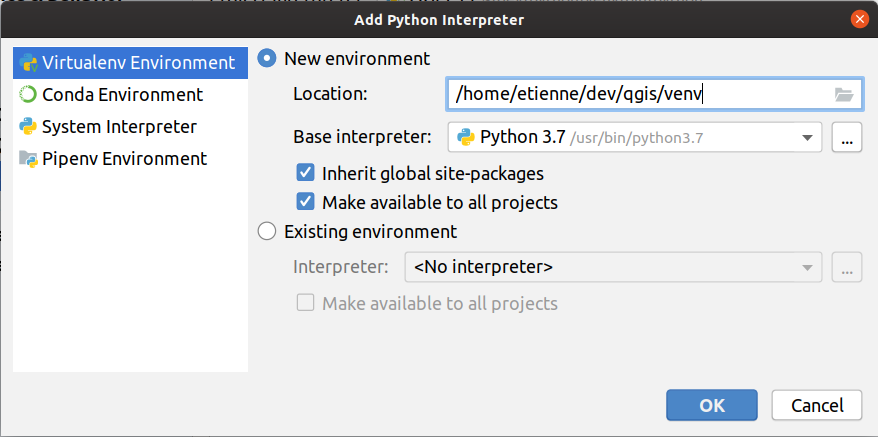
Click OK, come back on the small gear and click Show all.
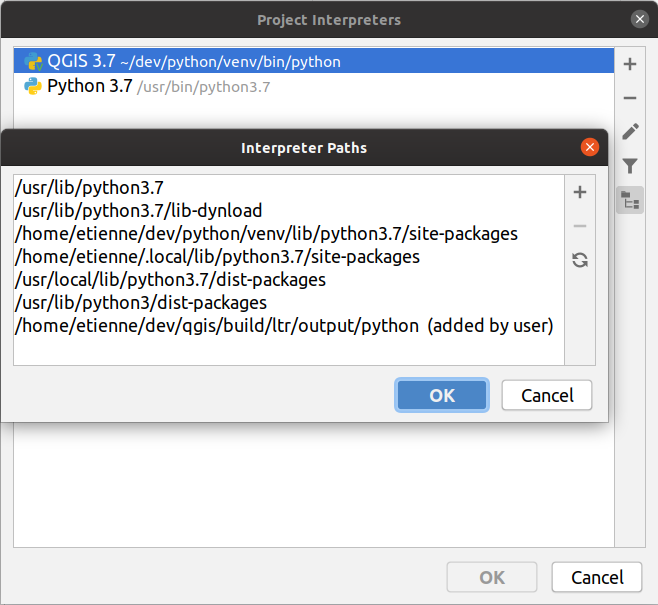
In the new window, select your new interpreter
QGISand click the last icon in the vertical menu Show paths for the selected interpreter.Finally, add the following absolute path to the list
~/dev/qgis/build/master/output/python.
Restart PyCharm and you can start using this new Python virtual environment for all your plugins.
PyCharm will be aware of the QGIS API and also of the PyQt API if you use Qt
provided by QGIS like from qgis.PyQt.QtCore import QDir.
The autocompletion should work and PyCharm can inspect your code.
In the professional version of PyCharm, remote debugging is working well. For the Community edition, remote debugging is not available. You can only have access to a local debugger, meaning that the code must run inside PyCharm (as script or unittest), not in QGIS itself. For Python code running in QGIS, you might use the First Aid plugin mentioned above.
16.3.6. Debugging using PDB
If you do not use an IDE such as Eclipse or PyCharm, you can debug using PDB, following these steps.
First add this code in the spot where you would like to debug
# Use pdb for debugging
import pdb
# also import pyqtRemoveInputHook
from qgis.PyQt.QtCore import pyqtRemoveInputHook
# These lines allow you to set a breakpoint in the app
pyqtRemoveInputHook()
pdb.set_trace()
Then run QGIS from the command line.
On Linux do:
$ ./QgisOn macOS do:
$ /Applications/Qgis.app/Contents/MacOS/QgisAnd when the application hits your breakpoint you can type in the console!
- TODO:
Add testing information