14.9. Lesson: Map Presentation
In the previous lessons you have imported an old forest inventor as a GIS project, updated it to the current situation, designed a forest inventory, created maps for the field work and calculated forest parameters from the field measurements.
It is often important to create maps with the results of a GIS project. A map presenting the results of the forest inventory will make it easier for anyone to have a good idea of what the results are in a quick glance, without looking at the specific numbers.
The goal for this lesson: Create a map to present the inventory results using a hillshade raster as background.
14.9.1.  Follow Along: Preparing the Map Data
Open the QGIS project from the parameters calculations lesson, forest_inventory.qgs. Keep at least the following layers:
forest_stands_2012_results.
basic_map.
rautjarvi_aerial.
lakes (if you don’t have it, add it from the exercise_data\forestry\ folder).
You are going to present the average volumes of your forest stands in a map. If you open the Attribute table for the forest_stands_2012_results layer, you can see the NULL values for the stands without information. To be able to get also those stands into your symbology you should change the NULL values to, for example, -999, knowing that those negative numbers mean there is no data for those polygons.
For the forest_stands_2012_results layer:
Open the Attribute table and enable editing.
Select the polygons with NULL values.
Use the calculator to update the values of the MEANVol field to -999 only for the selected features.
Disable editing and save the changes.
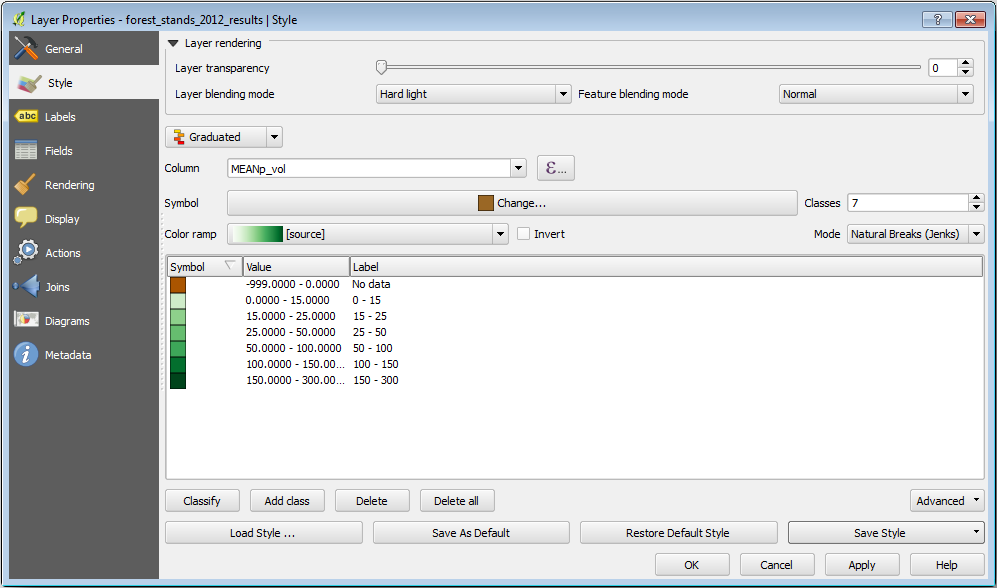
Now you can use a saved style for this layer:
Go to the Symbology tab.
Click on .
Select the forest_stands_2012_results.qml from the exercise_data\forestry\results\ folder.
Click OK.
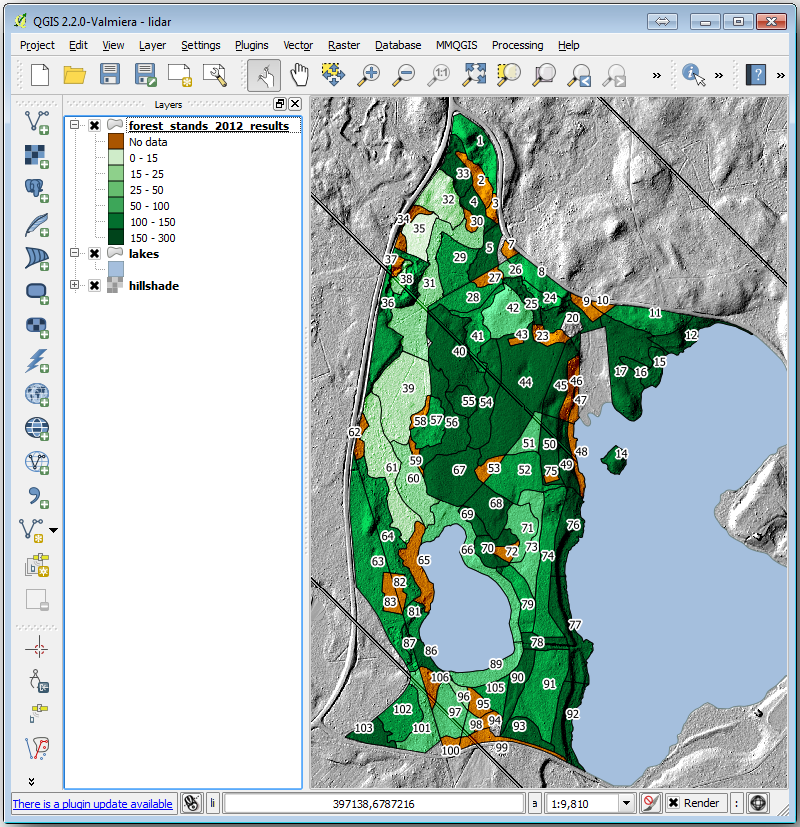
Your map will look something like this:
14.9.2. Try Yourself Try Different Blending Modes
The style you loaded:
is using the Hard light mode for the Layer blending mode. Note that the different modes apply different filters combining the underlying and overlying layers, in this case the hillshade raster and your forest stands are used. You can read about these modes in the User Guide.
Try with different modes and see the differences in your map. Then choose the one you like better for your final map.
14.9.3. Try Yourself Using a Layout Template to Create the Map result
Use a template prepared in advanced to present the results. The template forest_map.qpt is located in the exercise_data\forestry\results\ folder. Load it using the dialog.
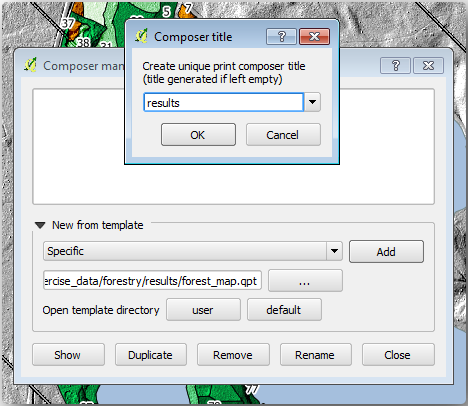
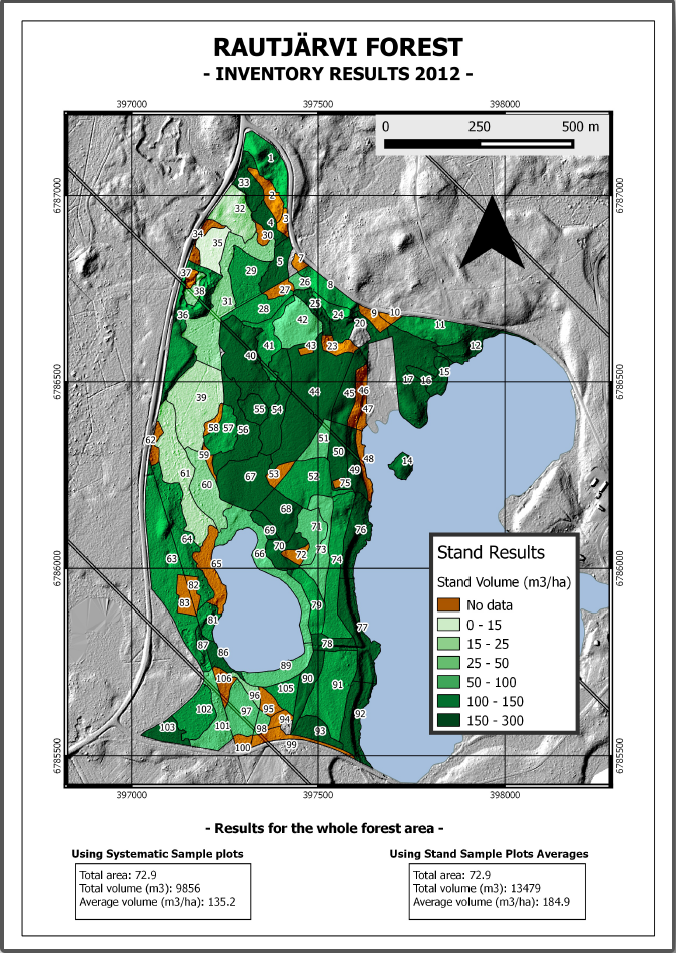
Open the print layout and edit the final map to get a result you are happy with.
The map template you are using will give a map similar to this one:
Save your QGIS project for future references.
14.9.4. In Conclusion
Through this module you have seen how a basic forest inventory can be planned and presented with QGIS. Many more forest analysis are possible with the variety of tools that you can access, but hopefully this manual has given you a good starting point to explore how you could achieve the specific results you need.