2.2. Lesson: Adding your first layers
Vom porni aplicația, și vom crea o hartă de bază, pentru utilizarea în exemple și exerciții.
Scopul acestei lecții: De a începe cu un exemplu de hartă.
Notă
Before starting this exercise, QGIS must be installed on your computer. Also, you should have downloaded the sample data to use.
Lansați QGIS cu ajutorul scurtăturii de pe ecran, din meniul de strat, etc., în funcție de modul în care ați efectuat instalarea.
Notă
The screenshots for this course were taken in QGIS 3.4 running on Linux. Depending on your setup, the screens you encounter may well appear somewhat different. However, all the same buttons will still be available, and the instructions will work on any OS. You will need QGIS 3.4 (the latest version at time of writing) to use this course.
Să începem imediat!
2.2.1.  Follow Along: Pregătirea unei hărți
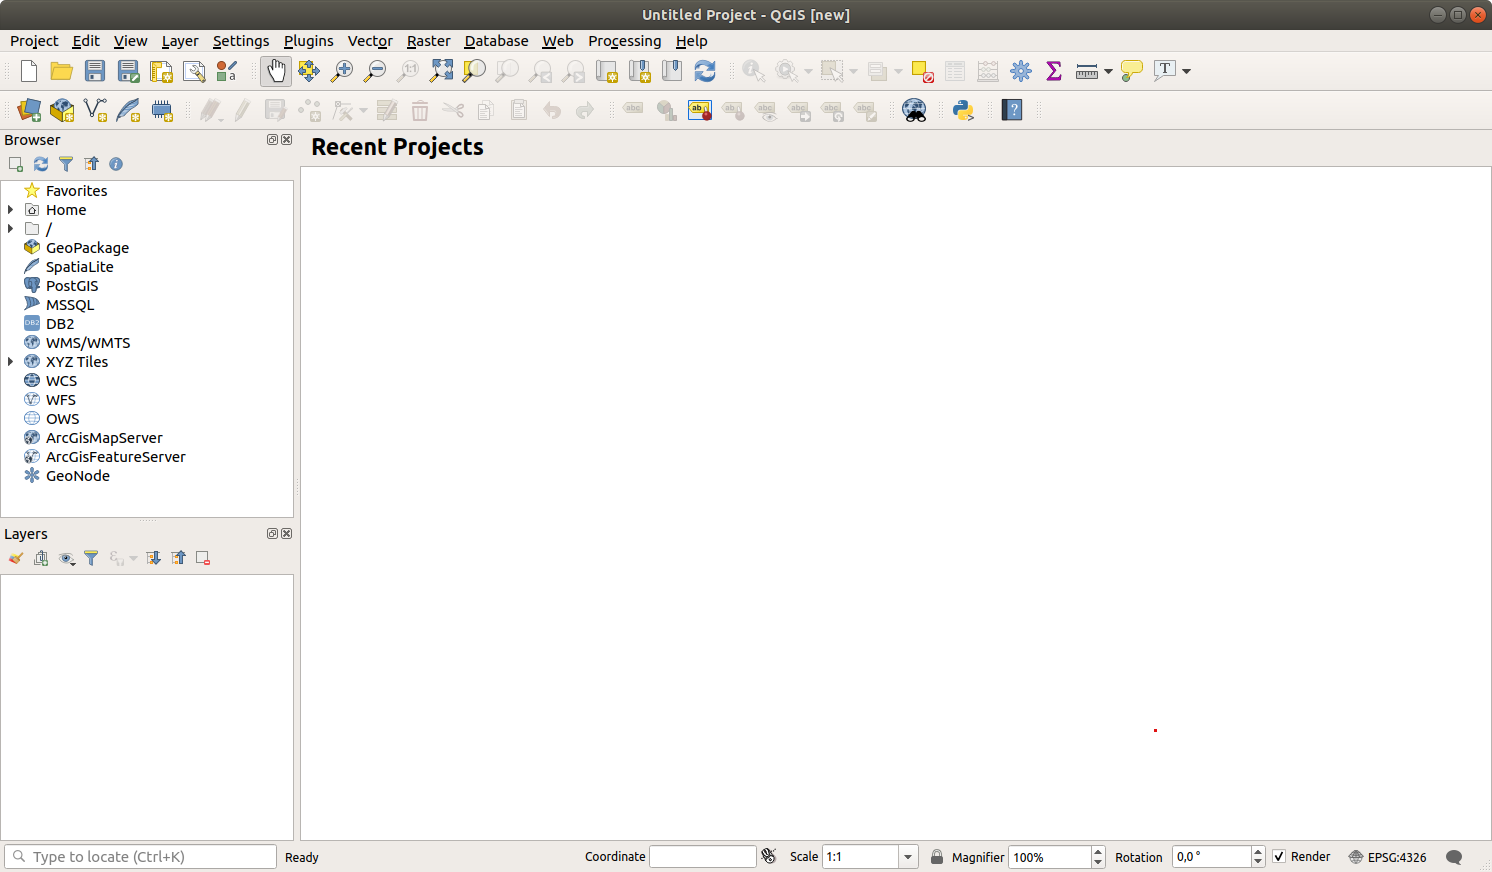
Deschideți QGIS. Veți avea o hartă nouă, albă.
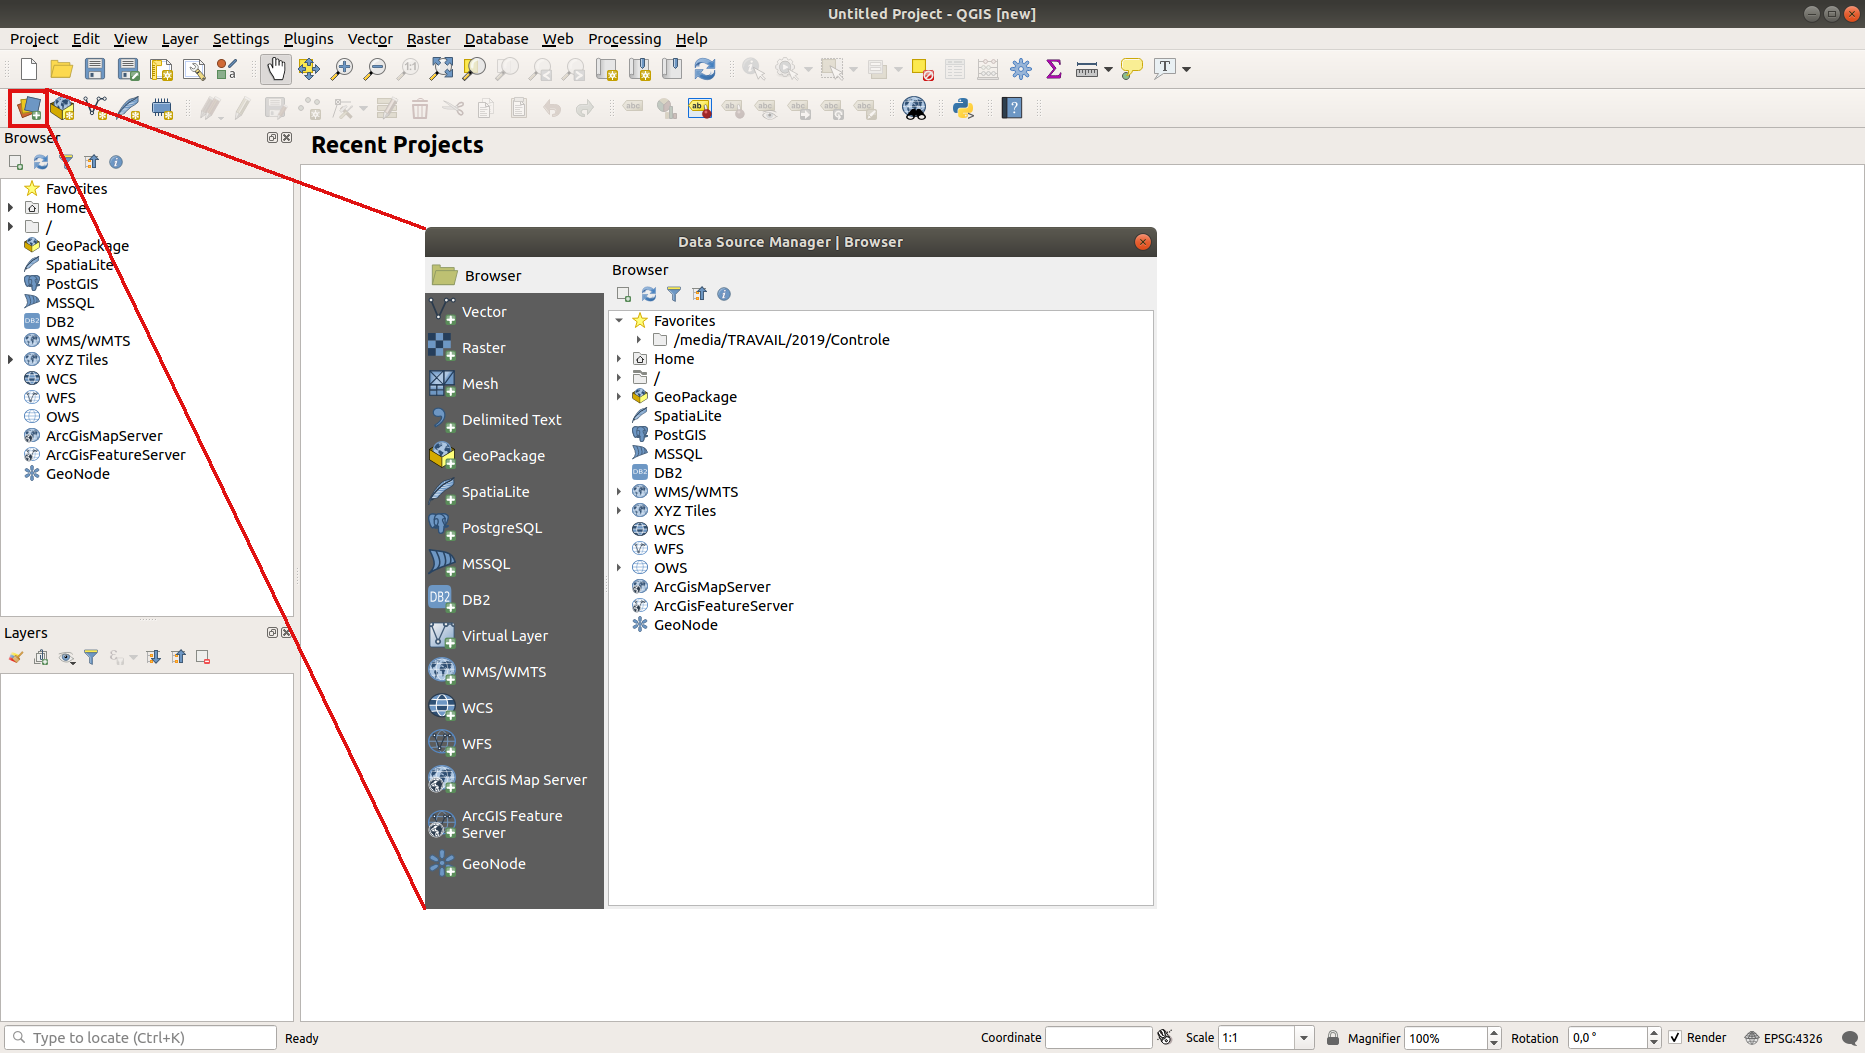
The Data Source Manager dialog allows you to choose the data to load depending on the data type. We’ll use it to load our dataset: click the
 Open Data Source Manager button.
If you can’t find the icon, check that the Data Source Manager toolbar is enabled in the menu.
Load the
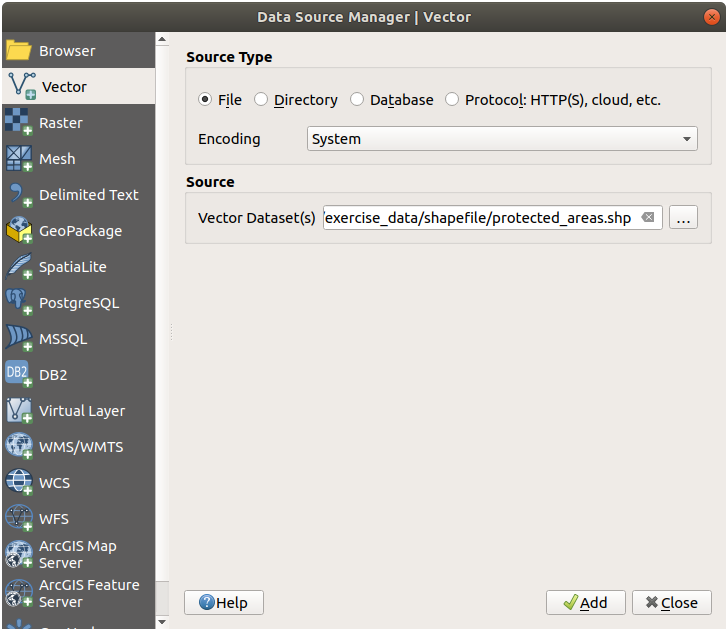
protected_areas.shpvector dataset:Click on the Vector tab.
Enable the
 File source type.
Press the … button next to Vector Dataset(s).
Select the
exercise_data/shapefile/protected_areas.shpfile in your training directory.Click Open. You will see the original dialog, with the file path filled in.
Click Add here as well. The data you specified will now load: you can see a
protected_areasitem in the Layers panel (bottom left) with its features shown in the main map canvas.
Felicitări! Aveți o hartă de bază. Acum ar fi un moment bun pentru a vă salva munca.
Clic pe butonul Save As:

Save the map under a
solutionfolder next toexercise_dataand call itbasic_map.qgz.
2.2.2. Try Yourself
Repeat the steps above to add the places.shp and rivers.shp
layers from the same folder (exercise_data/shapefile) to the map.
2.2.3. Follow Along: Loading vector data from a GeoPackage Database
Databases allow you to store a large volume of associated data in one file. You may already be familiar with a database management system (DBMS) such as Libreoffice Base or MS Access. GIS applications can also make use of databases. GIS-specific DBMSes (such as PostGIS) have extra functions, because they need to handle spatial data.
The GeoPackage open format is a container that
allows you to store GIS data (layers) in a single file.
Unlike the ESRI Shapefile format (e.g. the protected_areas.shp dataset
you loaded earlier), a single GeoPackage file can contain various data (both
vector and raster data) in different coordinate reference systems, as well as
tables without spatial information; all these features allow you to share data
easily and avoid file duplication.
In order to load a layer from a GeoPackage, you will first need to create the connection to it:
Click on the
Open Data Source Manager button.On the left click on the
 GeoPackage tab.
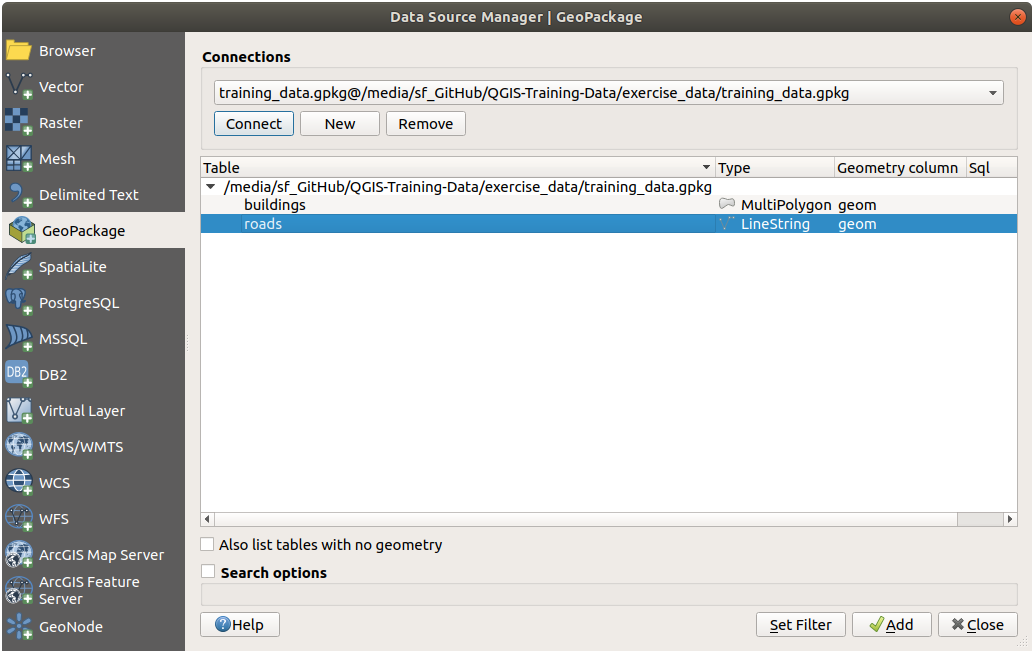
Click on the New button and browse to the
training_data.gpkgfile in theexercise_datafolder you downloaded before.Select the file and press Open. The file path is now added to the Geopackage connections list, and appears in the drop-down menu.
You are now ready to add any layer from this GeoPackage to QGIS.
Click on the Connect button. In the central part of the window you should now see the list of all the layers contained in the GeoPackage file.
Select the roads layer and click on the Add button.
A roads layer is added to the Layers panel with features displayed on the map canvas.
Click on Close.
Congratulations! You have loaded the first layer from a GeoPackage.
2.2.4. Follow Along: Loading vector data from a SpatiaLite Database with the Browser
QGIS provides access to many other database formats. Like GeoPackage, the SpatiaLite database format is an extension of the SQLite library. And adding a layer from a SpatiaLite provider follows the same rules as described above: Create the connection –> Enable it –> Add the layer(s).
While this is one way to add SpatiaLite data to your map, let’s explore another powerful way to add data: the Browser.
Click the
icon to open the Data Source Manager
window.Click on the
 Browser tab.
In this tab you can see all the storage disks connected to your computer as well as entries for most of the tabs in the left. These allow quick access to connected databases or folders.
For example, click on the drop-down icon next to the
 GeoPackage entry. You’ll see the
 training-data.gpkgfile we previously connected to (and its layers, if expanded).Right-click the
 SpatiaLite entry and select
New Connection….
SpatiaLite entry and select
New Connection….Navigate to the
exercise_datafolder, select thelanduse.sqlitefile and click Open.Notice that a
 landuse.sqlite entry has
been added under the SpatiaLite one.
landuse.sqlite entry has
been added under the SpatiaLite one.Expand the
landuse.sqlite entry.Double-click the
 landuse layer or select and
drag-and-drop it onto the map canvas. A new layer is added to the
Layers panel and its features are displayed on the map canvas.
landuse layer or select and
drag-and-drop it onto the map canvas. A new layer is added to the
Layers panel and its features are displayed on the map canvas.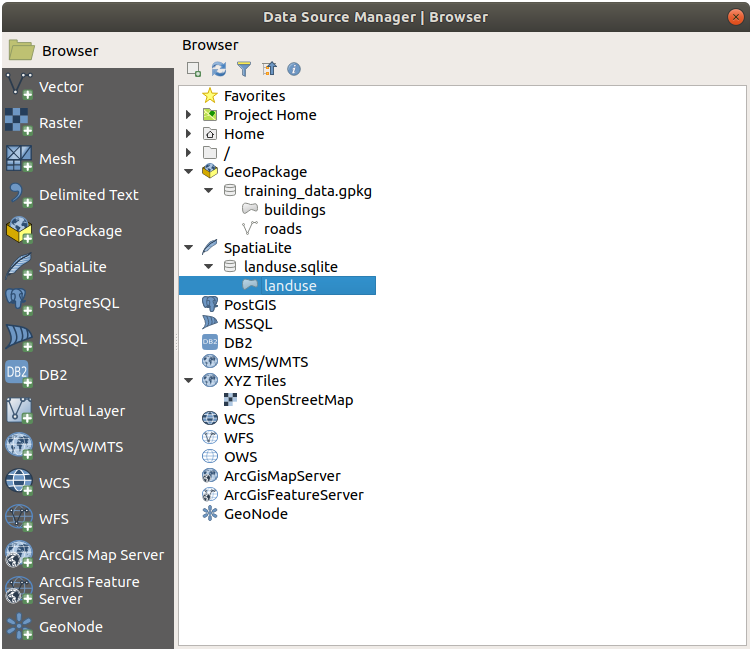
Sfat
Enable the Browser panel in and use it to add your data. It’s a handy shortcut for the tab, with the same functionality.
Notă
Remember to save your project frequently! The project file doesn’t contain any of the data itself, but it remembers which layers you loaded into your map.
2.2.5.  Try Yourself Load More Vector Data
Load the following datasets from the exercise_data folder into your map
using any of the methods explained above:
buildings
water
2.2.6. Follow Along: Reordonarea Straturilor
Straturile din lista de straturi sunt desenate pe hartă într-o anumită ordine. Stratul cel mai jos în listă este desenat primul, iar stratul de la vârful listei este desenat ultimul. Schimbând ordinea în care sunt prezentate în listă puteți schimba ordinea în care sunt desenate.
Notă
You can alter this behavior using the Control rendering order checkbox beneath the Layer Order panel. We will however not discuss this feature yet.
Ordinea în care straturile au fost încărcate în hartă probabil că nu este logică în acest moment. Este posibil ca stratul de străzi să fie complet ascuns deoarece alte straturi sunt deasupra lui.
De exemplu, această ordine a straturilor…
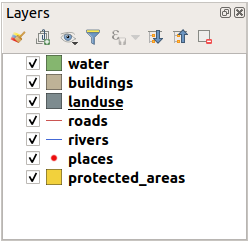
… would result in roads and places being hidden as they run underneath the polygons of the landuse layer.
Pentru a rezolva această problemă:
Clic apoi glisați pe un strat din Lista straturilor.
Reordonați-le, pentru a arăta în felul următor:
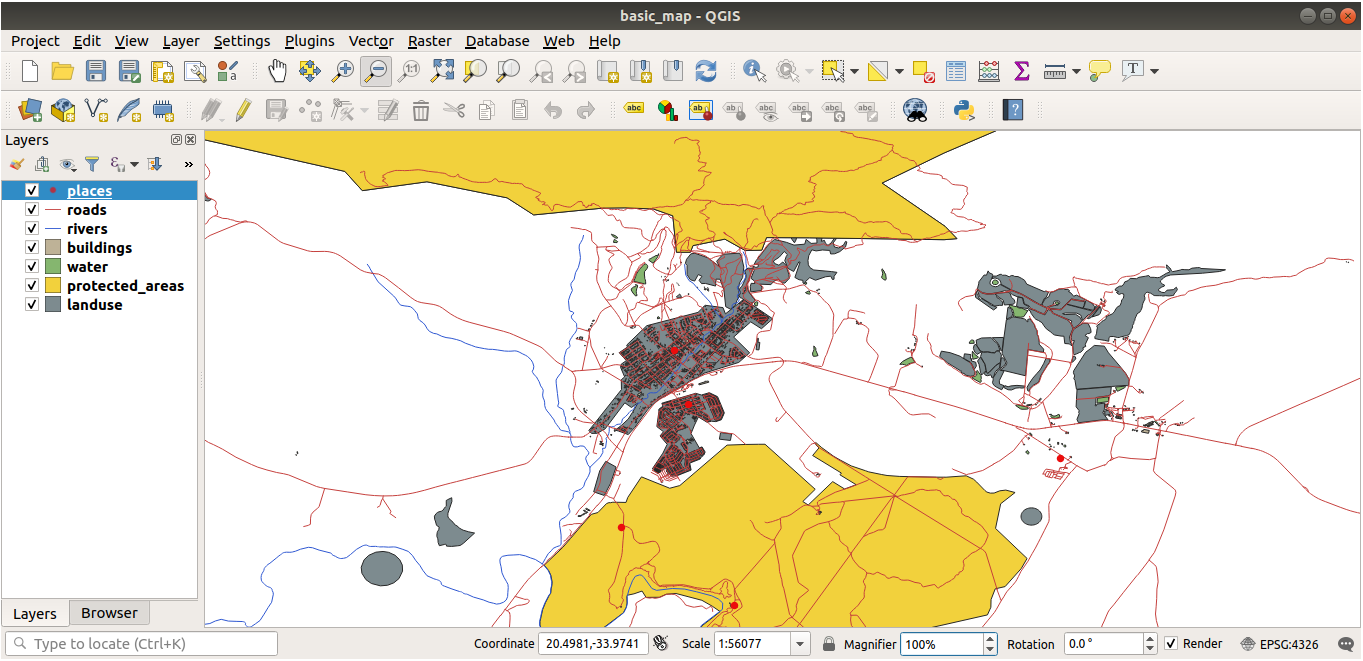
Veți vedea că harta are mai mult sens, cu străzile și clădirile desenate deasupra regiunilor.
2.2.7. In Conclusion
Now you’ve added all the layers you need from several different sources and created a basic map!
2.2.8. What’s Next?
Now you’re familiar with the basic function of the Open Data Source Manager button, but what about all the others? How does this interface work? Before we go on, let’s take a look at some basic interaction with the QGIS interface. This is the topic of the next lesson.