重要
翻訳は あなたが参加できる コミュニティの取り組みです。このページは現在 100.00% 翻訳されています。
17.22. 補間
注釈
この章では、ポイントデータの補間方法について示し、空間分析の実際の実行例を示します。
このレッスンでは、ポイントデータを補間してラスタレイヤを得ます。それをする前に、若干のデータを準備する必要があります。また補間した後では、結果レイヤを修正する追加処理をいくつか加えるので、完全な分析ルーチンになるでしょう。
このレッスンの例となるデータを開くと、このように見えます。
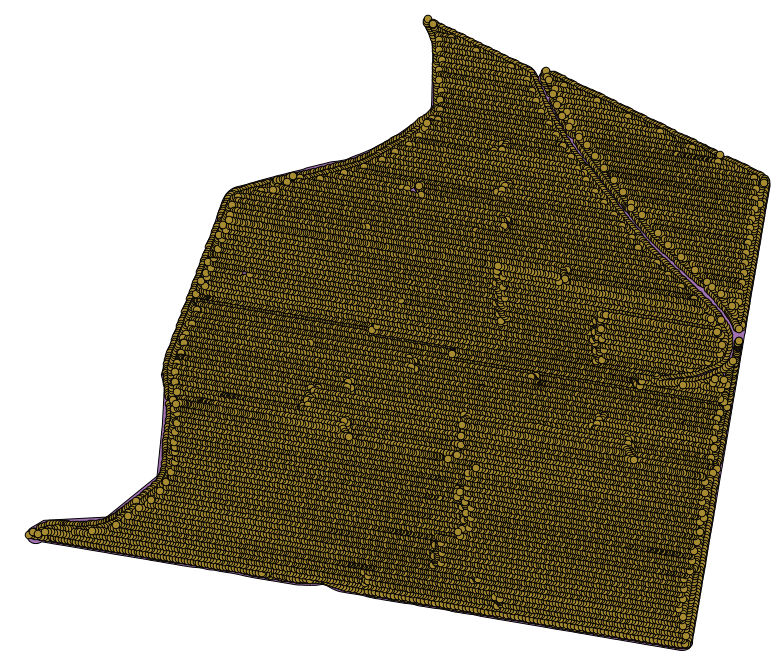
データは、最新の収穫機によって作られるような収穫量データに対応します。そして、ここではそれを収穫量のラスタレイヤを得るために使います。そのレイヤでさらに何か分析する計画はなく、最も生産的な地域、そして生産性が改善できる地域を簡単に特定するための背景レイヤとしてのみ使用します。
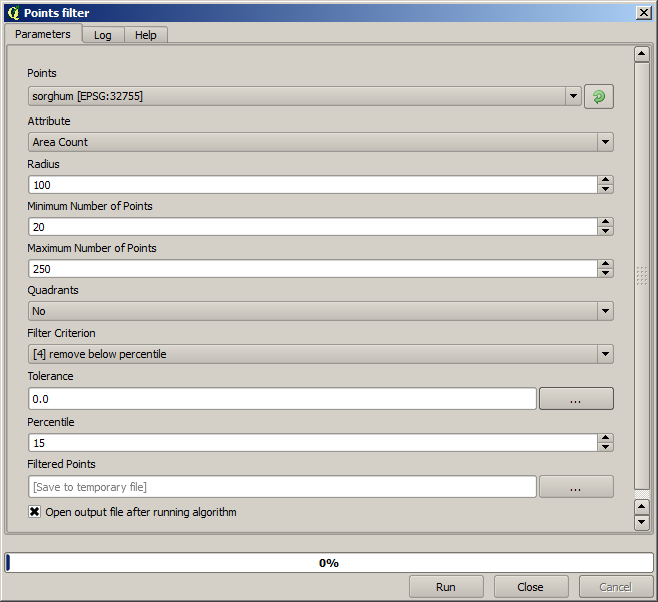
最初にすることはレイヤをクリーンアップすることです。なぜならそれには冗長なポイントが含まれているためです。これらは収穫機が何かの理由で転回したり速度を変えなければならない場所でした動きに起因します。 Points Filter アルゴリズムは、これに役立ちます。それを二回使って分布の上位または下位の部分の両方で外れ値とみなされるポイントを除外します。
最初の実行には、次のパラメーター値を使います。
次の実行には、以下に示す設定を使用します。
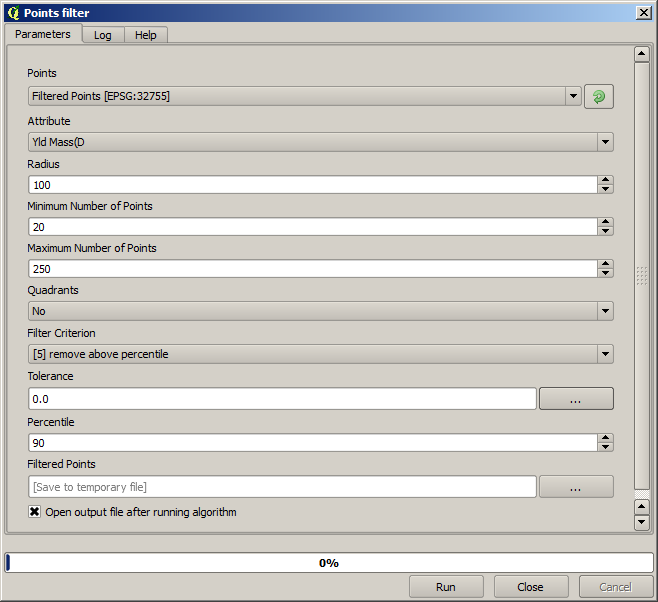
入力としてオリジナルレイヤーを使用しているのではなく、以前に実行した際の出力を使用している点に注意してください。
ポイントの減らされた集合を持った最終的なフィルタレイヤーは、オリジナルのものに似て見えるでしょうが、含んでいるポイントの数はより少なくなっています。それは属性テーブルで比較すると確認できます。
では ラスタライズ アルゴリズムを使用してレイヤをラスタ化しましょう。
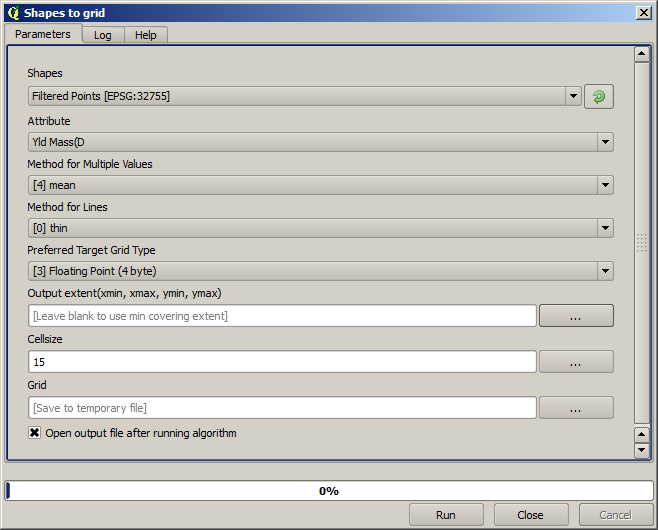
Filtered points レイヤーは、二番目のフィルタの成果のレイヤーを参照します。アルゴリズムが名前を割り当てるため、最初のフィルタによって作成されたレイヤーと同じ名前ですが、最初のものは使用しないでください。最初のものは他に使わないので、混乱を避けるためにプロジェクトから取り除き、最後にフィルタ処理したレイヤーだけ残してもよいです。
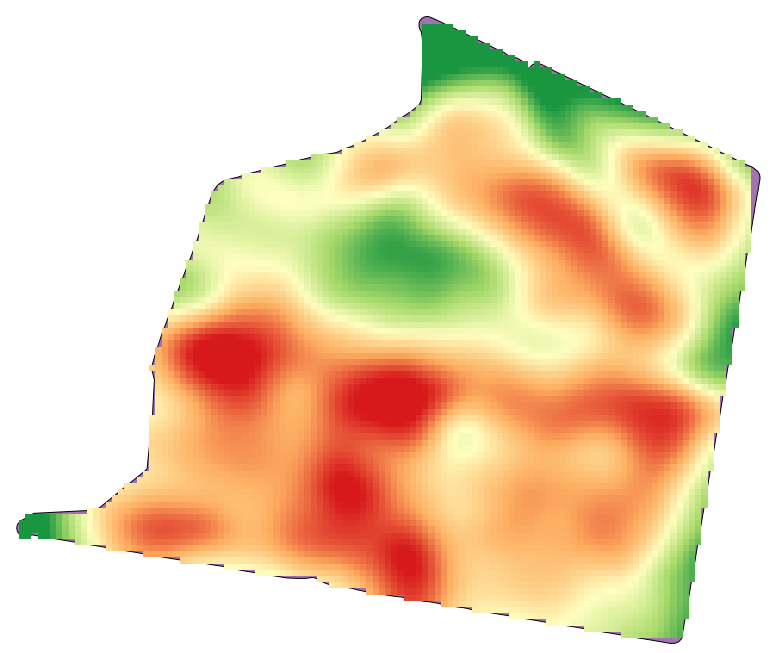
成果ラスタレイヤはこのように見えます。
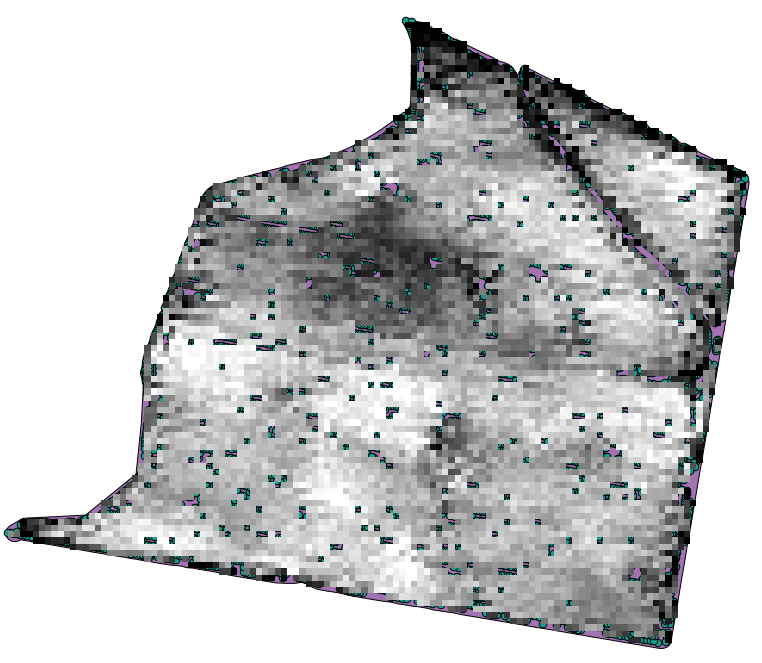
それはもうラスタレイヤですが、一部のセルのデータが欠落しています。ラスタ化したベクタレイヤのポイントを含んでいたセルは有効な値を含んでいますが、それ以外のセルは no--data 値を含んでいます。この欠落値を埋めるため、 Close gaps アルゴリズムを使用できます。
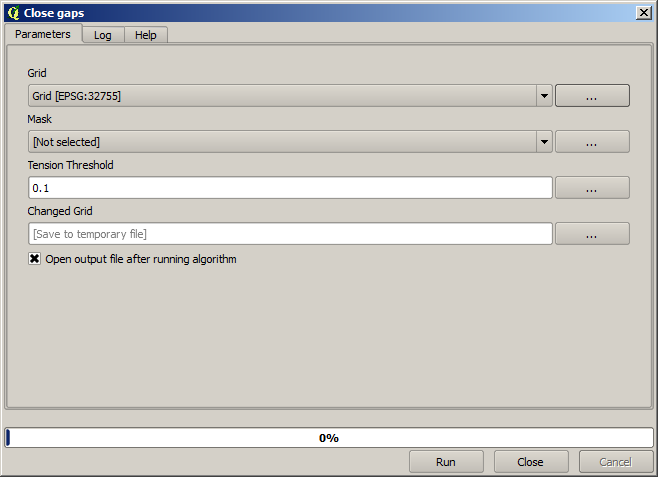
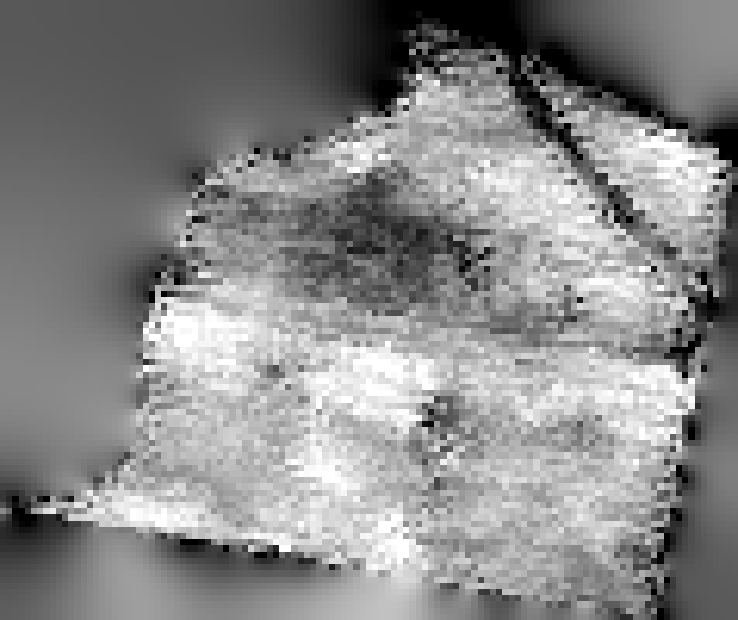
no--data 値のないレイヤはこのように見えます。
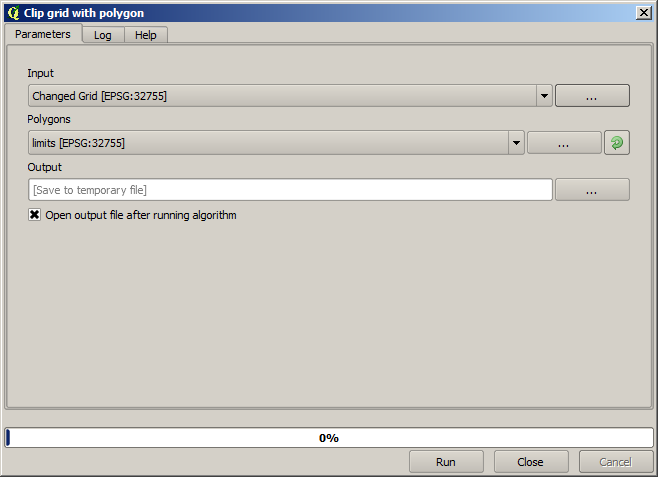
データによって含まれる地域を収穫量が計測された地域に限るため、提供された制限レイヤを使ってラスタレイヤを切り抜くことができます。
そして滑らかな結果(正確度は低いがサポートレイヤとして背景にレンダリングされるには良い)を得るため、レイヤに Gaussian Filter を適用します。
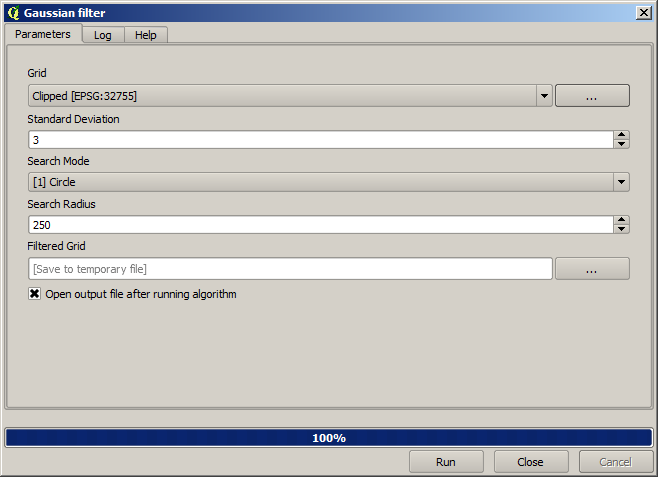
上記のパラメーターで、次の結果が得られます。