Importante
A tradução é um esforço comunitário você pode contribuir. Esta página está atualmente traduzida em 47.83%.
6.1. Lesson: Reprojecting and Transforming Data
Let us talk about Coordinate Reference Systems (CRSs) again. We have touched on this briefly before, but haven’t discussed what it means practically.
El objetivo de esta lección: Reproyectar y transformar conjuntos de datos vectoriales.
6.1.1. ★☆☆ Follow Along: Projections
The CRS that all the data, as well as the map itself are in right now is called WGS84. This is a very common Geographic Coordinate System (GCS) for representing data. But there’s a problem, as we will see.
Salve seu mapa atual
Then open the map of the world which you will find under
exercise_data/world/world.qgsZoom in to South Africa by using the
 Zoom In tool
Try setting a scale in the Scale field, which is in the Statusbar along the bottom of the screen. While over South Africa, set this value to
1:5 000 000(one to five million).Percorra o mapa enquanto observa o campo Escala
Notice the scale changing? That’s because you are moving away from the
one point that you zoomed into at 1:5 000 000, which was at the
center of your screen.
All around that point, the scale is different.
Para entender por qué, piensa en el Globo Terráqueo. Tiene lineas discurriendo de Norte a Sur. Estas líneas están alejadas en el ecuador, pero se encuentran en los polos.
In a GCS, you are working on this sphere, but your screen is flat. When you try to represent the sphere on a flat surface, distortion occurs, similar to what would happen if you cut open a tennis ball and tried to flatten it out. What this means on a map is that the longitude lines stay equally far apart from each other, even at the poles (where they are supposed to meet). This means that, as you travel away from the equator on your map, the scale of the objects that you see gets larger and larger. What this means for us, practically, is that there is no constant scale on our map!
Para solucionar esto, utilicemos en su lugar un Sistema de Coordenadas Proyectado (SCP). Un SCP “proyecta” o convierte los datos en una forma que permite a la escala cambiar y corregirse. Además, para mantener la escala constante, deberiamos reproyectar nuestros datos a usar un SCP.
6.1.2. ★☆☆ Follow Along: “On the Fly” Reprojection
Por padrão, o QGIS reprojeta os dados “on the fly”. O que isso significa é que, mesmo que os dados estejam em outro SRC, o QGIS pode projetá-lo como se estivesse em um SRC de sua escolha.
You can change the CRS of the project by clicking on the
 Current projection button in the bottom
right corner of QGIS.
Current projection button in the bottom
right corner of QGIS.
In the dialog that appears, type the word
globalinto the Filter field. A few CRSs should appear in the Predefined Reference Systems field below.Select WGS 84 / NSIDC EASE-Grid 2.0 Global | EPSG:6933 entry by clicking on it, and then click OK.
Observa cómo cambia la forma de Sudáfrica. Todas las proyecciones funcionan cambiando las formas aparentes de los objetos de la Tierra.
Zoom para uma escala de
1:5 000 000novamente, como antes.Desplázate sobre el mapa.
¡Observa cómo la escala permanece igual!
La transformación” al vuelo” también se usa para combinar conjuntos de datos que están en diferentes SRCs.
Add another vector layer to your map which has the data for South Africa only. You will find it as
exercise_data/world/RSA.shp.Load it. A quick way to see its CRS is by hovering the mouse over the layer in the legend. It is
EPSG:3410.¿Qué observas?
The layer is visible even if it has a different CRS from the
continentsone.
6.1.3. ★★☆ Follow Along: Saving a Dataset to Another CRS
Sometimes you need to export an existing dataset with another CRS. As we will see in the next lesson, if you need to make distance calculations on layer, it is always better to have the layer in a projected coordinate system.
Be aware that the ‘on the fly’ reprojection is related to the project and not to single layers. This means that a layer can have a different CRS from the project even if you see it in the correct position.
Você pode exportar facilmente a camada com outro SRC.
Add the
buildingsdataset fromtraining_data.gpkgRight-click on the
buildingslayer in the Layers panelSelecione no menu que aparece. Você verá a caixa de diálogo Salvar Camada Vetorial como….
Click on the Browse button next to the File name field
Navigate to
exercise_data/and specify the name of the new layer asbuildings_reprojected.shp.Change the value of the CRS. Only the recent CRSs used will be shown in the drop-down menu. Click on the
 Select projection button next
to the drop-down menu.
Select projection button next
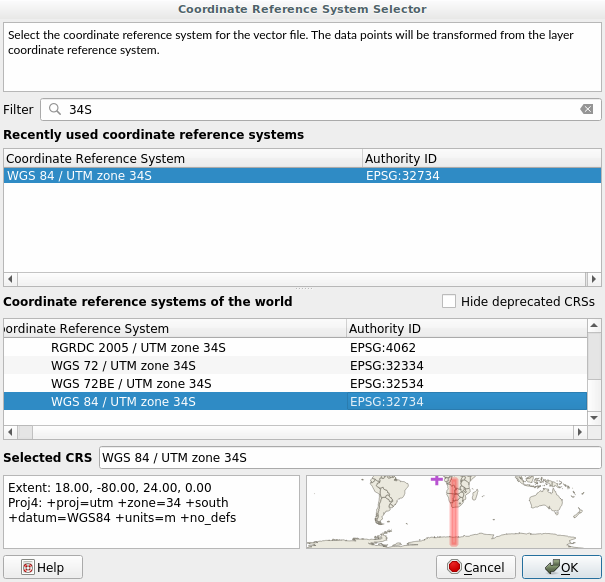
to the drop-down menu.The Coordinate Reference System Selector dialog will appear. In its Filter field, search for
34S.Select WGS 84 / UTM zone 34S | EPSG:32734 from the list
Deixe as outras opções inalteradas. A caixa de diálogo Salvar Camada Vetorial como… agora fica assim:
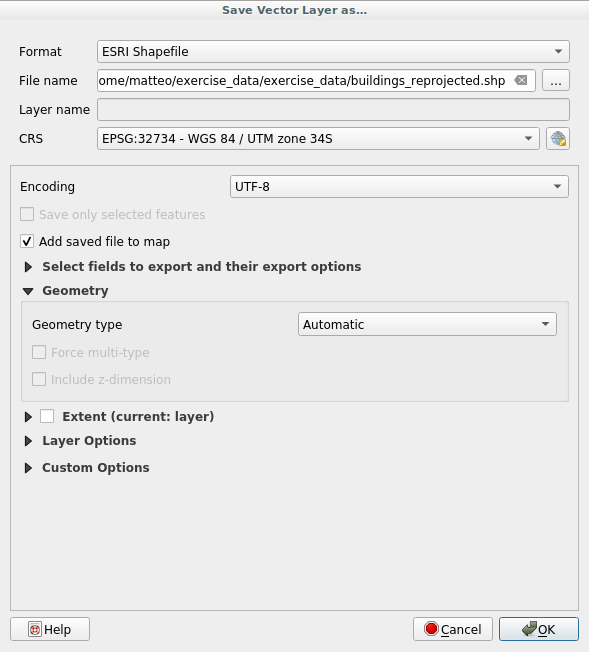
Clique OK.
Agora você pode comparar as projeções antiga e nova da camada e ver que elas estão em dois SRC diferentes, mas ainda estão sobrepostas.
6.1.4. ★★★ Follow Along: Creating Your Own Projection
Hay muchos más proyecciones que las incluidas en QGIS por defecto. Además, también puedes crear tus propias proyecciones.
Inicie um novo mapa
Carregue o conjunto de dados
world/oceans.shpdatasetGo to and you will see this dialog.
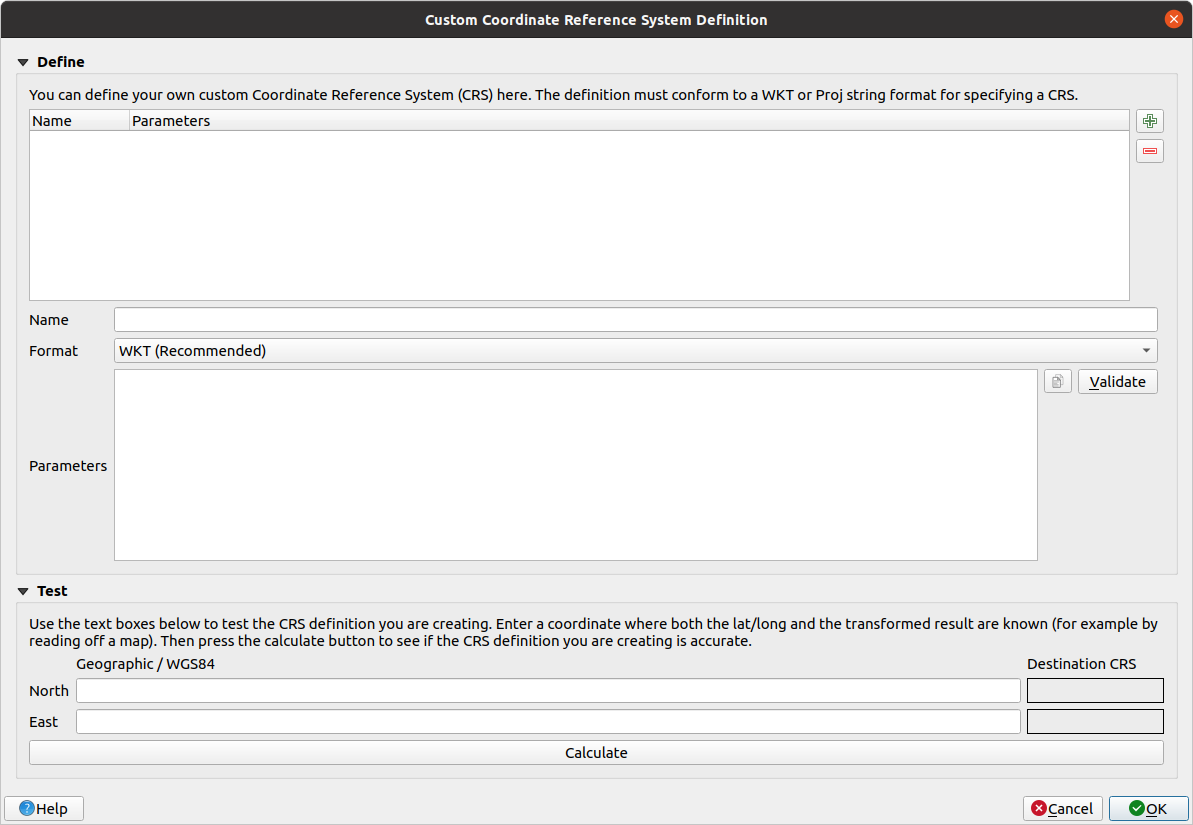
Click on the
 Add new CRS button to create a new
projection
Add new CRS button to create a new
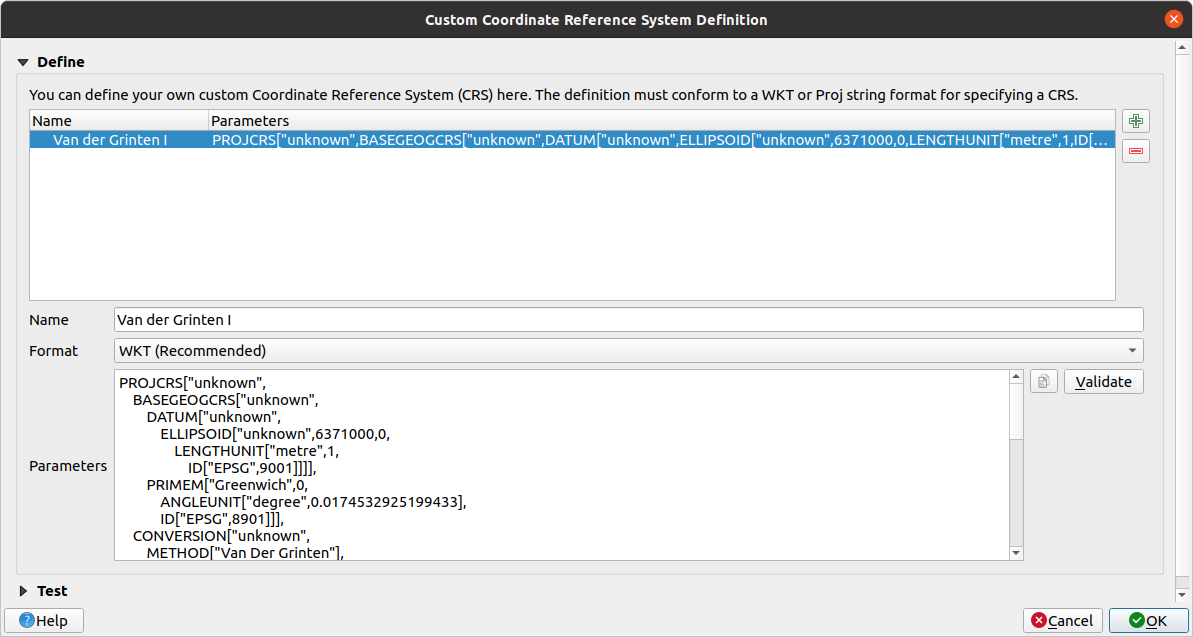
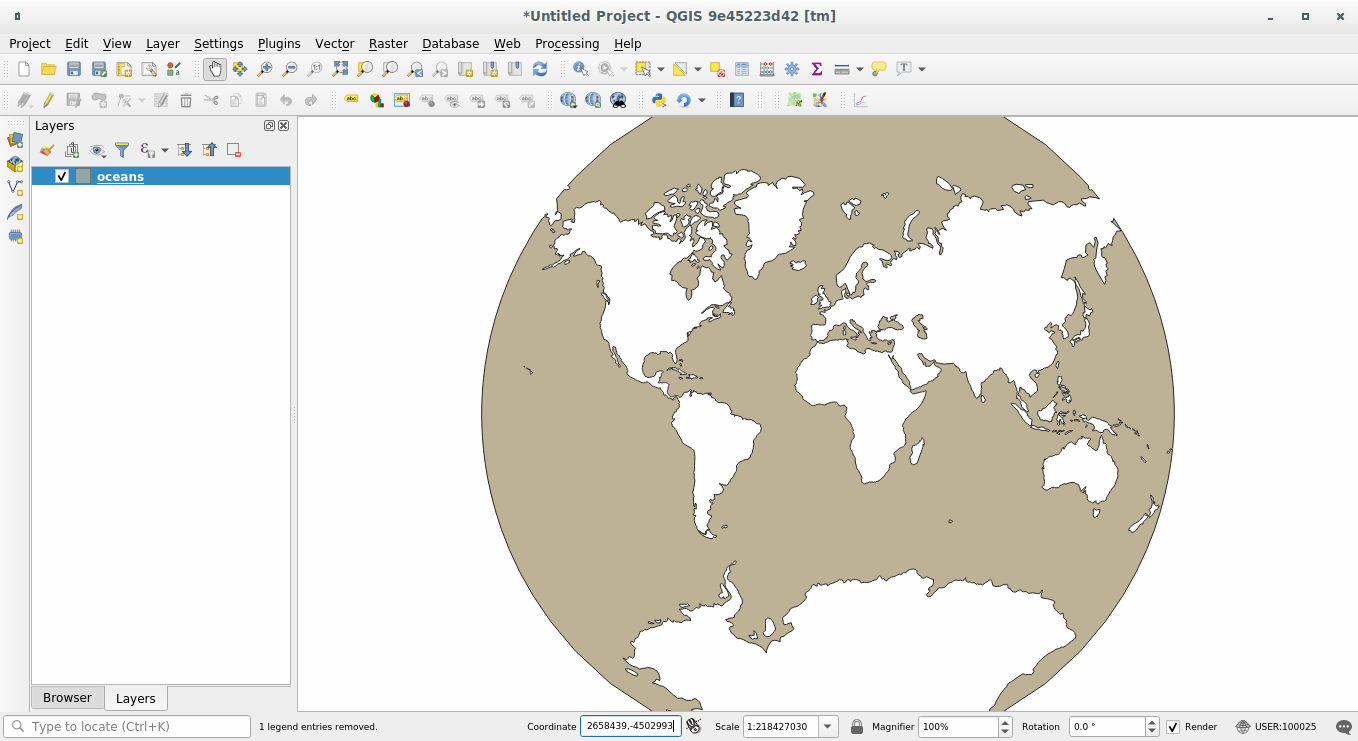
projectionUma projeção interessante a ser usada é chamada ``Van der Grinten I`. Digite seu nome no campo Nome.
Esta proyección representa la Tierra en un campo circular en lugar de una zona rectangular, como la mayoría de proyecciones hacen.
In Format, select WKT (Recommended)
Adicione a seguinte string no campo Parâmetros
PROJCRS["unknown",
    BASEGEOGCRS["unknown",
        DATUM["unknown",
            ELLIPSOID["unknown",6371000,0,
                LENGTHUNIT["metre",1,
                    ID["EPSG",9001]]]],
        PRIMEM["Greenwich",0,
            ANGLEUNIT["degree",0.0174532925199433],
            ID["EPSG",8901]]],
    CONVERSION["unknown",
        METHOD["Van Der Grinten"],
        PARAMETER["Longitude of natural origin",0,
            ANGLEUNIT["degree",0.0174532925199433],
            ID["EPSG",8802]],
        PARAMETER["False easting",0,
            LENGTHUNIT["metre",1],
            ID["EPSG",8806]],
        PARAMETER["False northing",0,
            LENGTHUNIT["metre",1],
            ID["EPSG",8807]]],
    CS[Cartesian,2],
        AXIS["(E)",east,
            ORDER[1],
            LENGTHUNIT["metre",1,
                ID["EPSG",9001]]],
        AXIS["(N)",north,
            ORDER[2],
            LENGTHUNIT["metre",1,
                ID["EPSG",9001]]]]
Clique OK.
Click on the
Current CRS button at the
right of the status bar to change the project CRSEscolha sua projeção recém-definida (pesquise seu nome no campo Filtrar)
Aplicando esta proyección, el mapa será reproyectado así:
6.1.5. In Conclusion
Proyecciones diferentes son útiles para diferentes propósitos. Eligiendo la proyección correcta, puedes asegurarte que los elementos de tu mapa se están representando de forma precisa.
6.1.6. Further Reading
Os materiais para a seção Avançado desta lição foram extraídos deste artigo https://anitagraser.com/2012/03/18/beautiful-global-projections-adding-custom-projections-to-qgis/ .
Read further information on Coordinate Reference Systems.
6.1.7. What’s Next?
In the next lesson you will learn how to analyze vector data using QGIS’ various vector analysis tools.