중요
번역은 여러분이 참여할 수 있는 커뮤니티 활동입니다. 이 페이지는 현재 83.19% 번역되었습니다.
2. GIS 소개
|
목적: |
GIS가 무엇인지 그리고 무엇을 위해 사용할 수 있는지 이해하기 |
키워드: |
GIS, 컴퓨터, 맵, 데이터, 정보 시스템, 공간, 분석 |
2.1. 개요
우리가 컴퓨터 상에서 문서를 작성하고 단어를 처리하기 위해 워드프로세서를 사용하는 것처럼, 컴퓨터 상에서 공간 정보(spatial information) 를 처리하기 위해 GIS 응용 프로그램 을 사용할 수 있습니다. GIS는 ‘지리 정보 시스템(Geographical Information System)’ 의 약자입니다.
GIS는 다음으로 이루어져 있습니다:
Digital Data — the geographical information that you will view and analyse using computer hardware and software.
Computer Hardware — computers used for storing data, displaying graphics and processing data.
Computer Software — computer programs that run on the computer hardware and allow you to work with digital data. A software program that forms part of the GIS is called a GIS Application.
GIS 응용 프로그램을 통해 사용자 컴퓨터 상에서 디지털 맵을 열고, 맵에 추가할 새 공간 정보를 생성하며, 사용자의 필요에 따라 구성된 인쇄 지도를 생성하고, 공간 분석을 수행할 수 있습니다.
GIS를 어떻게 활용할 수 있는지에 대한 간단한 예를 들어보겠습니다. 당신이 공중보건 담당자인데 당신이 치료한 모든 환자들의 치료일자 및 주거지 목록을 만든다고 해봅시다.
경도 |
위도 |
질병 |
날짜 |
|---|---|---|---|
26.870436 |
-31.909519 |
볼거리 |
2008년 12월 13일 |
26.868682 |
-31.909259 |
볼거리 |
2008년 12월 24일 |
26.867707 |
-31.910494 |
볼거리 |
2009년 1월 22일 |
26.854908 |
-31.920759 |
홍역 |
2009년 1월 1일 |
26.855817 |
-31.921929 |
홍역 |
2009년 1월 26일 |
26.852764 |
-31.921929 |
홍역 |
2009년 2월 10일 |
26.854778 |
-31.925112 |
홍역 |
2009년 2월 22일 |
26.869072 |
-31.911988 |
볼거리 |
2009년 2월 2일 |
26.863354 |
-31.916406 |
수두 |
26/02/2009 |
이 표를 보면 1월과 2월에 홍역 발병 사례가 많다는 사실을 쉽게 알 수 있을 겁니다. 공중보건 담당자는 표에 각 환자의 집의 위치를 위도와 경도로 기록했습니다. GIS 응용 프로그램에서 이 데이터를 사용하면 질병의 패턴을 더 쉽게, 더 많이 이해할 수 있습니다:
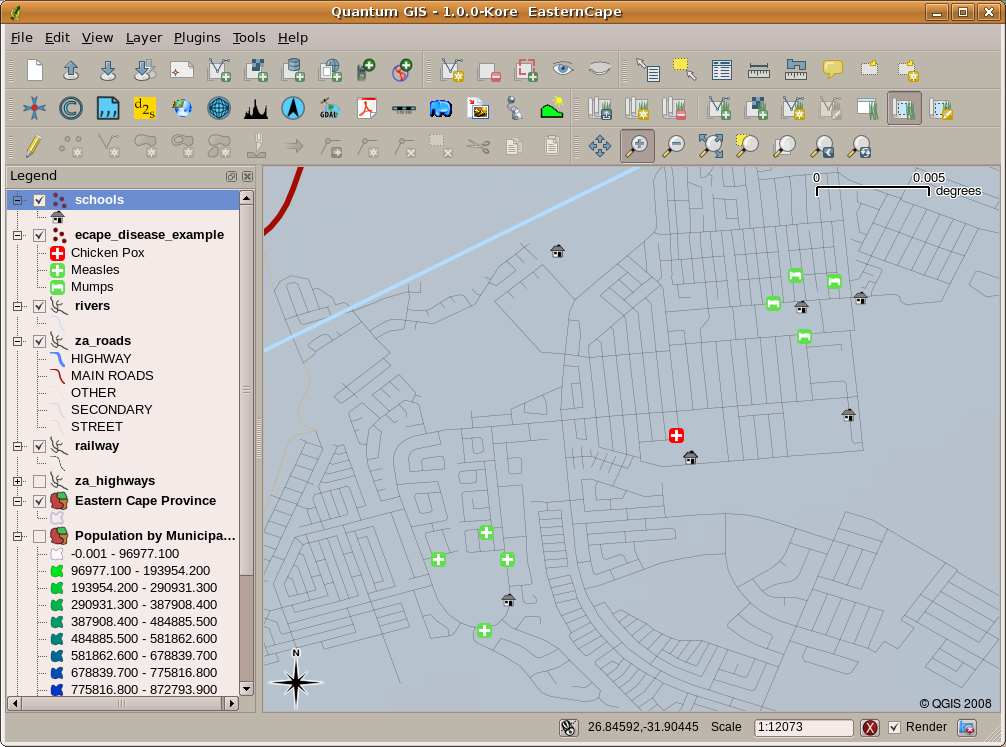
그림 2.11 GIS 응용 프로그램에 나타난 질병 기록의 예. 볼거리 환자들이 모두 가까이 살고 있다는 사실을 쉽게 알 수 있다.
2.2. GIS를 더 자세히
GIS is a relatively new field — it started in the 1970’s. It used to be that computerised GIS was only available to companies and universities that had expensive computer equipment. These days, anyone with a personal computer or laptop can use GIS software. Over time GIS Applications have also become easier to use — it used to require a lot of training to use a GIS Application, but now it is much easier to get started in GIS even for amateurs and casual users. As we described above, GIS is more than just software, it refers to all aspects of managing and using digital geographical data. In the tutorials that follow we will be focusing on GIS Software.
2.3. GIS 소프트웨어/응용 프로그램이란?
You can see an example of what a GIS Application looks like in 그림 2.11. GIS Applications are normally programs with a graphical user interface that can be manipulated using the mouse and keyboard. The application provides menus near to the top of the window (Project, Edit, etc.) which, when clicked using the mouse, show a panel of actions. These actions provide a way for you to tell the GIS Application what you want to do. For example you may use the menus to tell the GIS Application to add a new layer to the display output, as in 그림 2.12.
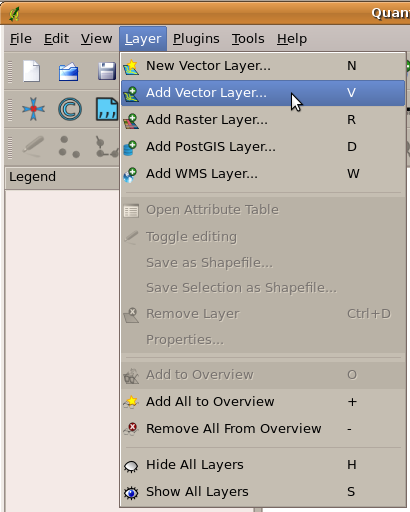
그림 2.12 마우스로 클릭하면 작업을 수행할 수 있는 액션 목록을 표시하도록 펼쳐지는 응용 프로그램 메뉴
As seen in 그림 2.13, toolbars (rows of small pictures that can be clicked with the mouse) normally sit just below the menus and provide a quicker way to use frequently needed actions.
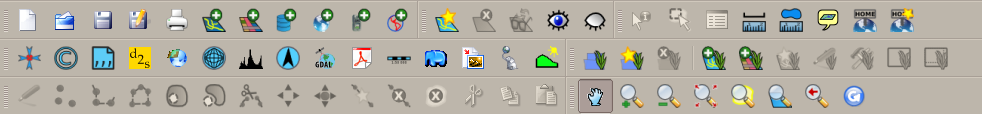
그림 2.13 툴바는 공통적으로 쓰이는 기능들에 빨리 접근할 수 있는 방법입니다. 그림 위에 마우스를 가져가면 보통 해당 그림을 클릭하는 경우 어떤 작업을 수행하는지 알 수 있습니다.
A common function of GIS Applications is to display map layers. Map layers are stored as files on a disk or as records in a database. Normally each map layer will represent something in the real world — a roads layer for example will have data about the street network.
When you open a layer in the GIS Application it will appear in the map view. The map view shows a graphic representing your layer. When you add more than one layer to a map view, the layers are overlaid on top of each other. Look at figures 그림 2.14, 그림 2.15, 그림 2.16 and 그림 2.17 to see a map view that has several layers being added to it.
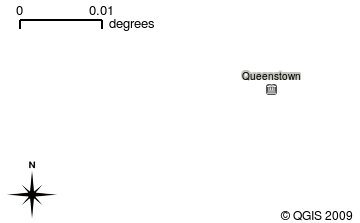
그림 2.14 A towns layer added to the map view
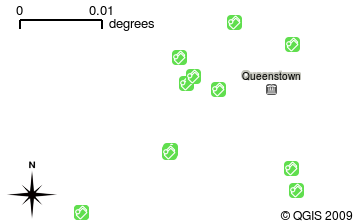
그림 2.15 A schools layer added to the map view
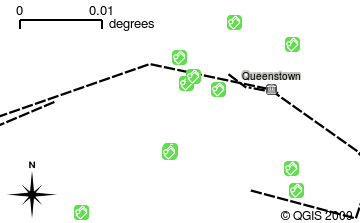
그림 2.16 A railways layer added to the map view
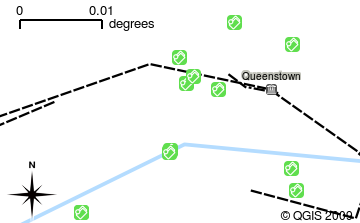
그림 2.17 A rivers layer added to the map view
An important function of the map view is to allow you to zoom in to magnify, zoom out to see a greater area and move around (panning) in the map. GIS software also lets you easily change symbology — the way information is displayed. 그림 2.18 shows the map view after panning to the side and changing the symbology of the layers.
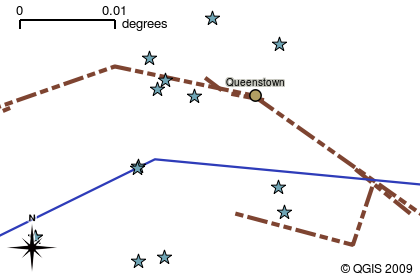
그림 2.18 A map view after moving around (panning) and changing the symbology
Another common feature of GIS Applications is the map legend. The map legend provides a list of layers that have been loaded in the GIS Application. Unlike a paper map legend, the map legend or ‘layers list’ in the GIS Application provides a way to re-order, hide, show and group layers. Changing the layer order is done by clicking on a layer in the legend, holding the mouse button down and then dragging the layer to a new position. In 그림 2.19 and 그림 2.20, the map legend is shown as the area to the left of the GIS Application window. By changing the layer order, the way that layers are drawn can be adjusted — in this case so that rivers are drawn below the roads instead of over them.
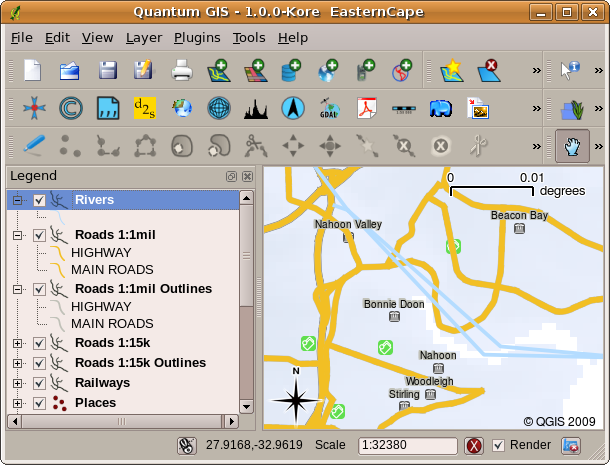
그림 2.19 레이어 순서를 변경하면 레이어가 그려지는 방식을 조정할 수 있습니다. 레이어 순서를 변경하기 전에는, 하천이 도로 위로 흐릅니다.
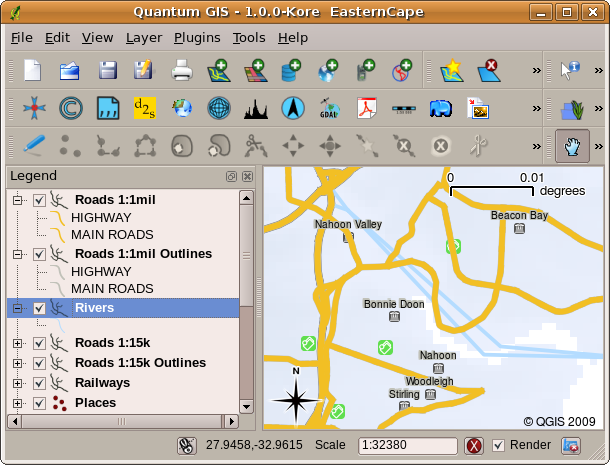
그림 2.20 레이어 순서를 변경하면 레이어가 그려지는 방식을 조정할 수 있습니다. 레이어 순서를 변경한 다음에는, 하천이 도로 아래로 흐릅니다.
2.4. 사용자 컴퓨터(들)에 GIS 응용 프로그램 설치
서로 다른 많은 GIS 응용 프로그램들을 사용할 수 있습니다. 몇몇은 수많은 고급 기능들을 가지고 있으며 한번 설치하는 데 수백 수천만 원이 들기도 합니다. 또는, GIS 응용 프로그램을 무료로 얻을 수도 있습니다. 어떤 GIS 응용 프로그램을 사용할지 결정한다는 것은 비용을 얼마나 감당할 수 있는지 그리고 개인적으로 어떤 쪽을 선호하는지에 대한 문제이기도 합니다. 이 문서의 예제를 위해서는 QGIS 응용 프로그램을 사용할 것입니다. QGIS는 완전 무료이며 사용자가 원하는 만큼 복제해서 친구들과 공유할 수 있습니다. 이 문서를 인쇄된 형태로 받았다면, QGIS 설치 프로그램도 함께 받았어야 합니다. 그렇지 않은 경우, 인터넷에 접속할 수 있다면 언제라도 https://www.qgis.org/ 를 방문해서 무료 설치 프로그램을 다운로드할 수 있습니다.
2.5. GIS 데이터
이제 GIS가 무엇인지 GIS 응용 프로그램으로 어떤 일을 할 수 있는지 알았으니, GIS 데이터 에 대해 말해봅시다. 데이터란 정보 를 달리 말하는 것입니다. GIS에서 사용하는 정보는 일반적으로 지리적 측면의 정보를 뜻합니다. 앞에서 본 공중보건 담당자 예시를 생각해보세요. 그녀는 다음처럼 생긴 표를 만들었습니다:
경도 |
위도 |
질병 |
날짜 |
|---|---|---|---|
26.870436 |
-31.909519 |
볼거리 |
2008년 12월 13일 |
경도와 위도 열은 지리 데이터 를 담고 있습니다. 질병과 날짜 열은 비(非) 지리 데이터 를 담고 있습니다.
A common feature of GIS is that they allow you to associate information (non-geographical data) with places (geographical data). In fact, the GIS Application can store many pieces of information which are associated with each place — something that paper maps are not very good at. For example, our health care worker could store the person’s age and gender on her table. When the GIS Application draws the layer, you can tell it to draw the layer based on gender, or based on disease type, and so on. So, with a GIS Application we have a way to easily change the appearance of the maps we created based on the non-geographical data associated with places.
GIS Systems work with many different types of data. Vector data are stored as
a series of X, Y coordinate pairs inside the computer’s memory. Vector data
are used to represent points, lines and areas. 그림 2.21
shows different types of vector data being viewed in a GIS application. In the
tutorials that follow we will be exploring vector data in more detail.
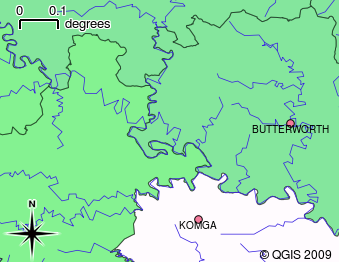
그림 2.21 Vector data are used to represent points (e.g., towns), lines (e.g., rivers) and polygons (e.g., municipal boundaries).
Raster data are stored as a grid of values. There are many satellites circling the earth and the photographs they take are a kind of raster data that can be viewed in a GIS. One important difference between raster and vector data is that if you zoom in too much on a raster image, it will start to appear ‘blocky’ (see 그림 2.22 and 그림 2.23). In fact these blocks are the individual cells of the data grid that makes up the raster image. We will be looking at raster data in greater detail in later tutorials.

그림 2.22 래스터 데이터가 위성 이미지인 경우는 많습니다. 여기에 보이는 건 이스턴케이프의 산들입니다.
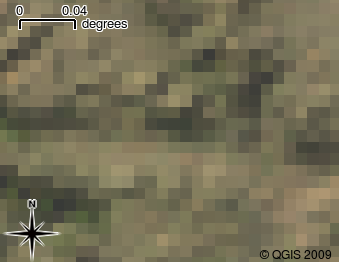
그림 2.23 동일한 래스터 데이터를 확대한 것입니다. 데이터의 그리드 성질을 볼 수 있습니다.
2.6. 무엇을 배웠나요?
이제 이번 단원에서 배운 내용을 정리해볼까요:
GIS 란 컴퓨터 하드웨어, 컴퓨터 소프트웨어와 지리 데이터를 결합한 시스템입니다.
GIS 응용 프로그램 은 GIS의 중요한 부분이며, 이를 통해 지리 데이터를 볼 수 있습니다.
GIS 응용 프로그램은 일반적으로 메뉴 바, 툴바, 맵 뷰 그리고 범례 로 이루어져 있습니다.
벡터 및 래스터 데이터는 GIS 응용 프로그램에서 쓰이는 지리 데이터입니다.
지리 데이터는 비 지리 데이터와 결합될 수 있습니다.
2.7. 도전해봅시다!
강사와 학생들이 함께 시도해볼 만한 몇 가지 아이디어가 있습니다:
지리학: GIS의 개념을 이 단원에서 서술한 개요대로 학생들에게 설명해보십시오. 종이 지도 대신 GIS를 사용하면 편리할 이유를 세 가지 생각해보라고 하십시오. 우리의 모범 답안은 이렇습니다:
GIS 응용 프로그램을 사용하면 동일한 데이터로부터 수많은 서로 다른 유형의 맵을 생성할 수 있습니다.
GIS는 사용자의 데이터에 대한 여러 정보와 그 정보가 공간에서 어떻게 연결되는지 (예: 앞에서 보았던 질병의 확산) 보여줄 수 있는 훌륭한 가시화 도구입니다.
종이 지도는 정보를 채워넣어야 하고, 살펴보는 데 시간이 걸립니다. GIS는 대용량 맵 데이터를 담을 수 있고, 사용자의 관심 위치를 쉽고 빠르게 찾을 수 있습니다.
지리학: 위성이 찍은 래스터 데이터를 어떻게 활용할 수 있을지 떠올릴 수 있습니까? 우리의 모범 답안은 이렇습니다:
자연재해가 일어나는 동안, 재해 지역이 어딘지 구분하는 데 래스터 데이터가 유용할 수 있습니다. 예를 들면 홍수 도중에 찍힌 최신 위성 이미지를 보면 구조해야 할 사람들이 있는 장소를 찾는 데 도움이 될 수 있습니다.
Sometimes people do bad things to the environment, like dumping dangerous chemicals that kill plants and animals. Using raster data from satellites can help us to monitor for these types of problems.
도시계획가는 위성이 찍은 래스터 데이터를 사용, 임시 거주지의 위치를 파악해서 인프라를 계획하는 데 참고할 수 있습니다.
2.8. 생각해볼 점
사용할 수 있는 컴퓨터가 없을 경우, 이번 단원에서 다룬 내용 중 대부분을 OHP(오버헤드 프로젝터)를 사용해서 재현할 수 있습니다. OHP도 정보를 중첩하는 동일한 기술을 사용하기 때문입니다. 하지만 GIS를 제대로 이해하려면 컴퓨터를 사용해서 배우는 편이 항상 낫습니다.
2.9. 더 읽어볼 거리
책: 데스크탑 GIS: 오픈 소스 도구로 지구를 매핑하기(Desktop GIS: Mapping the Planet with Open Source Tools) 저자: 게리 셔먼(Gary Sherman) ISBN: 9781934356067
QGIS 사용자 지침서도 QGIS 사용법에 대한 보다 상세한 정보를 수록하고 있습니다.
2.10. 다음 단원은?
다음 단원에서는 GIS 응용 프로그램 사용법을 알려주며 더 자세히 살펴볼 것입니다. 모든 예제는 QGIS를 통해 이루어질 것입니다. 이제 벡터에 대해 알아볼까요!