重要
翻訳は あなたが参加できる コミュニティの取り組みです。このページは現在 75.00% 翻訳されています。
17.23. 補間(続)
注釈
この章では、補間アルゴリズムが使用される別の実用的な場合を示しています。
補間は一般的な技術であり、QGIS処理フレームワークを使用して適用できるいくつかの技術を実証するために使用できます。このレッスンでは、すでに導入されたいくつかの補間アルゴリズムを使用しますが、別のアプローチです。
このレッスン用のデータもポイントレイヤーを含んでいますが、この場合は標高データです。前のレッスンで行ったのとずっと同じ方法でそれを補間しようとしているが、今回は元のデータの一部を保存しておいて、補間処理の品質を評価するためにそれを使用します。
First, we have to rasterize the points layer and fill the resulting no--data cells, but using just a fraction of the points in the layer. We will save 10% of the points for a later check, so we need to have 90% of the points ready for the interpolation. To do so, we could use the Split shapes layer randomly algorithm, which we have already used in a previous lesson, but there is a better way to do that, without having to create any new intermediate layer. Instead of that, we can just select the points we want to use for the interpolation (the 90% fraction), and then run the algorithm. As we have already seen, the rasterizing algorithm will use only those selected points and ignore the rest. The selection can be done using the Random selection algorithm. Run it with the following parameters.
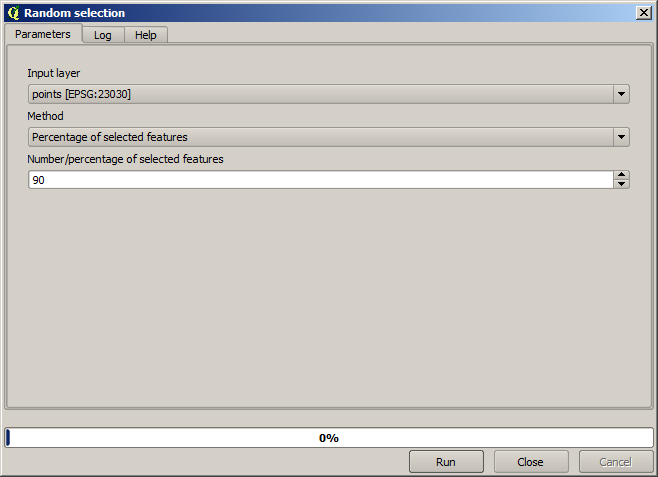
それはラスター化するレイヤー内の点の90%を選択します
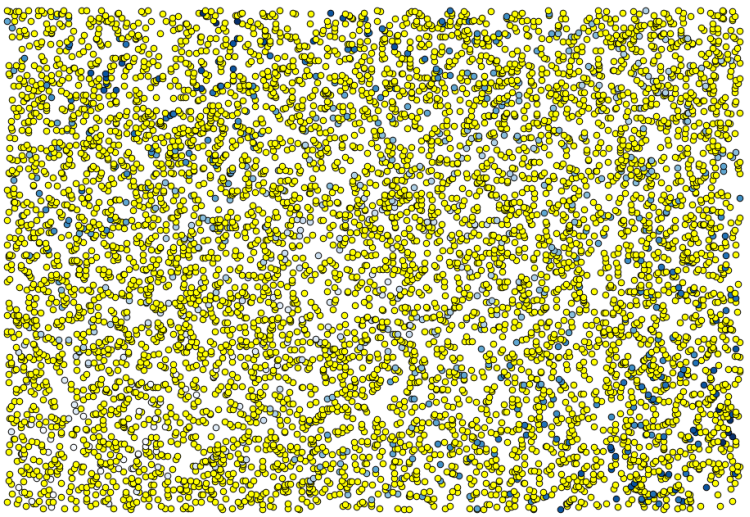
選択はランダムなので、選択が上記の画像に示すような選択とは異なる場合があります。
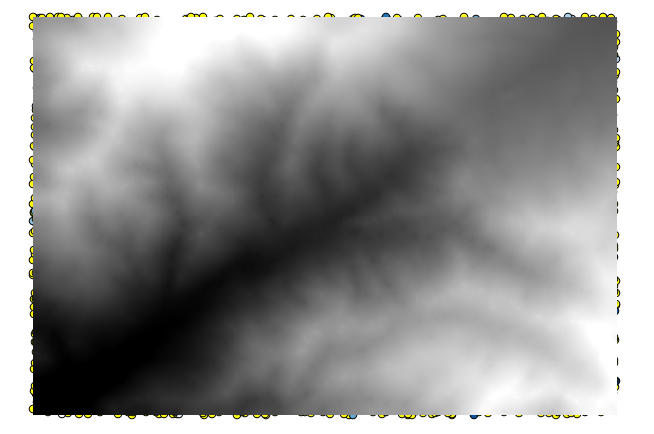
Now run the Rasterize algorithm to get the first raster layer, and then run the Close gaps algorithm to fill the no-data cells [Cell resolution: 100 m].
補間の品質を確認するために、今、選択されていないポイントを使用できます。この時点で、実際の標高(ポイントレイヤーにおける値)と補間標高(補間ラスターレイヤーの値を)知っています。これらの値の差を計算することにより、2つを比較できます
選択されていないポイントを使用しようとしているので、まず、この選択を反転してみましょう。
The points contain the original values, but not the interpolated ones. To add them in a new field, we can use the Add raster values to points algorithm
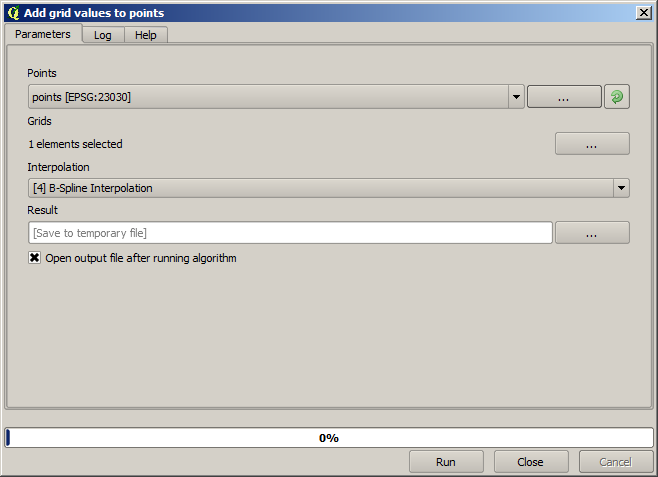
The raster layer to select (the algorithm supports multiple raster, but we just need one) is the resulting one from the interpolation. We have renamed it to interpolate and that layer name is the one that will be used for the name of the field to add.
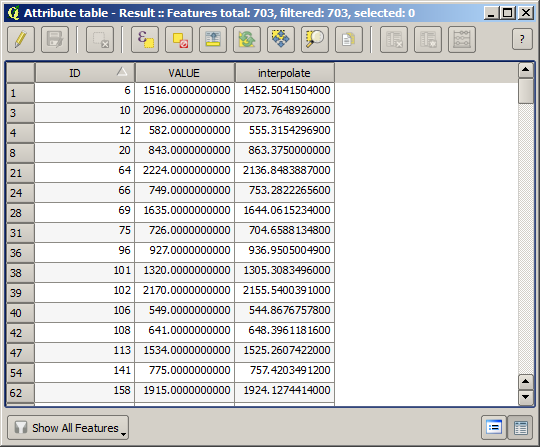
今、補間のために使用されなかったポイントで、両方の値を含むベクターレイヤーを持っています。
Now, we will use the fields calculator for this task. Open the Field calculator algorithm and run it with the following parameters.
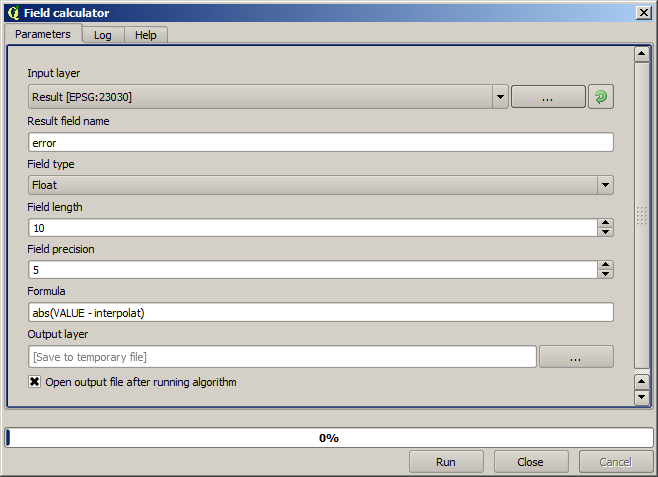
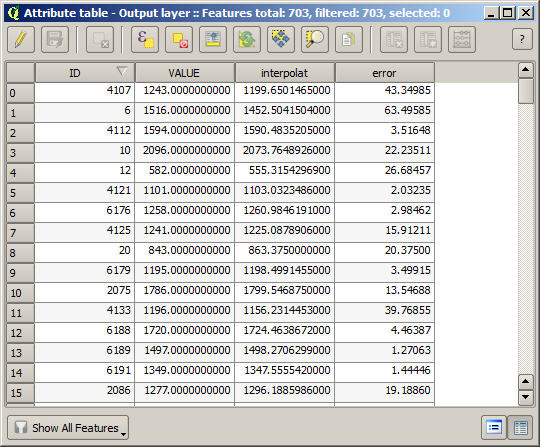
ラスターレイヤーからの値を使用して、フィールドには別の名前を持っている場合は、それに応じて上記の式を変更する必要があります。このアルゴリズムを実行すると、それらのそれぞれが2つの標高値の差を含む、補間のために使用していないだけでポイントを持つ新しいレイヤーが得られるでしょう。
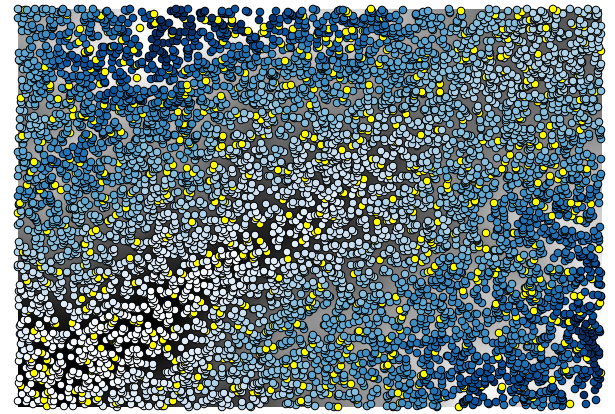
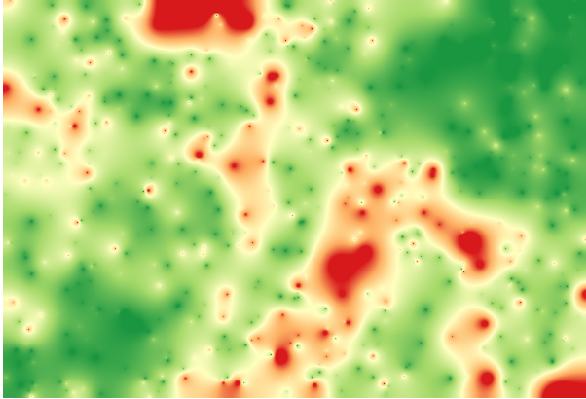
その値に従ってそのレイヤーを表現すると最大の不一致がどこに見つかるかの最初のアイデアが得られるでしょう。
そのレイヤーを補間すると補間された地域のすべての点で推定誤差を持つラスターレイヤーを取得します。
で直接に同じ情報(元の点の値と補間のものとの差)を得ることもできます。
このレッスンの初めでランダムな選択を実行する際に導入されるランダム成分があるので、結果はこれらのものと異なる場合があります。