重要
翻訳は あなたが参加できる コミュニティの取り組みです。このページは現在 95.80% 翻訳されています。
2. GIS入門
|
目的 |
GISとは何か、何ができるのかを理解する。 |
キーワード: |
GIS, コンピュータ, 地図, データ, 情報システム, 空間解析 |
2.1. 概要
ワープロを使用してコンピュータで文章を書いたり扱ったりできるのと同じように、 GIS アプリケーション を使用して 空間情報 を扱うことができます。 GIS とは 地理情報システム (Geographical Information System) のことです。
GIS は以下のものから構成されます。
デジタルデータ --- コンピュータハードウェアとソフトウェアを使って表示や分析する地理情報。
コンピュータハードウェア --- データの保存、グラフィックの表示、データの処理に使われるコンピュータ。
コンピュータソフトウェア --- コンピュータハードウェア上で動作し、デジタルデータの処理を可能にするコンピュータプログラム。GISを構成するソフトウェアプログラムは、GISアプリケーションと呼ばれます。
GISアプリケーションを使うとコンピュータ上のデジタル地図を開いたり, 新しい空間情報データを作成して地図に加えたり、必要に応じてカスタマイズした地図の印刷物を制作したり空間解析が出来ます。
GISがどんなに便利なのかちょっと例を見てみましょう。あなたが医療従事者だとして、患者たちの診療日と自宅の位置を記録しているとします。
経度 |
緯度 |
病気 |
日付 |
|---|---|---|---|
26.870436 |
-31.909519 |
おたふく風邪 |
2008年12月13日 |
26.868682 |
-31.909259 |
おたふく風邪 |
2008年12月24日 |
26.867707 |
-31.910494 |
おたふく風邪 |
2009年01月22日 |
26.854908 |
-31.920759 |
はしか |
2009年01月11日 |
26.855817 |
-31.921929 |
はしか |
2009年01月26日 |
26.852764 |
-31.921929 |
はしか |
2009年02月10日 |
26.854778 |
-31.925112 |
はしか |
2009年02月22日 |
26.869072 |
-31.911988 |
おたふく風邪 |
2009年02月02日 |
26.863354 |
-31.916406 |
水疱瘡 |
2009年02月26日 |
上の表を見ると, 1月と2月には多くのはしかが発症していたことがわかります。医療従事者は、それぞれの患者の家の位置を緯度経度で表に記録していました。このデータを GIS アプリケーションで使えば、病気の規則性についてより多くのことを簡単に理解することができるようになります。
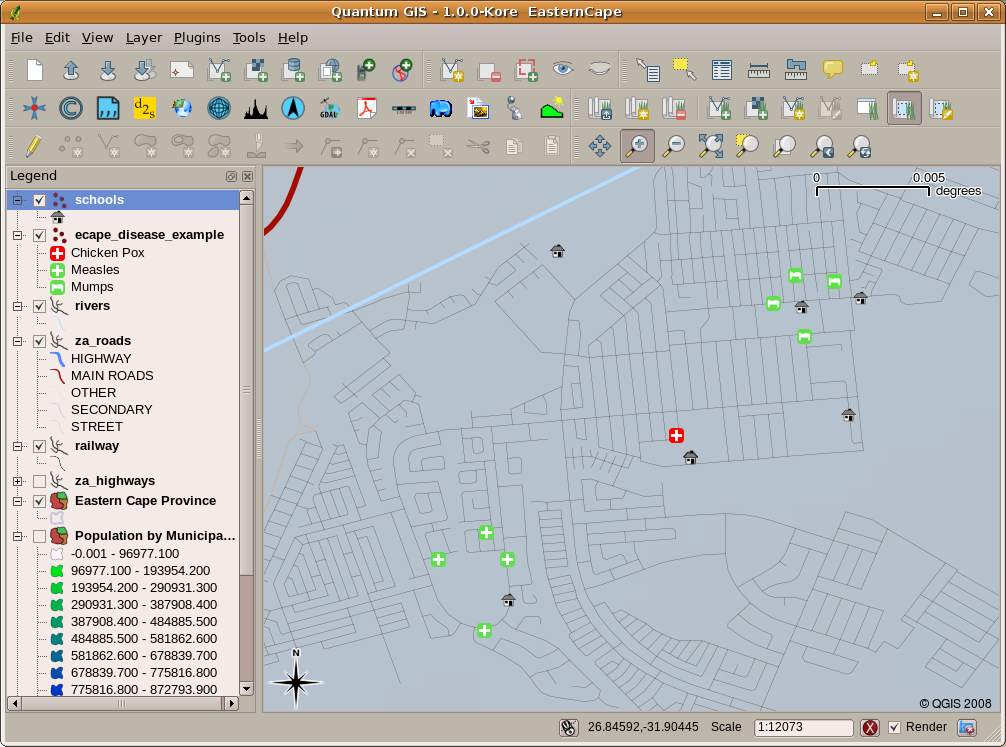
図 2.11 こちらの例では GIS アプリケーションで様々な疾病記録を見せています。おたふく風邪患者同士が近くに居住していることが簡単に見て取れます。
2.2. GISについてより詳しく
GISは、1970年代に始まった比較的新しい分野です。かつては、コンピュータ化されたGISを利用できるのは、高価なコンピュータ機器を所有する企業や大学に限られていました。しかし現在では、パソコンやノートパソコンさえあれば、誰でもGISソフトウェアを利用できるようになっています。また、時間の経過とともにGISアプリケーションも使いやすくなりました。以前はGISアプリケーションを使用するために多くの訓練が必要でしたが、現在ではアマチュアや一般ユーザーであっても、GISを簡単に始められるようになっています。前述したように、GISは単なるソフトウェアにとどまらず、デジタル地理データの管理や利用に関するあらゆる側面を指します。以下のチュートリアルでは、GISソフトウェアに焦点を当てて解説します。
2.3. GIS ソフトウェア / アプリケーションとは何か?
GISアプリケーション がどのようなものかは、図 2.11 の例をご覧ください。GISアプリケーションは通常、マウスやキーボードを使って操作できるグラフィカルユーザーインターフェイスを備えたプログラムです。アプリケーションは、ウィンドウの上部付近に メニュー**(:guilabel:`プロジェクト`、:guilabel:`編集` など)を用意しており、マウスでクリックすると **機能 のパネルが表示されます。これらの機能を使うことで、GISアプリケーションに対して何をしたいかを指示することができます。例えば 図 2.12 に示されているように、メニューを使って、表示出力に新しいレイヤを追加するよう GIS アプリケーションに指示することができます。
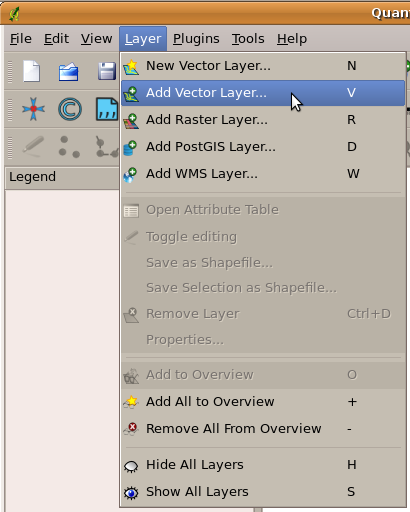
図 2.12 アプリケーションのメニューは、マウスでクリックすると、開いて実行可能な操作の一覧が表示されます。
図 2.13 に示されているように、**ツールバー**(マウスでクリックできる小さなアイコンが並んだ行)は通常、メニューのすぐ下に配置され、頻繁に使用する機能を素早く実行できるようにします。
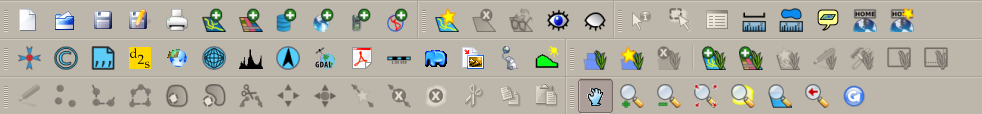
図 2.13 ツールバーでは、よく使う機能にすばやくアクセスできます。アイコンの上にマウスをかざすと、それをクリックしたときに何が起こるかが表示されます。
GISアプリケーションの一般的な機能のひとつは、地図レイヤ を表示することです。地図レイヤはディスク上のファイルやデータベース内のレコードとして保存されます。通常、それぞれの地図レイヤは現実世界の何かを表しています。たとえば、道路レイヤは街路ネットワークについてのデータを持ちます。
GISアプリケーションでレイヤを開くと、それは マップビュー に現れます。マップビューはレイヤを表すグラフィックを表示します。マップビューに複数のレイヤを追加すると、レイヤは互いに重なり合って表示されます。図 2.14、 図 2.15 、 図 2.16 、 図 2.17 を見ると、マップビューに複数のレイヤが追加される様子が分かります。
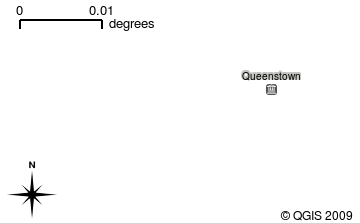
図 2.14 マップビューに追加された街レイヤ
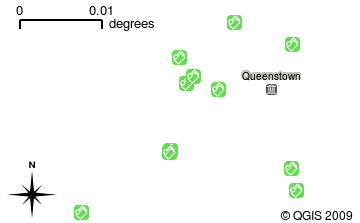
図 2.15 マップビューに追加された学校レイヤ

図 2.16 マップビューに追加された線路レイヤ

図 2.17 マップビューに追加された川レイヤ
マップビューの重要な機能として、ズームインして拡大表示したり、ズームアウトしてより広い範囲を表示したり、地図の中を移動(パン)したりすることが挙げられます。またGISソフトウェアでは、情報の表示方法であるシンボロジを簡単に変更することもできます。図 2.18 は、地図を横方向にパンし、レイヤのシンボロジを変更した後のマップビューを示しています。
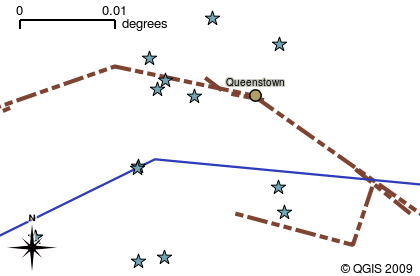
図 2.18 A map view after moving around (panning) and changing the symbology
Another common feature of GIS Applications is the map legend. The map legend provides a list of layers that have been loaded in the GIS Application. Unlike a paper map legend, the map legend or 'layers list' in the GIS Application provides a way to re-order, hide, show and group layers. Changing the layer order is done by clicking on a layer in the legend, holding the mouse button down and then dragging the layer to a new position. In 図 2.19 and 図 2.20, the map legend is shown as the area to the left of the GIS Application window. By changing the layer order, the way that layers are drawn can be adjusted --- in this case so that rivers are drawn below the roads instead of over them.
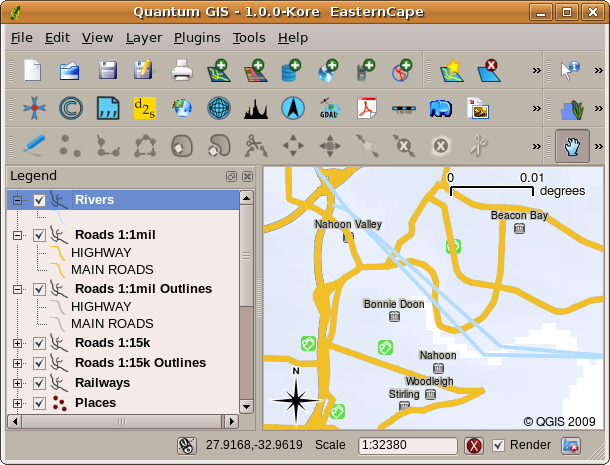
図 2.19 レイヤの順序を変更することで、レイヤの描画方法を調整することができます。レイヤの順序を変更する前は、河川が道路の上に描画されています
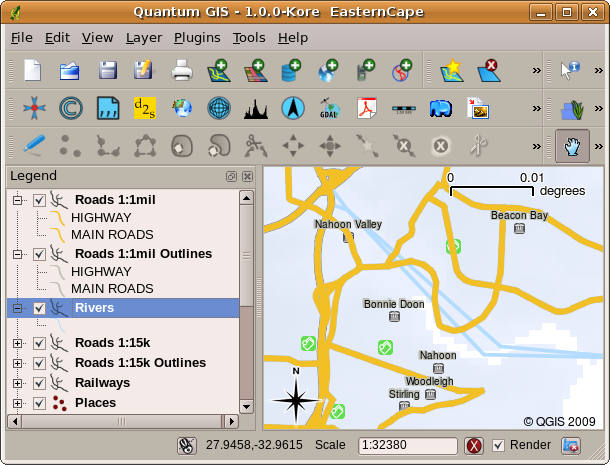
図 2.20 レイヤの順序を変更することで、レイヤの描画方法を調整することができます。レイヤの順序を変更すると、河川が道路の下に描画されています
2.4. GISアプリケーションを入手してみよう
たくさんの違ったGIS アプリケーションが入手できます。洗練された機能を持ち1ライセンス当たり7万円ほどかかるものもあります。一方で、無料で手に入れられるものもあります。どの GISアプリケーションを使うかは、どれだけのお金を出せるか、そして個人の好みの問題です。このチュートリアルでは QGIS アプリケーションを使います。 QGIS は完全にフリーなので、好きなだけ複製したり友人と共有することができます。もしあなたがこのチュートリアルを印刷物として手に入れたなら、QGIS の複製も一緒に手に入れていることでしょう。そうでなくても、インターネットにアクセスすることができれば、いつでもダウンロードページ https://www.qgis.org/ にアクセスして無料で手に入れることができます。
2.5. GISデータ
それではGISとは何か、GISアプリケーションは何ができるのか解ってきたところで GISデータ について説明しましょう。データは 情報 と言い換えることもできます。GISで使う情報は、通常地理的な側面を持っています。前述の医療関係者の例を考えてみましょう。彼女は 症例を記録するために以下のような表を作りました:
経度 |
緯度 |
病気 |
日付 |
|---|---|---|---|
26.870436 |
-31.909519 |
おたふく風邪 |
2008年12月13日 |
経度と緯度の列は 地理的なデータ を持っています。病気と診療日の列は 地理的ではないデータ です。
A common feature of GIS is that they allow you to associate information (non-geographical data) with places (geographical data). In fact, the GIS Application can store many pieces of information which are associated with each place --- something that paper maps are not very good at. For example, our health care worker could store the person's age and gender on her table. When the GIS Application draws the layer, you can tell it to draw the layer based on gender, or based on disease type, and so on. So, with a GIS Application we have a way to easily change the appearance of the maps we created based on the non-geographical data associated with places.
GIS Systems work with many different types of data. Vector data are stored as
a series of X, Y coordinate pairs inside the computer's memory. Vector data
are used to represent points, lines and areas. 図 2.21
shows different types of vector data being viewed in a GIS application. In the
tutorials that follow we will be exploring vector data in more detail.
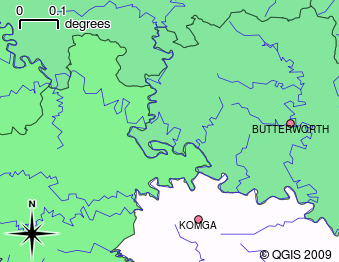
図 2.21 ベクタデータは、点 (例 町) , 線 (例 河川) , 面 (例 行政区) を表すのに使われます
Raster data are stored as a grid of values. There are many satellites circling the earth and the photographs they take are a kind of raster data that can be viewed in a GIS. One important difference between raster and vector data is that if you zoom in too much on a raster image, it will start to appear 'blocky' (see 図 2.22 and 図 2.23). In fact these blocks are the individual cells of the data grid that makes up the raster image. We will be looking at raster data in greater detail in later tutorials.
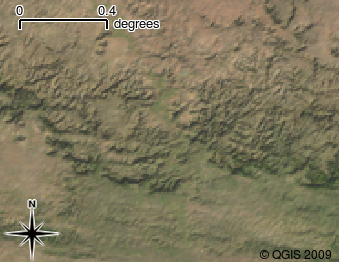
図 2.22 衛星画像のラスタデータ.こちらは東ケープの山岳地帯です.
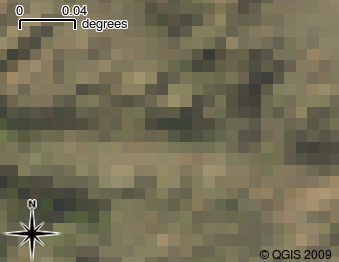
図 2.23 同じラスタデータを拡大したもの。データのグリッドの性質が分かります。
2.6. わかりましたか?
ここでは以下のことを学びました:
GIS とはコンピュータ・ハードウェア, コンピュータ・ソフトウェア, 地理的なデータのシステムです.
GISアプリケーション は地理的なデータを見ることを可能にし, GISの重要な部分を占めます.
GISアプリケーションは通常、 メニューバー 、 ツールバー 、 マップビュー 、 凡例 から構成されます.
GISアプリケーションで使われる地理的なデータには ベクタデータ と ラスタデータ があります。
地理的な データは 地理的ではない データと関連付けることができます。
2.7. やってみよう
ここでは人に教える際のアイデアいくつか述べていきます:
地理学: このチュートリアルで示すように、GISのコンセプトを示す概念です. なぜ紙地図よりGISの方が便利なのか, GISを学習する人たちに3つ理由を考えさせてみて下さい. 以下にはいくつかの例を示します:
GISアプリケーションを用いることで, 同じデータから様々なタイプの地図を作ることができます.
GISはすばらしい可視化ツールで, データそのものやそれらが空間的にどのような関係性を持っているのか(例えば先ほど示した病気の拡大など)を示すことができます.
紙地図はファイルにして保管しなければならず, 見られるまでに時間がかかります. GISは非常に大きな量の地図データから興味のある地域を簡単に素早く探して見ることができます.
地理学: あなたやあなたの生徒たちはどのように衛星データからラスタデータを活用できると思いますか?ここではいくつかアイデアを述べていきます:
災害発生時, 対象地域を見るのにラスタデータは便利で, 最新の洪水発生時の衛星画像をにより人々がどのあたりで救助を必要としているのか見ることができます.
人々は、植物や動物に害を及ぼす危険な化学薬品の廃棄などといった、環境に悪影響をもたらす行為をすることがあります. こういった問題は, 衛星画像のようなラスタデータを使って監視することができます.
都市計画を行う人にとっては衛星画像といったラスタデータを使うことにより, どこに居住区域が存在するのかを把握し, インフラ計画に役立てることができます.
2.8. 考えてみよう
もしコンピュータが利用できない場合でも、このチュートリアルの多くの項目は、OHPとシートを使って、レイヤ情報の重ね合わせを同様におこなうことで再現可能です。ですが、GISについて正しく理解する目的ならば、コンピュータを使って学ぶ方がよいでしょう。
2.9. 参考文献
書籍: Desktop GIS: Mapping the Planet with Open Source Tools.(デスクトップGIS:オープンソースツールで地球を地図化する) 著者: Gary Sherman. ISBN: 9781934356067
QGISユーザーガイドでは, QGISについてより詳細な情報が含まれています.
2.10. 次は?
この後のセクションではもっと詳しくどうやってGISアプリケーションを使うのか掘り下げていきます. すべてのチュートリアルはQGISで行われています. 次はベクタデータを見てみましょう!