` `
Plugin-ul Heatmap
Plugin-ul Heatmap folosește Evaluarea Densității Nucleului pentru a crea un raster al densității (o hartă calorică) dintr-un strat de puncte vectoriale de intrare. Densitatea se calculează pe baza numărului de puncte dintr-o locație, un număr mai mare de puncte într-o aglomerare determinând valori mai mari. Hărțile calorice permit identificarea cu ușurință a “punctelor fierbinți” și a aglomerărilor de puncte.
Activarea plugin-ului Heatmap
First this core plugin needs to be activated using the Plugin Manager (see
Dialogul Plugin-urilor). After activation, the heatmap icon  can be found in the Raster Toolbar, and under the Raster ‣ Heatmap
menu.
can be found in the Raster Toolbar, and under the Raster ‣ Heatmap
menu.
Selectați meniul View ‣ Toolbars ‣ Raster pentru a arăta Bara de Instrumente, dacă aceasta nu este vizibilă.
Folosirea plugin-ului Heatmap
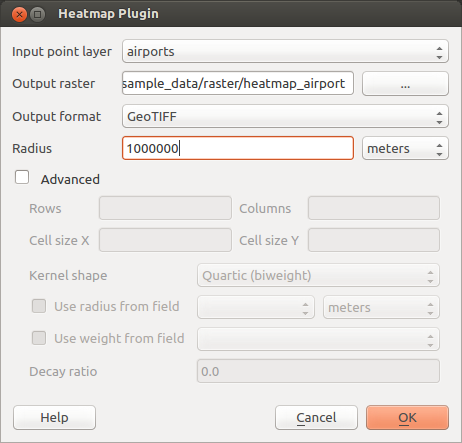
Clicking the Heatmap tool button opens the Heatmap plugin dialog
(see figure_heatmap_settings).
Dialogul are următoarele opțiuni:
Stratul punctelor de intrare: Listează toate straturile vectoriale de tip punct din proiectul curent, fiind utilizat la selectarea stratului care urmează să fie analizat.
Rasterul de ieșire: Permite folosirea butonului
 pentru a selecta directorul și numele de fișier pe care le generează plugin-ul Heatmap pentru imaginea rasterului de ieșire. O extensie de fișier nu este necesară.
- Output format: Selects the output format. Although all formats supported by GDAL can be chosen, in most cases GeoTIFF is the best format to choose.
- Radius: Is used to specify the heatmap search radius (or kernel bandwidth) in meters or map units. The radius specifies the distance around a point at which the influence of the point will be felt. Larger values result in greater smoothing, but smaller values may show finer details and variation in point density.
Atunci când este bifată caseta  Advanced, vor fi disponibile opțiuni adiționale:
- Rows and Columns: Used to change the dimensions of the output raster. These values are also linked to the Cell size X and Cell size Y values. Increasing the number of rows or columns will decrease the cell size and increase the file size of the output file. The values in Rows and Columns are also linked, so doubling the number of rows will automatically double the number of columns and the cell sizes will also be halved. The geographical area of the output raster will remain the same!
- Cell size X and Cell size Y: Control the geographic size of each pixel in the output raster. Changing these values will also change the number of Rows and Columns in the output raster.
- Kernel shape: The kernel shape controls the rate at which the influence of a point decreases as the distance from the point increases. Different kernels decay at different rates, so a triweight kernel gives features greater weight for distances closer to the point then the Epanechnikov kernel does. Consequently, triweight results in “sharper” hotspots, and Epanechnikov results in “smoother” hotspots. A number of standard kernel functions are available in QGIS, which are described and illustrated on Wikipedia.
- Decay ratio: Can be used with Triangular kernels to further control how heat from
a feature decreases with distance from the feature.
O valoare de 0 (=minimum) indică o căldură concentrată în centrul razei date, și complet stinsă la margine.
O valoare de 0.5 indică faptul că pixelii de la marginea razei vor primi jumătate din “căldura” pe care o primesc pixelii aflați în centrul razei de căutare.
O valoare de 1 semnifică distribuirea uniformă a căldurii pe întreaga rază a cercului de căutare. (Acest lucru este echivalent cu kernel-ul ‘Uniform’.)
O valoare mai mare decât 1 indică o căldură mai mare înspre marginea razei de căutare, decât în centru.
Stratul punctelor de intrare poate avea, de asemenea, câmpuri atribut, care pot afecta modul de influențare a hărții calorice:
- Use radius from field: Sets the search radius for each feature from an attribute field in the input layer.
- Use weight from field: Allows input features to be weighted by an attribute field. This can be used to increase the influence certain features have on the resultant heatmap.
Când este specificat ca ieșire un nume de fișier raster, butonul [OK] poate fi utilizat pentru a crea harta calorică.
Tutorial: Crearea unei Hărți Calorice
For the following example, we will use the airports vector point layer from the QGIS sample dataset (see Sample Data). Another excellent QGIS tutorial on making heatmaps can be found at http://www.qgistutorials.com.
In Figure_Heatmap_data, the airports of Alaska are shown.
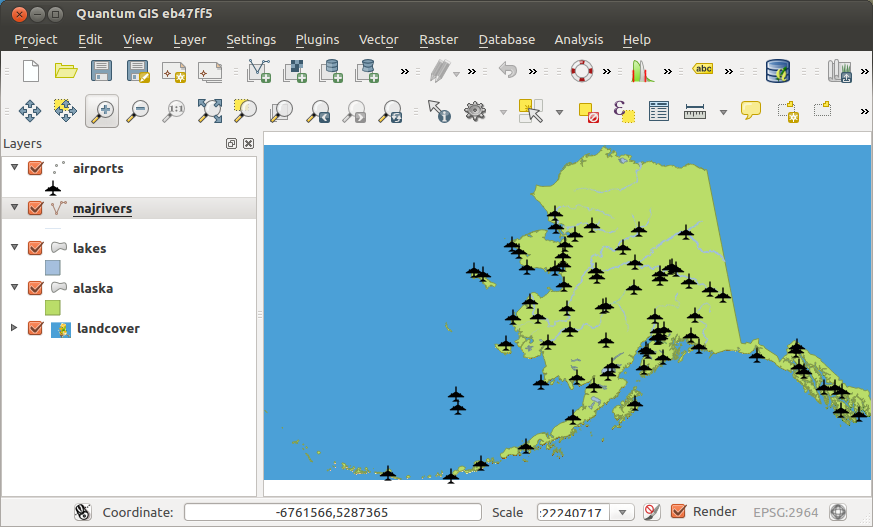
Aeroporturile din Alaska
- Select the Heatmap tool button to open the Heatmap dialog
(see Figure_Heatmap_settings).
- In the Input point layer
 field, select airports
from the list of point layers loaded in the current project.
field, select airports
from the list of point layers loaded in the current project. - Specify an output filename by clicking the button next to the
Output raster field. Enter the filename heatmap_airports (no
file extension is necessary).
Lăsați GeoTIFF ca Format de ieșire implicit.
Schimbați valoarea Razei la 1000000 metri.
- Click on [OK] to create and load the airports heatmap (see Figure_Heatmap_created).
Dialogul Hărții Calorice
QGIS will generate the heatmap and add the results to your map window. By default, the heatmap is shaded in greyscale, with lighter areas showing higher concentrations of airports. The heatmap can now be styled in QGIS to improve its appearance.
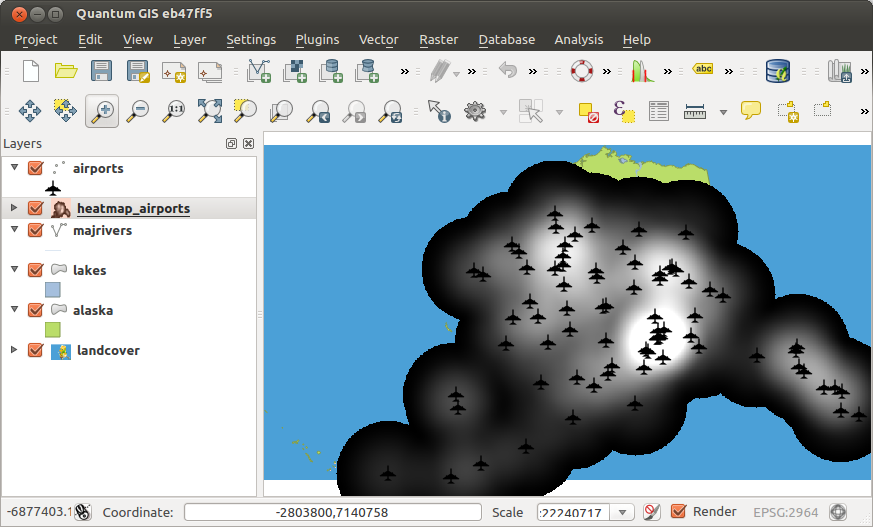
După încărcare, harta calorică arată ca o suprafață gri
- Open the properties dialog of the heatmap_airports layer (select the layer heatmap_airports, open the context menu with the right mouse button and select Properties).
Selectați fila Stil.
Schimbați Tipul randării
pe ‘Singleband pseudocolor’.Selectați o Hartă de culoare
, cum ar fi YlOrRed.Clic p butonul [Load] pentru a obține valorile minime și maxime din raster, apoi faceți clic pe butonul [Classify].
Apăsați [OK] pentru a actualiza stratul.
The final result is shown in Figure_Heatmap_styled.
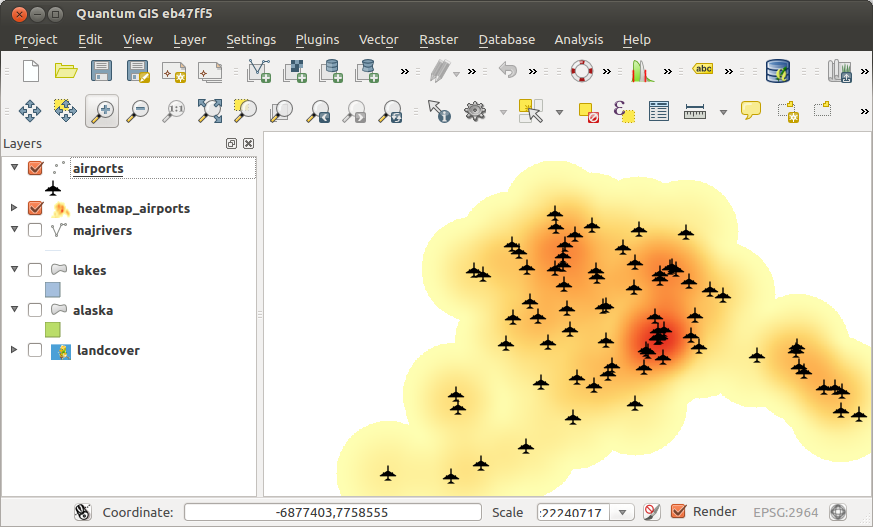
Harta calorică, stilizată, a aeroporturilor din Alaska