` `
The toolbox
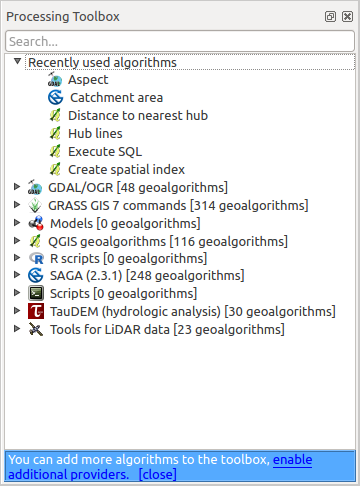
The Toolbox is the main element of the processing GUI, and the one that you are more likely to use in your daily work. It shows the list of all available algorithms grouped in different blocks, and it is the access point to run them, whether as a single process or as a batch process involving several executions of the same algorithm on different sets of inputs.
Boîte à outils de Traitements
The toolbox contains all the available algorithms, divided into so-called “Providers”.
Providers can be (de)activated in the settings dialog. A label in the bottom part of the toolbox will remind you of that whenever there are inactive providers. Use the link in the label to open the settings window and set up providers. We will discuss the settings dialog later in this manual.
By default, only providers that do not rely on third-party applications (that is, those that only require QGIS elements to be run) are active. Algorithms requiring external applications might need additional configuration. Configuring providers is explained in a later chapter in this manual.
In the upper part of the toolbox, you will find a text box. To reduce the number of algorithms shown in the toolbox and make it easier to find the one you need, you can enter any word or phrase on the text box. Notice that, as you type, the number of algorithms in the toolbox is reduced to just those that contain the text you have entered in their names.
If there are algorithms that match your search but belong to a provider that is not active, an additional label will be shown in the lower part of the toolbox.
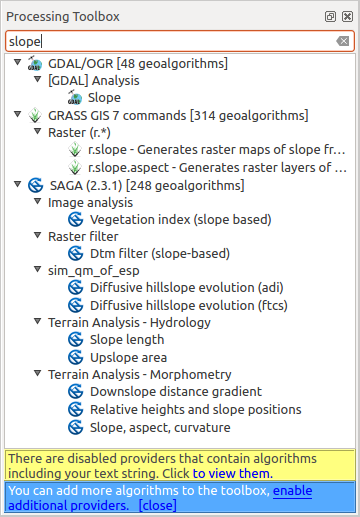
Boîte à outils de traitements affichant les résultats de recherche
If you click on the link in that label, the list of algorithms will also include those from inactive providers, which will be shown in light gray. A link to active each inactive provider is also shown.
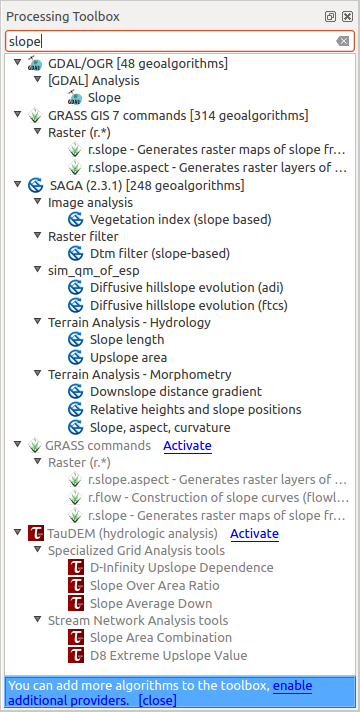
Boîte à outils de traitements affichant les résultats de recherche
To execute an algorithm, just double-click on its name in the toolbox.
La fenêtre Algorithme
Once you double-click on the name of the algorithm that you want to execute, a dialog similar to that in the figure below is shown (in this case, the dialog corresponds to the ‘Polygon centroids’ algorithm).
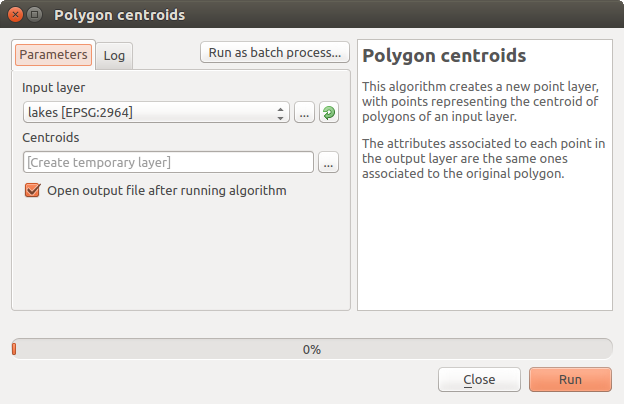
Fenêtre de paramètres
Cette fenêtre permet de définir les données d’entrée à l’algorithme. Elle présente ici la liste des données d’entrée et des paramètres à fournir. Cette fenêtre différera selon les paramètres nécessaires à l’exécution de l’algorithme et sera créée automatiquement.
Les algorithmes différeront par le nombre et le type de paramètres, mais la structure sera la même pour tous. Les paramètres présents dans la table pourront être un des types suivants.
Une couche raster, à sélectionner dans la liste des couches de ce type disponibles (ouvertes) dans QGIS. Le sélecteur contient également un bouton sur sa partie droite, pour choisir un fichier correspondant à une couche non ouverte dans QGIS.
Une couche vectorielle, à sélectionner dans la liste des couches disponibles dans QGIS. Tout comme pour les couches raster, vous pouvez sélectionner une couche par son nom de fichier, mais à la condition que l’algorithme ne nécessite pas un champ de cette couche vectorielle. Dans ce dernier cas, il est nécessaire de charger au préalable la couche vectorielle, afin de pouvoir accéder à la liste des champs.
Vous verrez un bouton pour chaque sélecteur de couche de vecteur, comme le montre la figure ci-dessous.
Bouton d’itération sur les couches vecteur
Si l’algorithme propose plusieurs boutons d’itération, vous ne pourrez en activer qu’un seul. Si un bouton correspondant à une couche vecteur est activé, l’algorithme s’exécutera successivement sur chacune des entités de la couche plutôt que sur la couche en entier, produisant alors autant de sorties que de nombre d’exécution de l’algorithme. Cela permet d’automatiser un traitement qui doit être réalisé sur chaque entité d’une couche séparément.
Une table, à sélectionner dans la liste des tables disponibles dans QGIS. Des tables non spatiales peuvent être chargées dans QGIS comme les couches vectorielles et sont en fait traitées de la même manière. Actuellement, les seules tables utilisables par les algorithmes proviennent de fichiers dBase (.dbf) ou CSV (.csv).
Une option, à choisir dans une liste d’options possibles.
A numerical value, to be introduced in a spin box. You will find a button by its side. Clicking on it, you will open the expression builder that allows you to enter a mathematical expression, so you can use it as a handy calculator. Some useful variables related to data loaded into QGIS can be added to your expression, so you can select a value derived from any of these variables, such as the cell size of a layer or the northernmost coordinate of another one.
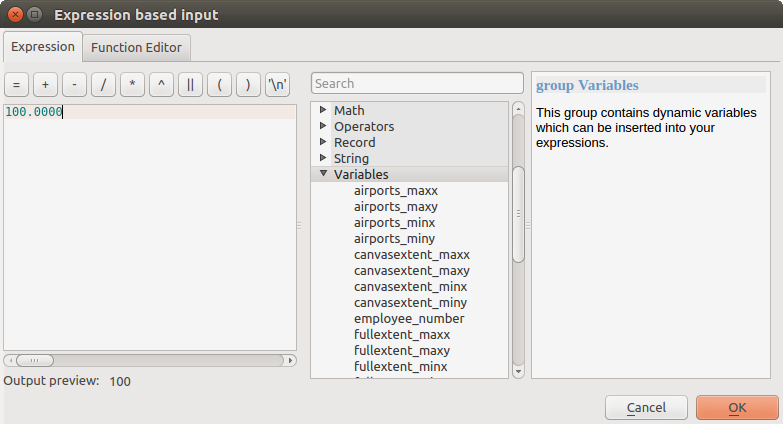
Entrée basée sur une expression
Un intervalle, où doivent être remplies les valeurs minimales et maximales.
Une chaîne de texte, à mettre dans le champ correspondant.
Le nom d’un champ, à choisir dans la liste des attributs d’une couche vectorielle ou d’une table préalablement sélectionnée.
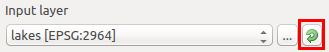
A coordinate reference system. You can type the EPSG code directly in the text box, or select it from the CRS selection dialog that appears when you click on the button on the right-hand side.
An extent, to be entered by four numbers representing its xmin, xmax, ymin, ymax limits. Clicking on the button on the right-hand side of the value selector, a pop-up menu will appear, giving you three options:
- to select the value from a layer or the current canvas extent,
- to define it by dragging directly onto the map canvas, or
- to use the minimum coverage from all input layers.
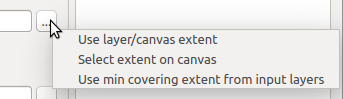
Sélecteur d’emprise
Dans le premier cas s’affichera une fenêtre comme celle-ci.
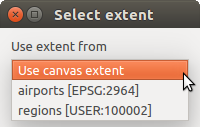
Liste d’emprises
Dans le second cas, la fenêtre de paramètres sera cachée afin de vous permettre de cliquer et glisser sur le canevas. Une fois le rectangle délimité, la fenêtre réapparaîtra, contenant les valeurs de l’emprise choisie.
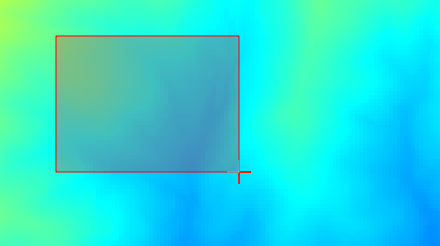
Sélection interactive d’une emprise
A list of elements (whether raster layers, vector layers or tables), to select from the list of such layers available in QGIS. To make the selection, click on the small button on the left side of the corresponding row to see a dialog like the following one.
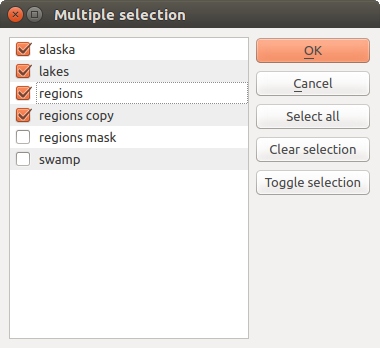
Sélection Multiple
Une petite table, à éditer par l’utilisateur, pour définir certains paramètres tels que tables de recherche ou le produit de convolution.
Cliquez sur le bouton sur le côté droit pour voir la table et éditer ses valeurs.
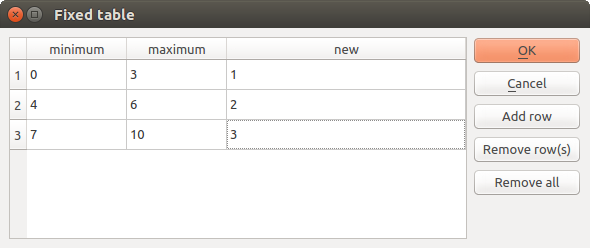
Table fixe
Selon l’algorithme, les lignes sont modifiables ou non, en utilisant les boutons situés à droite de la fenêtre.
En plus de l’onglet des paramètres, vous trouverez un autre onglet nommé Journal. L’information fournie par l’algorithme au cours de son exécution est écrite dans cet onglet et vous permet de suivre l’exécution et d’avoir plus de détails sur le déroulement en cours. Merci de prendre note que tous les algorithmes n’écrivent pas forcément de l’information dans cet onglet et beaucoup d’entre eux peuvent s’exécuter de manière silencieuse sans produire aucune sortie autre que les fichiers finaux.
Sur le côté droit de la boîte de dialogue, vous trouverez une courte description de l’algorithme ce qui vous aidera à comprendre son objectif et ses idées de base. Si une telle description n’est pas disponible, le panneau de description ne sera pas affiché.
Some algorithms might have a more detailed help file, which might include description of every parameter it uses, or examples. In that case, you will find a Help tab in the parameters dialog.
A propos des projections
Algorithms that are run from the processing framework — this is also true for most of the external applications whose algorithms are exposed through it — do not perform any reprojection on input layers and assume that all of them are already in a common coordinate system and ready to be analyzed. Whenever you use more than one layer as input to an algorithm, whether vector or raster, it is up to you to make sure that they are all in the same coordinate system.
Note that, due to QGIS’s on-the-fly reprojecting capabilities, although two layers might seem to overlap and match, that might not be true if their original coordinates are used without reprojecting them onto a common coordinate system. That reprojection should be done manually, and then the resulting files should be used as input to the algorithm. Also, note that the reprojection process can be performed with the algorithms that are available in the processing framework itself.
By default, the parameters dialog will show a description of the CRS of each layer along with its name, making it easy to select layers that share the same CRS to be used as input layers. If you do not want to see this additional information, you can disable this functionality in the Processing settings dialog, unchecking the Show CRS option.
If you try to execute an algorithm using as input two or more layers with unmatching CRSs, a warning dialog will be shown.
Vous pourrez toujours exécuter l’algorithme mais sachez que dans la plupart des cas, ceci générera des résultats erronés, comme des couches vides du fait de couches en entrée qui ne se superposent pas.
Les données générées par les algorithmes
Les données générées par un algorithme peuvent être des types suivants :
Une couche raster
Une couche vectorielle
Une table
Un fichier HTML (utilisé pour les sorties texte et graphiques)
These are all saved to disk, and the parameters table will contain a text box corresponding to each one of these outputs, where you can type the output channel to use for saving it. An output channel contains the information needed to save the resulting object somewhere. In the most usual case, you will save it to a file, but in the case of vector layers, and when they are generated by native algorithms (algorithms not using external applications) you can also save to a PostGIS or Spatialite database, or a memory layer.
Pour sélectionner un chemin de destination, cliquez simplement sur le bouton à la droite de la boîte de texte et vous verrez apparaître un menu contextuel avec les options disponibles.
Dans la majorité des cas, vous voudrez sélectionner l’enregistrement dans un fichier. Si vous sélectionnez cette option, une boîte de dialogue de sélection de fichier sera affichée et vous pourrez y sélectionner le chemin de fichier. Les extensions gérées sont affichées dans le sélecteur de format de fichier, en fonction du type de sortie et l’algorithme.
The format of the output is defined by the filename extension. The supported formats depend on what is supported by the algorithm itself. To select a format, just select the corresponding file extension (or add it, if you are directly typing the file path instead). If the extension of the file path you entered does not match any of the supported formats, a default extension will be appended to the file path, and the file format corresponding to that extension will be used to save the layer or table. Default extensions are .dbf for tables, .tif for raster layers and .shp for vector layers. These can be modified in the setting dialog, selecting any other of the formats supported by QGIS.
If you do not enter any filename in the output text box (or select the corresponding option in the context menu), the result will be saved as a temporary file in the corresponding default file format, and it will be deleted once you exit QGIS (take care with that, in case you save your project and it contains temporary layers).
You can set a default folder for output data objects. Go to the settings dialog (you can open it from the Processing menu), and in the General group, you will find a parameter named Output folder. This output folder is used as the default path in case you type just a filename with no path (i.e., myfile.shp) when executing an algorithm.
Lorsque vous lancez un algorithme qui utilise une couche vectorielle en mode itératif, le chemin de fichier entré est pris comme chemin de base pour tous les fichiers de sortie, dont le nom correspondra au nom du fichier de base suivi du numéro d’index d’itération. L’extension du fichier (et le format) sera la même pour tous les fichiers générés.
Apart from raster layers and tables, algorithms also generate graphics and text as HTML files. These results are shown at the end of the algorithm execution in a new dialog. This dialog will keep the results produced by any algorithm during the current session, and can be shown at any time by selecting Processing ‣ Results viewer from the QGIS main menu.
Certaines applications tierces peuvent créer des fichiers d’un type différent à ceux précédemment exposés. Ces fichiers résultats ne seront pas gérés par QGIS (ouverts ou intégrés dans le projet courant) dans la mesure où le format de fichier n’est pas reconnu par QGIS. C’est par exemple le cas de fichier LAS produits par LiDAR. Ces fichiers sont créés, mais vous ne verrez rien de plus dans la session de travail QGIS.
Pour les autres types de résultat, vous pourrez choisir de les charger ou non à l’issue de l’exécution de l’algorithme en cochant la case. Par défaut, tous les fichiers sont chargés.
Le Module de Traitements ne prend pas en charge de sorties optionnelles. Tous les résultats sont créés. Cependant vous pouvez choisir de désactiver les sorties qui ne vous intéressent pas (ces fichiers seront créés dans des fichiers temporaires qui seront supprimés en quittant QGIS).
Configuring the processing framework
As has been mentioned, the configuration menu gives access to a new dialog where you can configure how algorithms work. Configuration parameters are structured in separate blocks that you can select on the left-hand side of the dialog.
Along with the aforementioned Output folder entry, the General block contains parameters for setting the default rendering style for output layers (that is, layers generated by using algorithms from any of the framework GUI components). Just create the style you want using QGIS, save it to a file, and then enter the path to that file in the settings so the algorithms can use it. Whenever a layer is loaded by Processing and added to the QGIS canvas, it will be rendered with that style.
Rendering styles can be configured individually for each algorithm and each one of its outputs. Just right-click on the name of the algorithm in the toolbox and select Edit rendering styles for outputs. You will see a dialog like the one shown next.
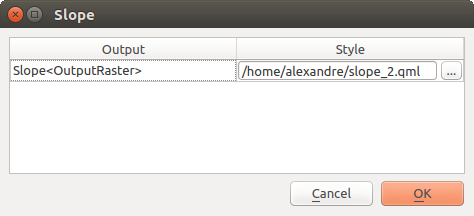
Rendering Styles
Select the style file (.qml) that you want for each output and press [OK].
Other configuration parameters in the General group are listed below:
- Use filename as layer name. The name of each resulting layer created by an algorithm is defined by the algorithm itself. In some cases, a fixed name might be used, meaning that the same output name will be used, no matter which input layer is used. In other cases, the name might depend on the name of the input layer or some of the parameters used to run the algorithm. If this checkbox is checked, the name will be taken from the output filename instead. Notice that, if the output is saved to a temporary file, the filename of this temporary file is usually a long and meaningless one intended to avoid collision with other already existing filenames.
- Keep dialog open after running algorithm. Once an algorithm has finished execution and its output layers are loaded into the QGIS project, the algorithm dialog is closed. If you want to keep it open (to run the algorithm again with different parameters, or to better check the output that is written to the log tab), check this option
- Use only selected features. If this option is selected, whenever a vector layer is used as input for an algorithm, only its selected features will be used. If the layer has no selected features, all features will be used.
- Pre-execution script file and Post-execution script file. These parameters refer to scripts written using the processing scripting functionality, and are explained in the section covering scripting and the console.
Apart from the General block in the settings dialog, you will also find a block for algorithm providers. Each entry in this block contains an Activate item that you can use to make algorithms appear or not in the toolbox. Also, some algorithm providers have their own configuration items, which we will explain later when covering particular algorithm providers.