Important
翻译是一项社区工作:ref:你可以加入<translation_guidelines>。此页面目前翻译进度为 51.81%。
15. 使用矢量瓦片
15.1. 什么是矢量瓦片?
矢量瓦片是地理数据包,打包成预定义的大致正方形的 "瓦片" ,便于在Web传输。结合了预渲染的栅格地图瓦片和矢量地图瓦片。矢量瓦片服务器返回矢量地图数据,该数据已被裁剪到每个瓦片的边界,而不是预渲染的地图图像。裁剪的瓦片表示矢量瓦片服务的缩放级别,该缩放级别源自金字塔方式。与非瓦片的矢量地图相比,使用此结构可以减少数据传输。只需传输当前地图视图以及当前缩放级别的数据。此外,与瓦片栅格地图相比,数据传输也大大减少,因为矢量数据通常比渲染的位图小得多。矢量瓦片未分配任何样式信息,因此QGIS需要应用制图样式来显示数据。
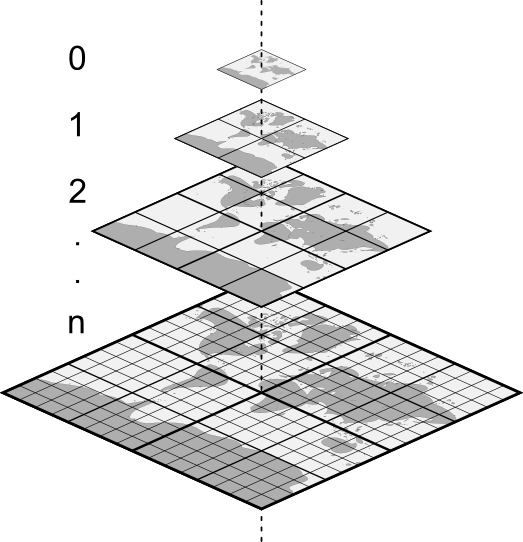
Fig. 15.1 具有缩放级别的矢量瓦片的金字塔结构
15.2. 支持的格式
通过以下方式支持矢量瓦片:
远程源 (HTTP/S) - 使用XYZ模板 -
type=xyz&url=http://example.com/{z}/{x}/{y}.pbf本地文件 - 使用XYZ模板 - 例如:
type=xyz&url=file:///path/to/tiles/{z}/{x}/{y}.pbf本地MBTile数据库 - 例如:
type=mbtiles&url=file:///path/to/file.mbtiles
要将矢量瓦片数据集加载到QGIS,请使用 数据源管理器 对话框中的  矢量瓦片 选项卡。更多信息,请参阅 使用矢量瓦片服务 。
15.3. 矢量瓦片数据集属性
矢量瓦片 图层属性 对话框提供以下部分:


15.3.1. 信息属性
信息 选项卡是只读的,代表了一个有趣的地方,可以快速获取当前图层的摘要信息和元数据。提供的信息包括:
基于图层的提供程序:名称、URI、源类型和路径、缩放级别的数量
自定义属性,用于在活动项目中存储有关图层的附加信息。使用PyQGIS可以创建和管理更多的属性,特别是通过 setCustomProperty() 方法。
the Coordinate Reference System: name, units, method, accuracy, reference (i.e., whether it is static or dynamic)
从 已填充的元数据 中提取:访问、范围、链接、联系人、历史记录等
15.3.2. 源属性
 源 选项卡显示所选矢量瓦片的基本信息,包括:
图层名 显示在 :guilabel:`图层面板`中;
the Coordinate Reference System: Displays the layer's Coordinate Reference System (CRS). You can change the layer's CRS, by selecting a recently used one in the drop-down list or clicking on the
 Select CRS button (see 坐标参照系选择器).
Use this process only if the layer CRS is wrong or not specified.
Select CRS button (see 坐标参照系选择器).
Use this process only if the layer CRS is wrong or not specified.For file based vector tiles (
.vtpkor.mbtiles), a Layer source group indicates the path to the source of the dataset and allows for replacing the loaded layer. Edit the path shown in the text box or press ... Browse to select another file on the disk.
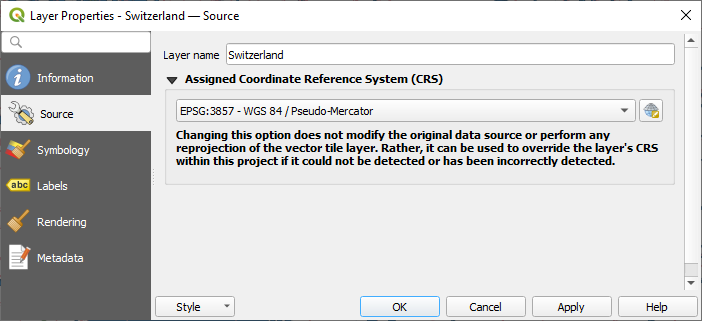
Fig. 15.2 Vector Tiles Properties - Source Dialog
15.3.3. Symbology and Labels Properties
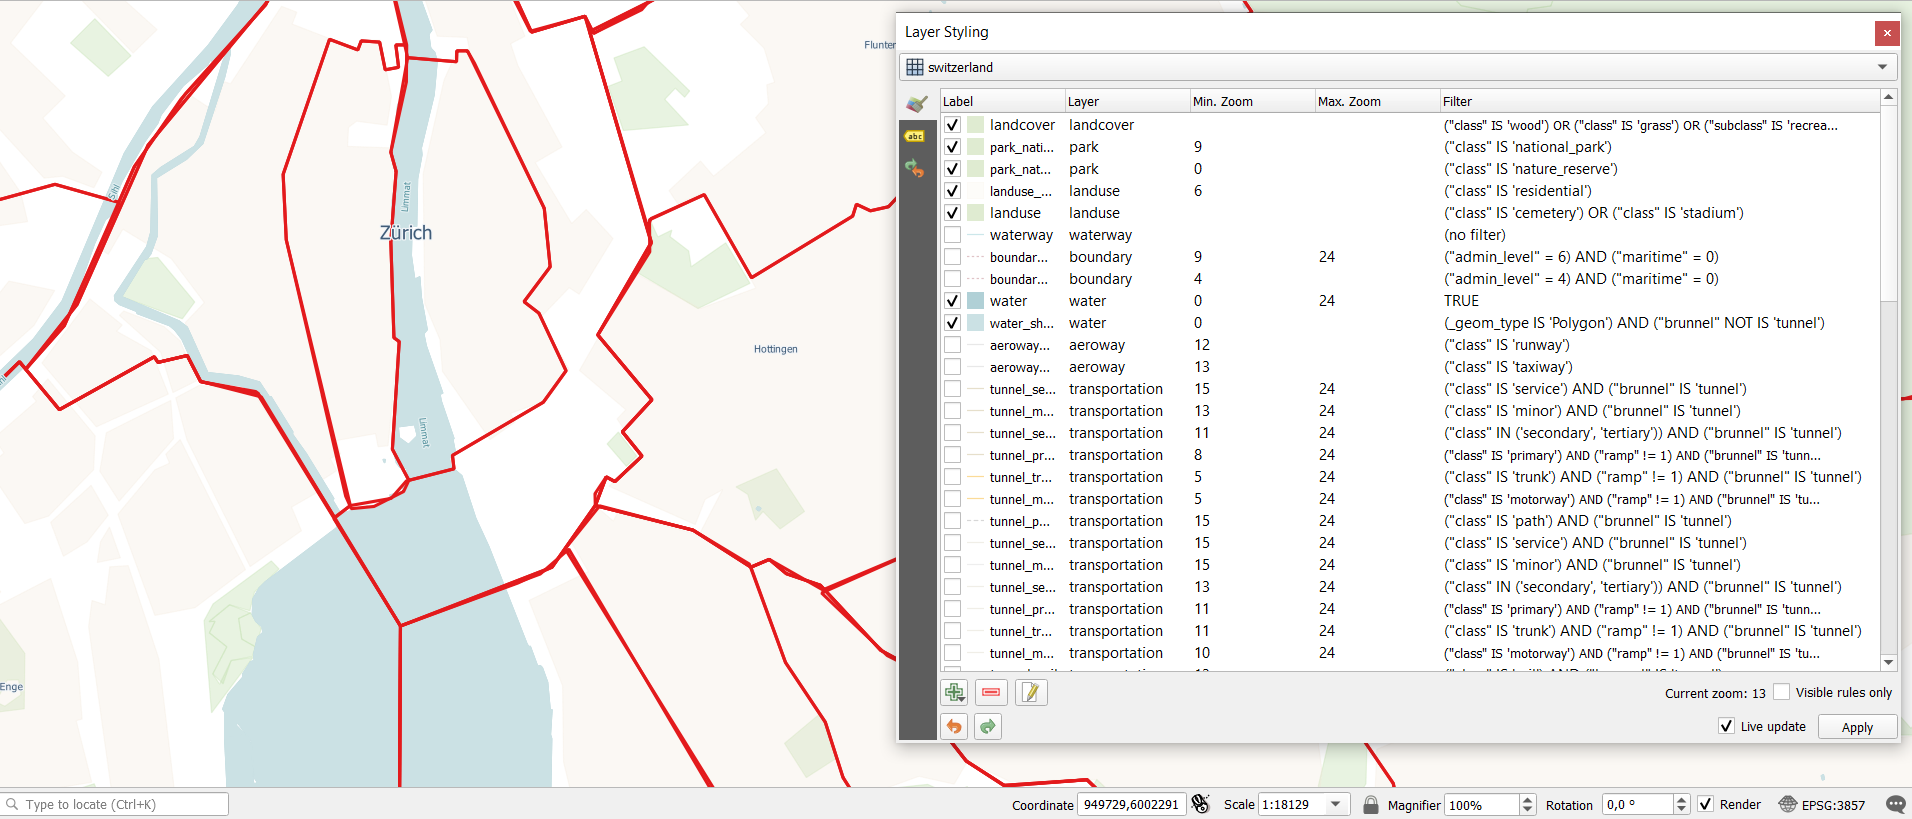
Fig. 15.3 矢量瓦片图层符号化
15.3.3.1. Setting rules
As vector tiles consist of point, line and polygon geometries, the respective symbols are available. To apply a cartographic style (with symbology and/or labels), you can either:
Use a Style URL when creating the Vector Tiles Connection. The symbology will be shown immediately in the
 Symbology tab
after the layer is loaded in QGIS.
Symbology tab
after the layer is loaded in QGIS.Or build your own symbology and labeling in the corresponding tabs of the layer properties. By default, QGIS assigns an identical symbol to the features based on their geometry type.
In both cases, setting a style for a vector tile relies on a set of rules applied to the features, indicating:
a Label, a title for comprehensive identification of the rule
the name of a particular Layer the rule should apply to, if not applied to
(all layers)a Min. Zoom and a Max. Zoom, for the range of display. Symbology and labeling can be dependent on the zoom level.
a Filter, a QGIS expression to identify the features to apply the style to
Each rule is added pressing the  Add rule button
and selecting the type of symbols (Marker, Line, Fill)
corresponding to the features geometry type.
You can as well
Add rule button
and selecting the type of symbols (Marker, Line, Fill)
corresponding to the features geometry type.
You can as well  Remove selected rules or
  Edit current rule.
At the bottom the Current Zoom is shown.
Check the  Visible rules only option at the top of the dialog
to filter the list of rules to only those that are visible at the current zoom level.
This makes it easier to work with complex vector styling and to locate troublesome rules.
The
Visible rules only option at the top of the dialog
to filter the list of rules to only those that are visible at the current zoom level.
This makes it easier to work with complex vector styling and to locate troublesome rules.
The  Filter rules text box also helps you easily find a rule,
by searching the Label, Layer and Filter fields.
Filter rules text box also helps you easily find a rule,
by searching the Label, Layer and Filter fields.
In Fig. 15.3 we set up style for the OpenStreetMap landuse layer.
For better visibility most of the rules are deselected.
15.3.3.2. Layer rendering
From the Symbology tab, you can also set some options that invariably act on all features of the layer:
Opacity: You can make the underlying layer in the map canvas visible with this tool. Use the slider to adapt the visibility of your vector layer to your needs. You can also make a precise definition of the percentage of visibility in the menu beside the slider.
Blending mode: You can achieve special rendering effects with these tools that you may previously only know from graphics programs. The pixels of your overlaying and underlying layers are mixed through the settings described in Blending Modes.
15.3.3.3. 样式
Available at the bottom of most of the tabs, the menu provides shortcuts to save, load, create, switch styles to apply to the vector tiles. Vector tiles can have their style saved from QGIS as QML files and they can be imported as:
QML files (QML - QGIS样式文件格式)
MapBox GL Json style configuration files
More details at 保存和共享图层属性.
15.3.4. Rendering Properties
Under Scale dependent visibility,
you can set the Maximum (inclusive)
and Minimum (exclusive) scales,
defining a range of scales in which features will be visible.
Out of this range, they are hidden.
The  Set to current canvas scale button helps you
use the current map canvas scale as boundary of the range visibility.
See 可见比例选择器 for more information.
Set to current canvas scale button helps you
use the current map canvas scale as boundary of the range visibility.
See 可见比例选择器 for more information.
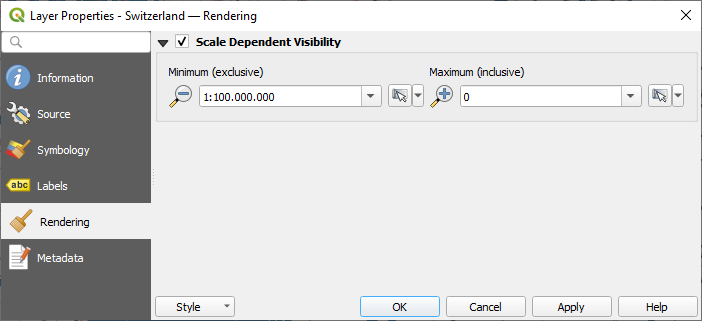
Fig. 15.4 Vector Tiles Properties - Rendering Dialog
15.3.5. 元数据属性
The  Metadata tab provides you with options
to create and edit a metadata report on your layer.
See 元数据 for more information.
Metadata tab provides you with options
to create and edit a metadata report on your layer.
See 元数据 for more information.
15.4. QGIS Server Properties
The  QGIS Server tab helps you configure
settings of the data when published by QGIS Server.
The configuration concerns:
QGIS Server tab helps you configure
settings of the data when published by QGIS Server.
The configuration concerns:
Description: provides information to describe the data, such as Short name, Title, Abstract, a Keyword list, and a Data URL whose Format can be in
text/html,text/plainorapplication/pdf.Attribution: a Title and URL to identify who provides the data
Metadata URL: a list of URL for the metadata that can be of
FGDCorTC211Type, and intext/plainortext/xmlFormatLegend URL: a URL for the legend, in either
image/pngorimage/jpegFormat